Featured
Trump’s Iran sanctions can pull oil prices up, Bitcoin price drops
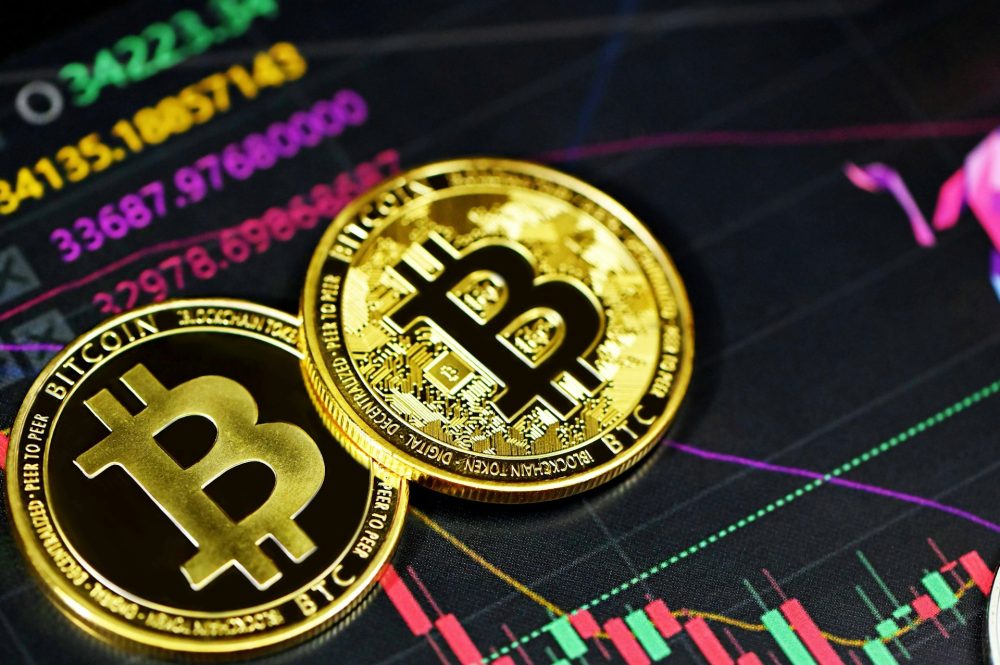
After Trump renewed Iran sanctions, crude oil prices might increase further and even reach $100 per barrel. Bitcoin’s price plunges to $8,500.

“The pioneering spirit should now lead American capital and American engineering to seek new sources of petroleum supplies in foreign fields for the benefit of the America of tomorrow. Nor can this be done without popular support inspired by general appreciation of oil as our servant, a servant that works 24 hours a day and 7 days a week.” —from National Geographic article, February 1920.
“Conservative estimates project a price of $80 a barrel, even if peace is restored to the Persian Gulf…” —quote from National Geographic, 1981, on the projected oil price for 1985
“We’re running out of oil!” —Harold Ickes, U.S. Secretary of the Interior, 1943.
“Drill, baby, drill!” —Sarah Palin, Republican VP nominee during vice-presidential debate 2008, but originally used at 2008 Republican National Convention by former Maryland Lieutenant Governor Michael Steele
It probably came as no surprise that U.S. President Donald Trump pulled the U.S. out of the Iran nuclear deal known as the Joint Comprehensive Plan of Action (JCPOA), a deal that had been signed by six nations—U.S., China, Russia, United Kingdom, France, Germany, and Iran.
The U.S. (Trump) pulled out despite the other signers of the deal saying it was a bad decision and even against his own intelligence and defence officials who had reiterated that Iran was compliant and that pulling out would be viewed by the wider world as betrayal by the U.S. European leaders were quoted as saying to Donald Trump that “You’re not the economic boss of us.”
At least two countries praised the pulling out—Israel and Saudi Arabia. That was no surprise as they have both been demonizing Iran since the nuclear deal was signed back in 2012.
Reactions in markets were rather muted. Gold reversed from down to up, but it was small, the stock market was steady and closed off small, while WTI oil prices were actually weaker throughout the day (sell on news?) but bounced back over $70 the next day and were soon over $71. The US$ Index soared over 93 and has managed to generally hold that level. For the markets, it has so far been a yawn, but may not stay that way for long.
Setting aside the potential for a real shooting war (which appears to be getting underway) the real war may be on the economic front. Sanctions are like tariffs only worse as they are usually one-sided. Numerous newspapers and analysts have already written on the subject, so we freely admit some of these are a good summary. Ironically, one of the major casualties is a large U.S. company—Boeing (BA-NYSE). Boeing, along with the French airline manufacturer Airbus (EADSY-OTC PINKS), is poised to lose Iranian contracts for airplanes worth $39 billion.
The deals will be revoked. Airbus is hit immediately as they had already started to deliver planes. And there was a contract for 100 planes for $19 billion. More than 10% of Airbus’ parts are made in the U.S., thus making them eligible for sanctions. Airbus’ contracts for parts also included General Electric (GE-NYSE). GE will also be negatively impacted. Boeing will be okay because of a large backlog of orders and nothing has been delivered or even logged into their book. Interestingly, Boeing said the deal would support 100,000 jobs. No more.
Numerous oil companies have or will have had contracts with Iran to develop their oil and gas industry. Companies included Royal Dutch Shell (RDS.A-NYSE) and Total of France amongst others. Numerous European companies could be negatively impacted, especially if they do considerable business in the U.S. But the last time the EU and the U.S. clashed over Iran sanctions, the U.S. was forced to back down. The EU used blocking statutes to protect EU companies such as Total and Airbus.
Otherwise, it could spark a trade war between the U.S. and the EU. Trump has already demonstrated an ability to threaten and then walk it back to come up with a deal. This has occurred with China and why it has yet to materialize into an all-out trade war. Relations with the EU are already badly frayed over threats of tariffs and pulling out of the Paris climate agreement.
One area that is being hit is rising oil prices. Iran has the fourth-largest crude oil reserves in the world. They also have about 20% of the world’s natural gas. Relief from sanctions meant that oil production in Iran had grown to 3.8 million barrels a day and a major buyer of oil and petroleum products was the EU. The EU was using this to wean some of their needs away from Russia.
Sanctions will mean that Iran’s production will be curtailed and that, in turn, could negatively impact oil prices. And it could push the EU back into dealing with Russia for oil. In that respect, higher oil prices and sanctions against Iran could make Russia a winner. Saudi Arabia would also be a winner because of higher oil prices. U.S. shale producers could also benefit.
But a clear big loser would be car drivers as rising oil prices, coupled with already high refining costs, will push up the price of gasoline at the pump. Rising oil prices could also push up inflation, thus putting further upward pressure on interest rates. With a world in debt to the tune of $237 trillion, rising interest rates could yet prove to be a death knell for the global economy.
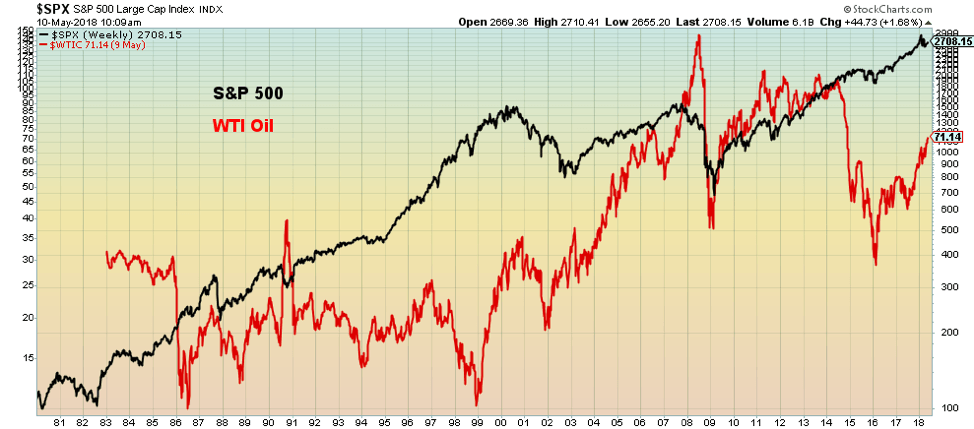
But rising oil prices also have an interesting correlation with stock markets and the economy. Do high oil prices spell difficulty for the stock market and economy? Well, the answer is yes and maybe.
The clearest example was the Arab oil embargo of 1973–1974. It was a shock as the western world was used to having its own way with the Mid-East and kept the price artificially low to the detriment of the Mid-East states. No longer. Oil prices shot from roughly $3.50/barrel to over $10/barrel. The Dow Jones Industrials collapsed 45%, and the western world fell into the steepest recession since the Great Depression. Rising oil prices were not the only contributor to the falling stock market, but it was a significant factor.
Seven years later came the Iranian crisis when oil prices shot from roughly $15/barrel to almost $40/barrel. Once again, the stock market faltered, falling eventually into the key August 1982 low even as the actual drop was only around 25%. The subsequent recession that lasted roughly from 1980 to 1984 was even more difficult than the 1974/1975 recession.
Next came Gulf War 1 (1990) and oil prices that had collapsed in the 1980s shot from about $18/barrel to over $40/barrel. Once again, the stock market faltered, but it was a muted 20% decline. The economy once again fell into a recession that lasted off and on to about 1992. After collapsing to about $11/barrel by 1998, oil prices began to rise sharply and by 2000, hit $34/barrel. All of this was just in time for the high tech/internet collapse and the recession of 2000–2002. Next up was the run to record prices of $147 in 2008.
By 2002, oil prices had fallen back to about $21/barrel, but over the next several years, oil prices kept on rising hitting their peak in 2008. It was just in time for the 2008 financial crisis (although it wasn’t triggered specifically by high oil prices) where the stock market collapsed 55% and another steep recession darkened the world, a recession that almost turned into a depression. Oil prices collapsed once again and hit around $40/barrel in late 2008. After rising back to $100/barrel oil prices collapsed again and bottomed in early 2016 at around $28/barrel. And now they are rising once again.
A crisis in the Mid-East involving Iran could send oil prices over $100/barrel once again. Significantly, oil prices have almost tripled since their low near $26 in early 2016. The last time oil prices tripled was from 1998 to 2000, and by 2001 the U.S. tipped into a recession. Grant you, that also coincided with the high tech/internet crash and the events of 9/11. In looking at the chart below, falling oil prices have generally had the opposite effect. The stock market rises and the economy, helped by low oil prices, performs better.
© David Chapman
Most likely the biggest negative impact to Trump tearing up the Iranian nuclear deal is on Iran itself. While growth had returned to Iran following the lifting of the previous sanctions, it was fragile growth. Iran had largely experienced negative growth from 2012 to 2016.
Growth surged following the lifting of sanctions but has started to plummet once again. GDP peaked in 2011 at $592 billion. The official unemployment rate topped out at 14% in 2012, then tapered but has been rising again last at 11.9%. This is the official unemployment rate. The actual level is most likely higher. Youth unemployment currently exceeds 28% and has been as high as 30%. Under renewed sanctions, it is not likely to come down.
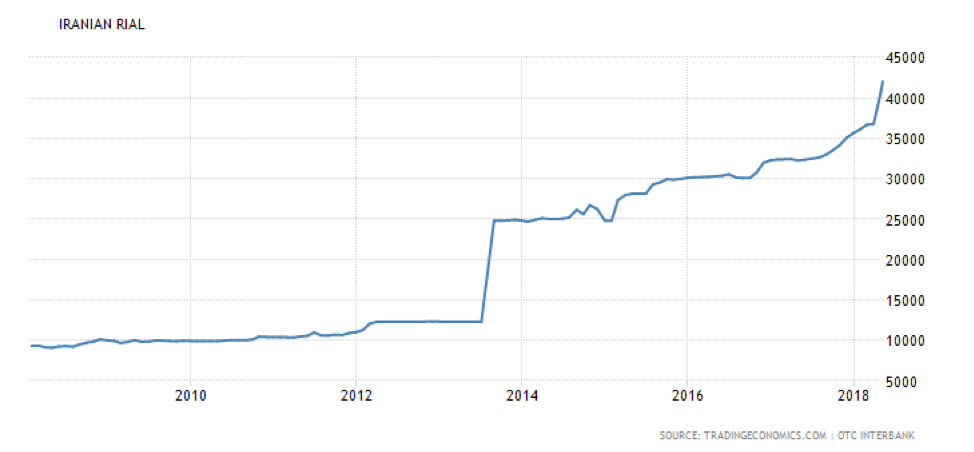
One of the most notable declines has been the value of the Iranian Rial. The Iranian Rial is last seen at US$1 = 42,000 Rials. Only a few weeks ago it was trading at US$1 = 38,000 Rials. Put the other way, it takes 42,000 Rials to buy 1 US$. Over the past year, the Rial has lost 22% of its value. Iranians have been buying Euros and US$ on the black market where prices are even higher. Iranians have also been buying gold.
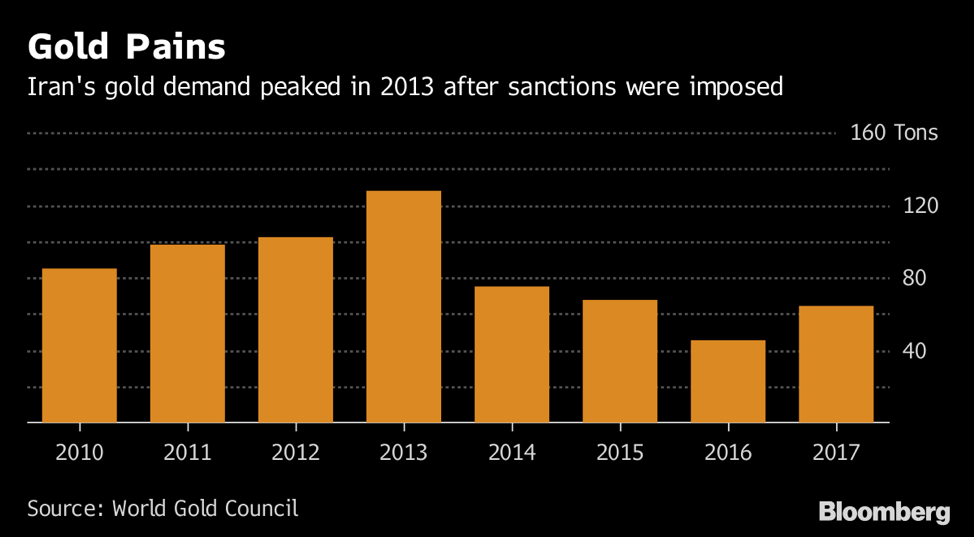
Gold demand in Iran surged following the imposition of previous sanctions in 2012. Purchases peaked in 2013 but tapered off after that. In 2017, Iranian gold demand was 64.5 tonnes. Despite all the sanctions, it is expected that neither China nor Russia will apply sanctions. Russia is already under U.S. sanctions, although the U.S. could put pressure on Chinese companies that operate in the U.S.
© David Chapman
© David Chapman
There are more losers than there are winners with sanctions being re-imposed on Iran. The biggest loser is probably Iran itself as it will cut into its ability to operate, slow its GDP, and even see it go negative once again as unemployment rises. Rising unemployment invariably leads to civil unrest. Iran has dealt with that before—harshly. The EU is a big loser as they had ramped up their trade with Iran. But U.S. companies will suffer as well. And all of us will most likely pay more at the pump because of these sanctions. But Saudi Arabia, Russia, and other oil producers probably won’t be complaining.
Bitcoin watch!
© David Chapman
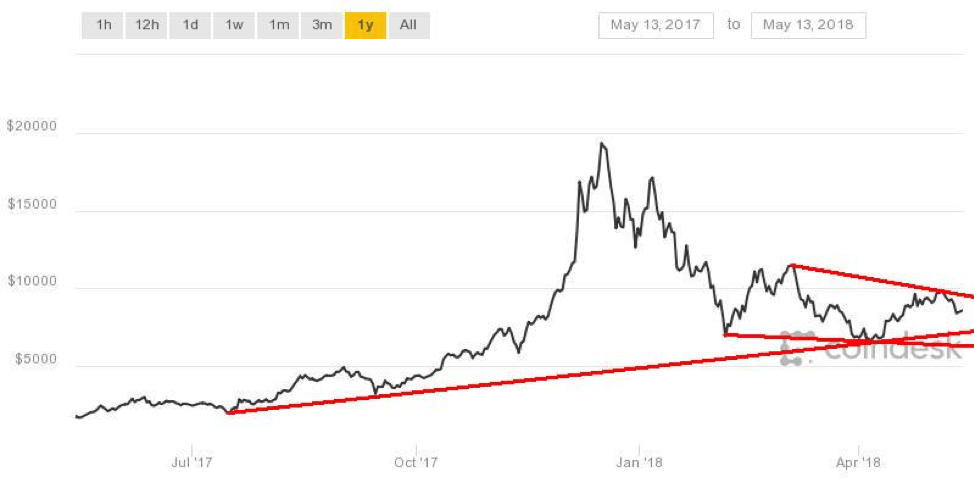
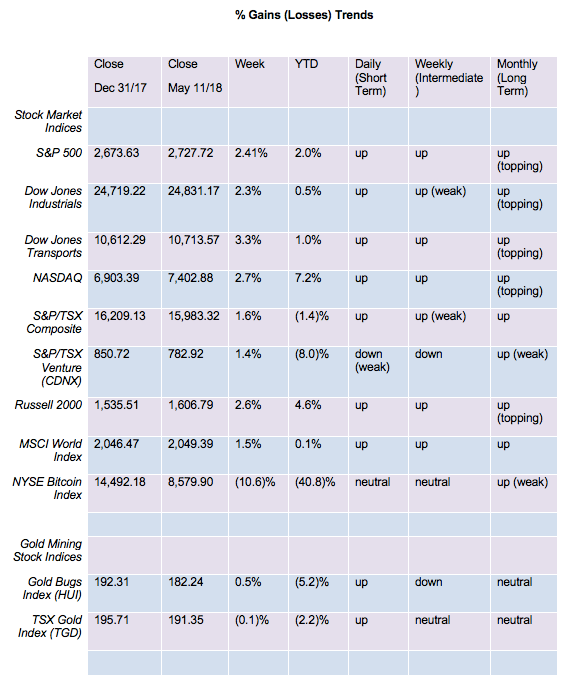
Is the most recent Bitcoin rally over? After hitting a high of about $9,900 on May 5, 2018, Bitcoin turned tail and dropped back toward $8,500. The result is that most cryptos fell at least 10% this past week, and many were down 30% or more. Bitcoin was off last by 11.5% on the week. After passing a market cap of $460 billion the previous week, crypto’s market cap has plunged back to around $385 billion, a loss of $75 billion in a week. Cryptos are not for the weak-hearted, it seems. Surprisingly, the number of listed cryptos at Coin Market Cap remained steady at 1,604.
Last week, we noted Goldman Sachs was getting into cryptos by trading Bitcoin-related contracts (derivatives) on behalf of clients. It seems rather ironic that back in December when the CME began trading Bitcoin futures, it marked the top in the market. Could Goldman be repeating that scenario and we have now seen another market top? Time will tell, of course.
Maybe it was the announcement by South Korea that prosecutors had raided the largest cryptocurrency exchange in the country, UpBit, on suspicion of fraud. Apparently, they are being accused of selling to fictitious people. Despite that, the exchange noted they were still open for business. South Korea is one of the largest traders of cryptos and regulators are trying to get a “lid” on the entire industry. It’s what one would expect from an industry that remains basically a “wild west.”
Ethereum futures are also starting to trade on a UK trading platform. Ethereum is the second-largest crypto behind Bitcoin with a market cap currently around $68 billion, roughly half the size of Bitcoin. As we have previously noted, the introduction of derivatives into the crypto market just gives more opportunity for arbitrage, short selling, and other game-playing that has been a feature of markets since futures were first introduced way back in the 1970s.
Previously, futures were largely an over-the-counter market, not on an exchange, and currency futures (or forwards as they were called) were the dominant instrument.
One of the more bizarre stories we saw this past week was the opening of a marketplace to buy and sell non-fungible digital items. The marketplace, known as OpenSea, allows buyers and sellers to dabble in what is known as CryptoKitties. They even call it an eBay for CryptoKitties. It is supposed to be a fun place and a fun use of blockchain. OpenSea even received $2 million in seed capital to start up. There are even CryptoCelebrities, CryptoPets, and Crypto All-Stars. Whether this makes any sense is, I guess, up to the players. Reminds me of Pokémon cards and that craze.
Below is an interesting chart from Tom McClellan whereby he has plotted Dow Jones Industrials (DJI) against Bitcoin. He believes the DJI has been following in the footsteps of Bitcoin, albeit lagged by roughly seven weeks in this case. He wonders if similar cycles and emotion in markets are at work that has fed this phenomenon.
There are, after all, numerous examples of emotion in one market being quickly assumed in other markets as well. Whether it is coincidental or lagged, it happens. We find it interesting but, as Tom notes, one shouldn’t base their trading strategy on it. The one below suggests there could be a low seen in the DJI around May 23, 2018.
DJI vs. Bitcoin
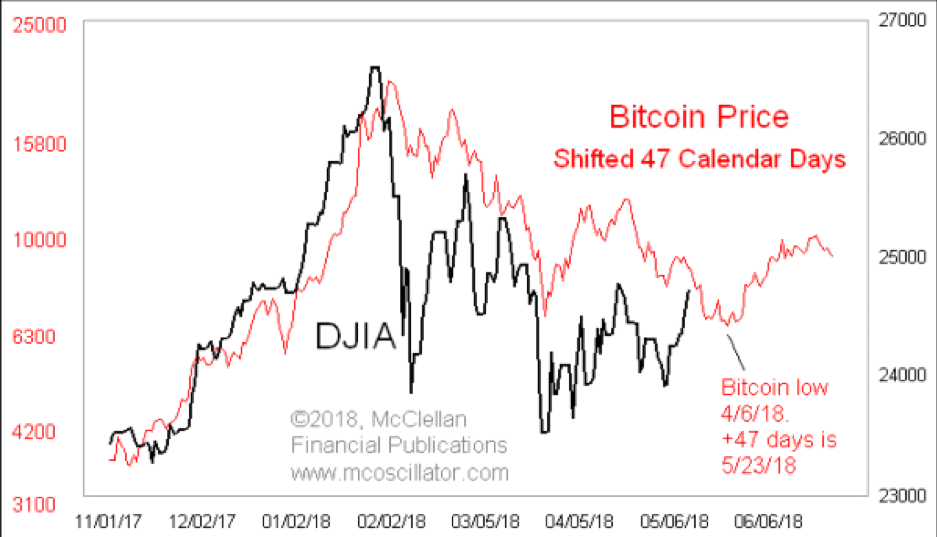
© David Chapman
After falling in what appears to be five waves down from the December 2018 high Bitcoin has embarked on what appears to be a corrective wave to the upside. If correct than the first, wave up may be complete. What should follow is a wave down (currently underway) followed by another wave to the upside. The corrective wave may be complete or may have some more downside. Below $8,300, Bitcoin could fall to between $8,200 and $7,800. Only below $7,400 are new lows possible.
Markets and trends
© David Chapman
© David Chapman
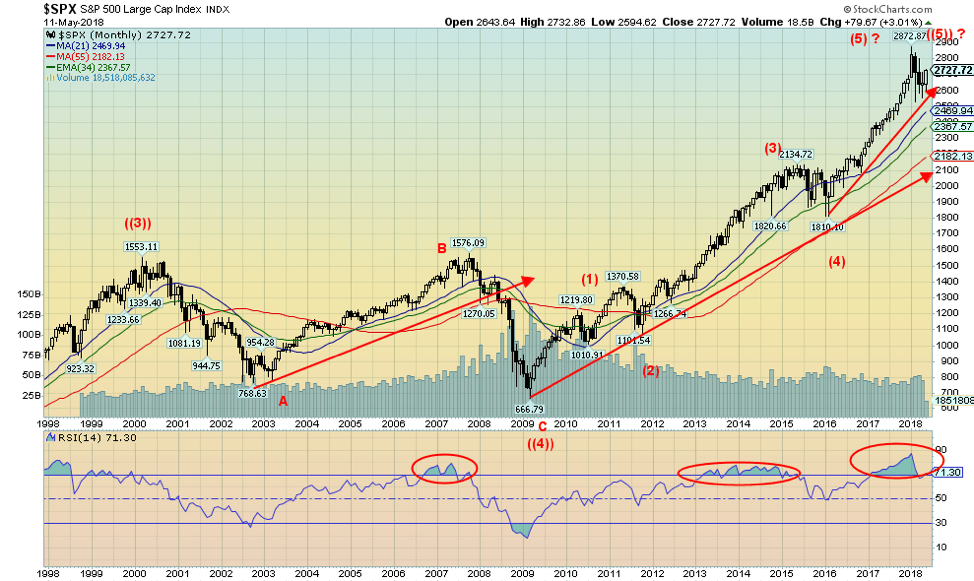
This is a long-term chart of the S&P 500 from the major top of 2000 to present. The major top in 2000 is considered the end of Cycle Wave 3 up of the long-term cycle that began in 1949. The low seen in 1949 is traditionally seen as the end of the long wave cycle of the Great Depression and War 1929–1949 (30 years). Admittedly, some see the up wave starting from the 1932 low and even the 1942 low, but many have traditionally used 1949 as the start date.
Since then, Wave 1 up was 1949–1966 (17 years), Wave 2 down was the corrective period seen from 1966–1982 (16 years) although again others use the 1974 low as the bottom of that wave, and Wave 3 culminated in 2000 after getting underway in 1982 (18 years). This final phase appears to be a down Wave 4 2000–2009 and a final Wave 5 up 2009–? If this fifth wave balances out with Wave 4, then it too could be nine years, suggesting that it could end this year.
What should follow is a long dark period. When we witness a world being challenged by dark forces of rising nationalism, threats to the global world order, ecological disaster, and the potential for global war it may well make sense. The question is, has the fifth wave topped or is there one more run to new highs? Either way, we are very late in the cycle.
© David Chapman
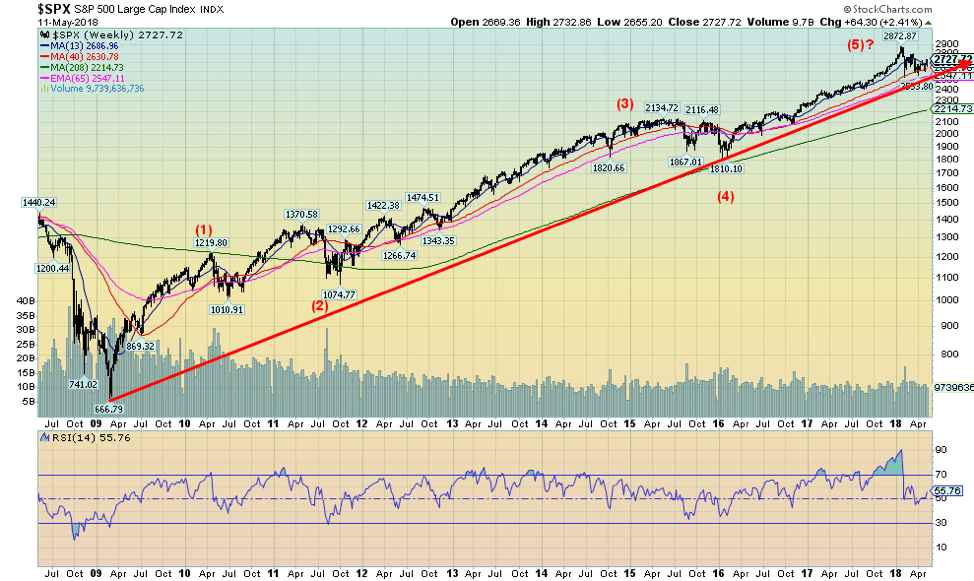
Here is the wave structure from the lows of 2009 following the financial crisis of 2008. It is noteworthy that the causes of the financial crisis of 2008 were never really solved. They were merely papered over. As we have noted, global debt has grown by almost $90 trillion since then and currently sits at around $237 trillion. The U.S. has 30% of that debt at $70 trillion. All collapses and major depressions are about debt collapse. To think that it won’t happen again is very naïve thinking.
The question is “when” not “if.” Since the bottom of 2009, we have seen two significant corrections—2011 at the time of the Greek/EU debt crisis and 2015/2016 when quantitative easing (QE) ended. Now, we have rising interest rates and, at least in the U.S., quantitative tightening (QT). The world has also moved that when the next crisis hits, it will be bail-ins, not bail-outs. All major western countries—the EU, the U.S., Canada, Australia, and Japan—have passed bail-in legislation.
What that means is, instead of the central banks coming to rescue and bailing out the financial system as they did in 2008–2009 with taxpayer’s money, it will be depositors and bondholders that will be bailed in and their deposits and bonds turned into equity. Interestingly enough, a bank in Spain, Banco Popular, has seen investors file lawsuits because their bonds were bailed-in. Since the decision to bail-in depositors and bondholders was determined by government legislation, it is unlikely to succeed.
© David Chapman
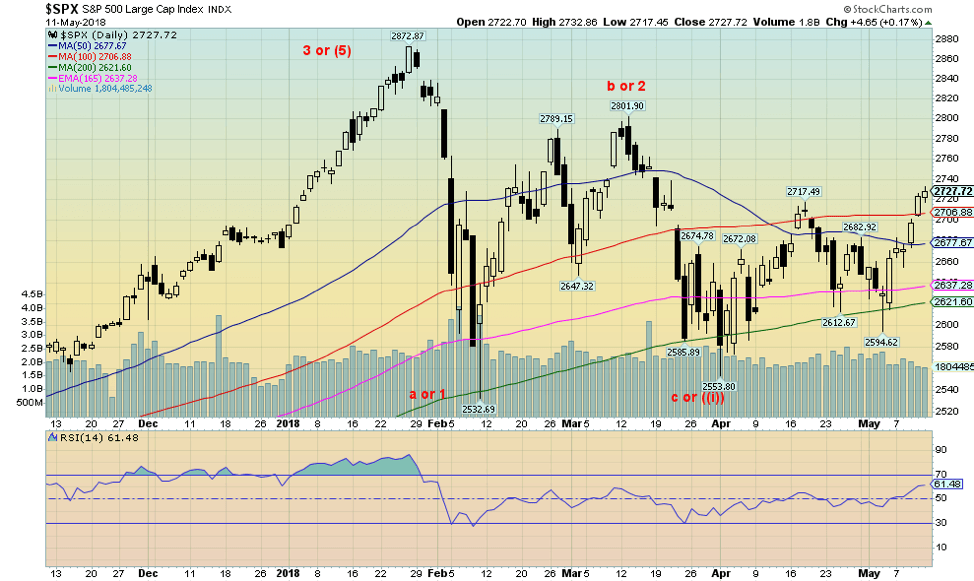
This is a closer look at the recent correction. Our thoughts are this is a correction to the most recent up wave and not the major top and start of a major decline. We believe that is to come. As we note, we are buoyed by a number of things. The correction was only about 10%; the 200-day MA was tested on three occasions and has (thus far) held; small cap stocks have held up remarkably well; and the commercials (banks, etc.) are net long, suggesting they believe that the market should head higher once again.
This past week, the S&P 500 broke out over the 100-day MA and took out the April 2018 high. There is still a lot of resistance above so this could still fail. Key will be the March high at 2,802. A break above that level would be quite positive. That would signal to us that new highs are highly probable. A return back under 2,680 would be negative. The 200-day MA is currently near 2,620. It is unlikely that would hold a fourth time.
© David Chapman
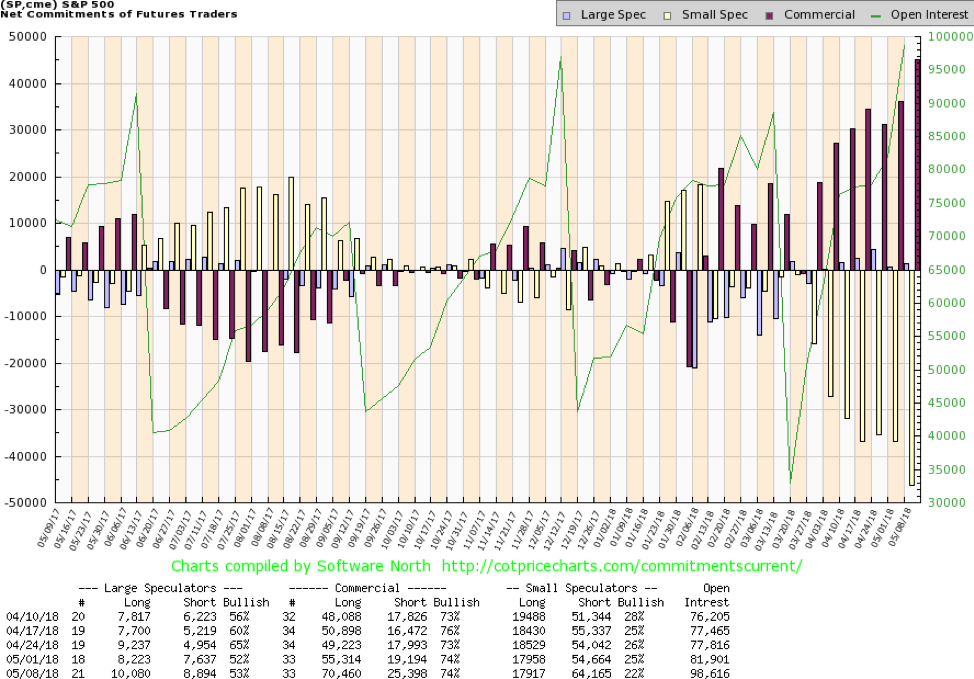
The commercial COT for the S&P 500 is currently bullish at 74%, unchanged from the previous week. The large speculators (hedge funds, managed futures, etc.) are even mildly bullish at 53% vs. 52% the previous week. The commercials added roughly 15,000 contracts to long open interest this past week, but they also added just over 6,000 contracts to short open interest.
Given a rising market total open interest also rose to 98,616 contracts from 81,901 contracts the previous week. That is considered positive as well. The commercial COT appears to be supporting the thought of higher prices ahead.
© David Chapman
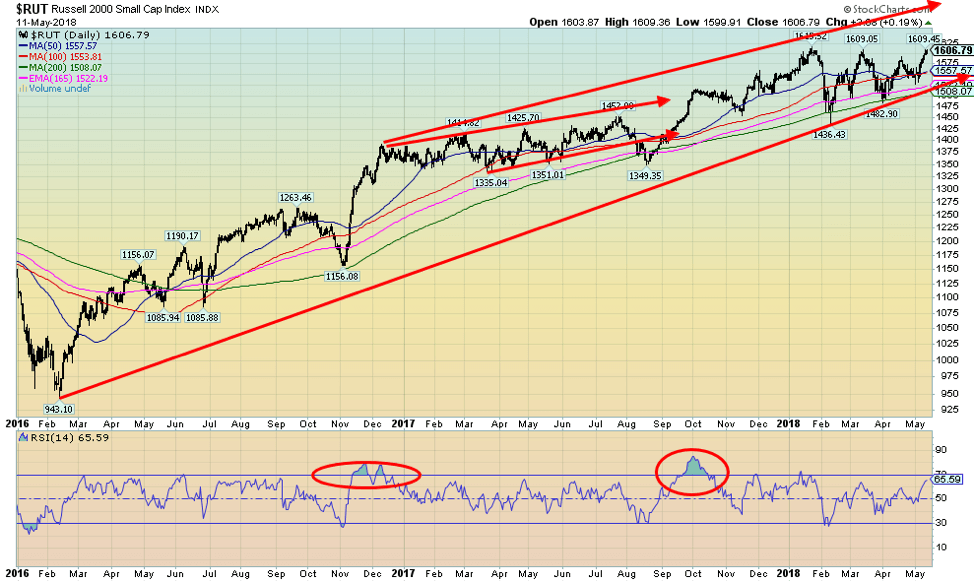
Another sign that the market could be headed higher is the strength seen in the small cap stocks. The Russell 2000 is now shy of its previous all-time high seen in January 2018. Odds are high that the index should make new all-time highs. As with the S&P 500, the 200-day MA held quite nicely on the recent pullback.
Small cap companies are admittedly less susceptible to the sanctions being placed on Iran and Russia, but they are susceptible to potential trade wars. That may be one of the reasons the Russell 2000 has managed to outperform. In any case, we view the positive performance of the small cap sector as a sign that the large cap sector should soon follow upwards towards new highs.
© David Chapman
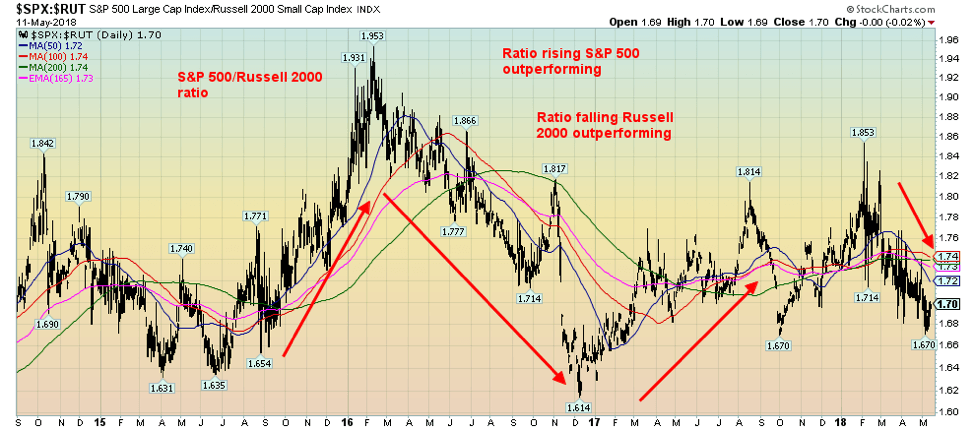
We consider this an excellent sign as to why the stock markets could reach new highs. As noted, the small cap stocks are not supposed to outperforming if the market was truly going to decline. The S&P 500/Russell 2000 ratio has been falling. Grant you, it is getting down to levels seen in the past so it could indicate a note of caution. On the other hand, it may just translate into the S&P 500 catching up and starting a rise that is faster than the Russell 2000.
© David Chapman
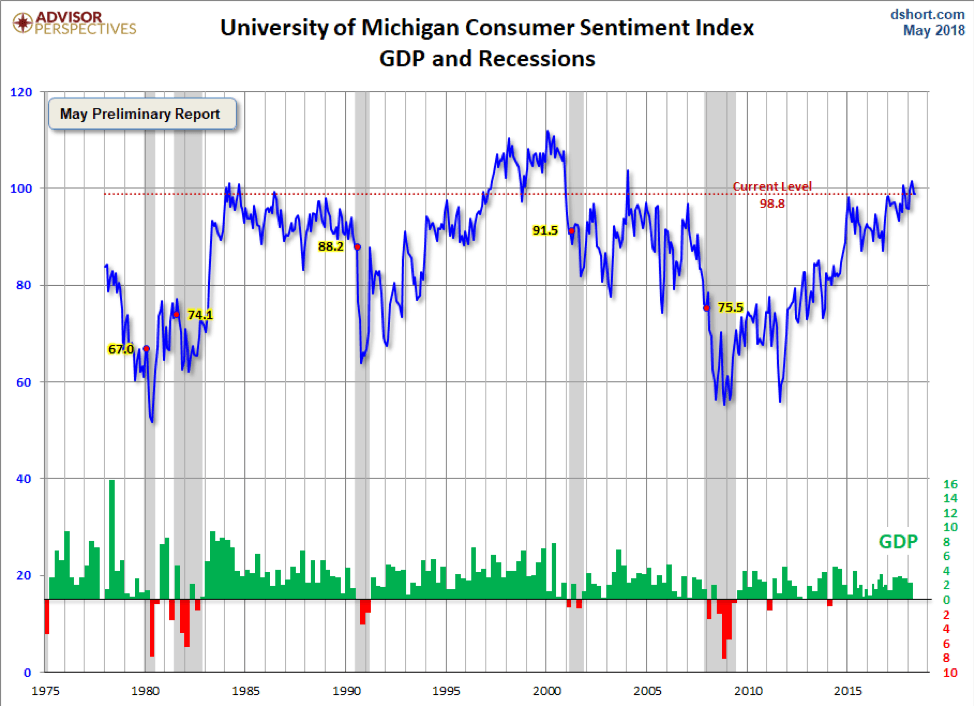
One reason we are buoyed by the thoughts of a higher stock market is that consumer sentiment remains quite good despite the backdrop of tearing up nuclear deals, potential for wars in the Mid-East (it’s over there), and Trump’s legal problems (it’s showtime). Unemployment is at a multi-year low, wages have been rising, there remains low but solid growth in the economy, and, as noted, the problems are either someone else’s or it’s over there.
In other respects, a continued high consumer sentiment index is troubling against the backdrop of polarization in the U.S. For whatever reason, it is not impacting that. The current levels are at a level where it could top out. It would be surprising under current circumstances that sentiment reached the levels seen in the late 1990s. The next move is highly likely to be down. Maybe the consumer should enjoy it while he can.
© David Chapman
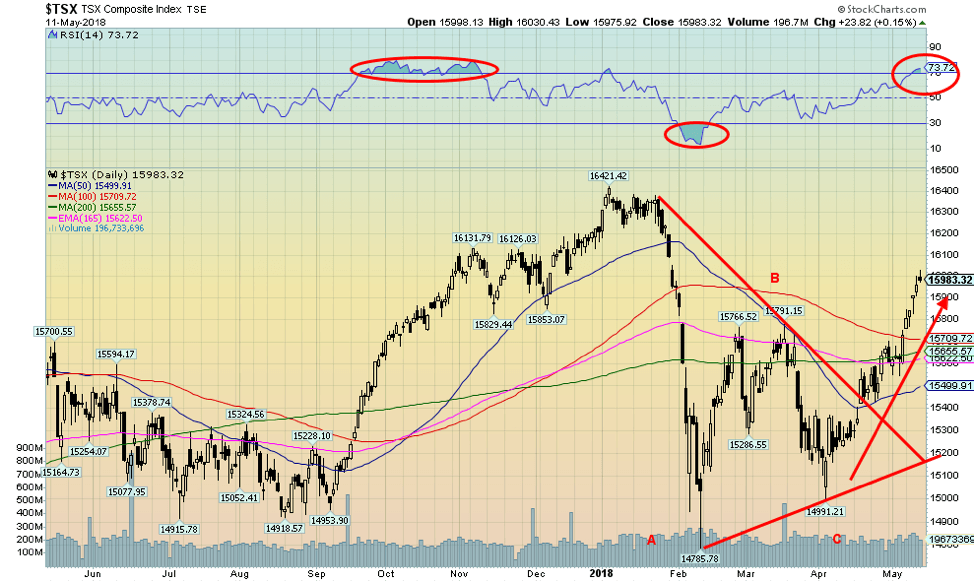
The pattern on the TSX Composite buoys our thoughts that there is potential for not only a retest of the highs but new highs. The corrective pattern following the top in January 2018 appears as an ABC pattern. A triangle formed and the TSX appears to have made a firm breakout and is now over key MAs. The TSX Composite has already surpassed the 61.8% Fibonacci retracement level of the decline from January to February. A move past 16,035, a level not very far away, could suggest that new highs lie ahead.
Not surprisingly, as we note later under our “Chart of the Week,” the energy sector could play a significant part. A rise in the golds and financials would also help. The TSX is currently overbought with an RSI over 70, but the RSI indicator can stay overbought for some time. It is a sign that the market is overbought. It doesn’t tell whether it is about to fall but does suggest that a decline could be imminent. That rise from September 2017 to January 2018 was relentless especially that first leg into November. The current move looks somewhat similar.
© David Chapman
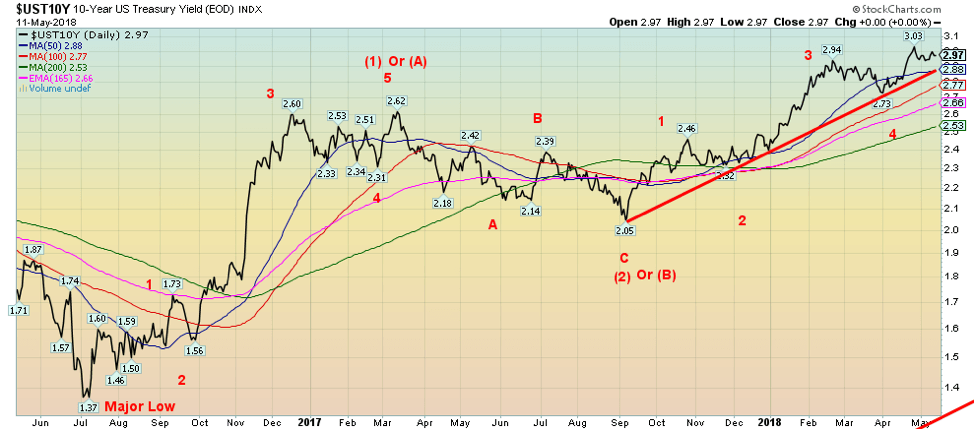
The 10-year U.S. Treasury note rose 1 bp to 2.97% this past week. The recent high for the 10-year was seen at 3.03%. The note has tried to rally (yields decline) but so far it has been feeble. Good support is seen at 2.88%. Note the spread between the 10-year and 30-year is quite narrow, currently at 13 bp. This is the lowest level seen since 2008 and the financial crisis.
Note the spread went negative in 2006 and also went negative in 2000. Significantly that was just before recessions. So, a narrowing 10–30 spread is also a sign of impending trouble down the road. As with the 2–10 spread it is not yet at levels that would signal an impending recession, but it’s definitely worth noting.
Recession watch spread
© David Chapman
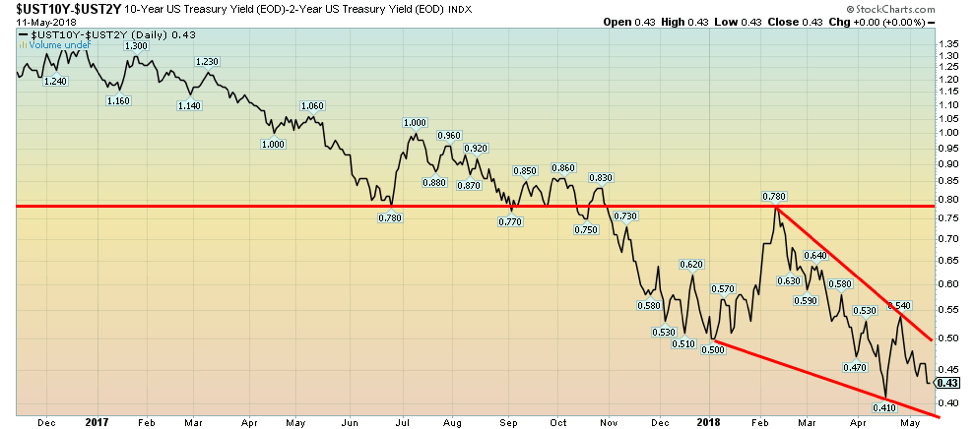
The 2–10 spread slipped another basis point this past week to 0.43% from 0.44% the previous week. The recent low was seen at 0.41%. The 2–10 spread is continuing its inexorable decline and if it goes according to some past events it should eventually go negative. We emphasize, however, that is not a given nor absolute necessary. But is likely as it has in past cycles. Usually, once it goes negative, there is upwards of a six-month lag before a recession gets underway. The current decline underway is pointing to trouble ahead, but probably not this year.
© David Chapman
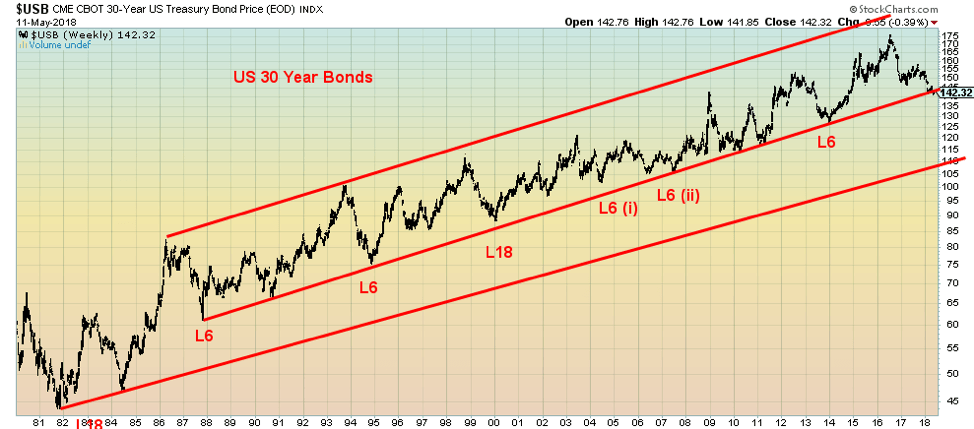
Given the recent rising interest rates, it is interesting to note that U.S. Treasuries have a somewhat reliable cycle. The longest cycle is one of 18 years as noted by analyst Ray Merriman (www.mmacycles.com). The major low in price (prices move inversely to yield) for the 30-year U.S. Treasury bond was seen in 1982. Eighteen years later, a significant low was seen in early 2000. The 18-year cycle tends to break down into either two cycles of nine years or three cycles of six years. The six-year cycle has tended to dominate. From 1982 significant lows can be seen in 1988, 1994, 2000, 2005/2007 (this one seemed to break up), and again in 2013.
That would make the next six-year cycle low due in 2019 which would coincide with an 18-year cycle low due 2018 +/- 3 years or 2015–2021. The six-year cycle can breakdown into 2 three-year cycles or 3 two-year cycles. There was a low seen in 2016 but it didn’t hold and the 30-year U.S. Treasury has since renewed its downtrend. That makes the overall cycle quite bearish. In theory, the cycle could bottom this year 2018 but could extend into 2019 before the final low (price) is seen. This puts the current rise in interest rates (fall in prices) in some perspective.
© David Chapman
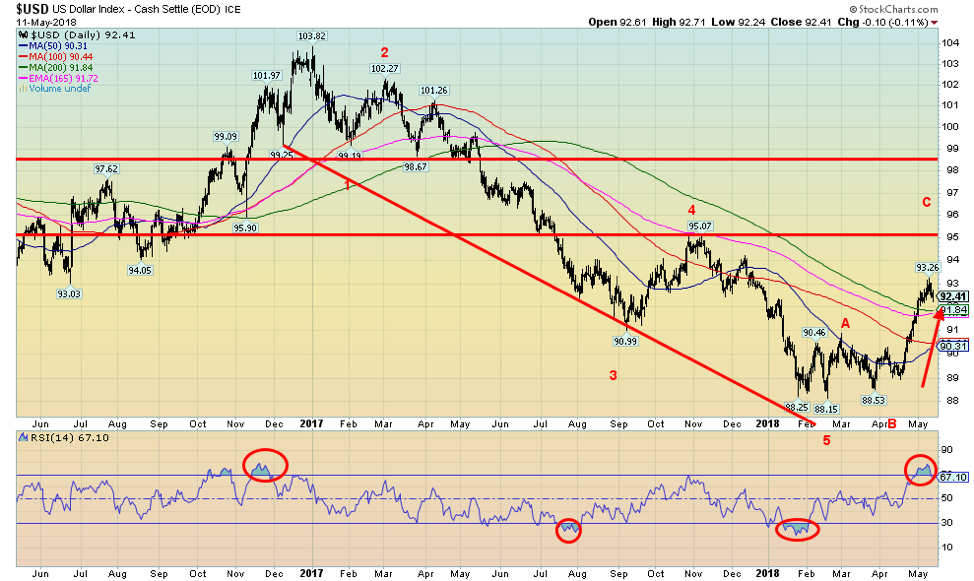
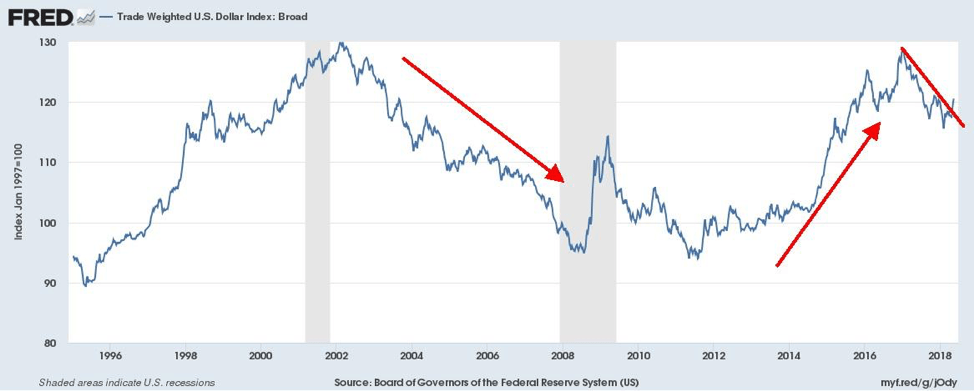
After climbing as high as 93.26 this past week the US$ Index reversed and closed mildly lower, losing 0.2%. The ones that gained included the Cdn$, up 0.5%. The Euro was off a small 0.1%. The reversal may not have been a surprise as the US$ Index had become quite overbought with an RSI above 70. So, a pullback seemed natural. We continue to believe that the US$ Index is in the throes of a correction to the long decline that got underway back in January 2017.
The US$ Index bottomed at 88.15 in February 2018. Potential targets are 92.50 (achieved) and next 93.70. We fell just short of that target this past week. Other targets could be 94.15, 96 and 97.86 (the Fibonacci 61.8% retracement level). There is considerable resistance up around 95.
But the U.S’s propensity for sanctions could eventually shift the US$ back to the downside. A lot of countries, especially in the EU, are not happy about the U.S’s latest sanction foray with Iran. Many were also not happy with the sanctions placed on Russia. We have noted that Russia and China are trying to move away from the US$.
Ironically, Iran announced they would no longer accept US$ for their oil, and shortly after the U.S. tore up the nuclear deal and a shooting match broke out between Israel and Iran. We had noted previously how Iraq and Libya tried to dump the US$ and were invaded or overthrown. China and Russia are trying to build an alternative payment system to the U.S-dominated SWIFT system. China and Russia continue to add to their gold reserves.
This past week, in reaction to the sanctions placed on Iran, Russian President Putin noted, “the whole world sees the dollar monopoly is unreliable; it is dangerous for many, not only for us.” Both Russia and China, in addition to stacking gold, are also cutting back on purchases of U.S. Treasuries. Recent Chinese purchases have been largely short-term U.S. Treasuries.
The US$ is seeing recent strength. But we believe this will end and another significant down leg in the US$ will get underway. Sentiment had reached almost 90% recently and that is usually a good sign that a pullback could soon get underway. It may have started this past week.
© David Chapman
The consensus index to follow for the US$ is what is known as the US$ Index. Futures trade on it and it is well established as a benchmark. The problem with the US$ Index it is not very broad and it is dominated by the Euro (57.6%). After that it is the Japanese Yen (13.6%), the Pound Sterling (11.9%), the Cdn$ (9.1%), the Swedish Krona (4.2%), and the Swiss Franc (3.6%). The broad trade weighted US$ Index encompasses many more currencies.
The components are major trading partners of the U.S. and it is weighted by their trade with the U.S. Components besides the major ones noted above also include Mexico, China, Taiwan, Korea, Singapore, Malaysia, Brazil, Thailand, Philippines, Australia, Indonesia, India, Israel, Saudi Arabia, Russia, Argentina, Venezuela, Chile, and Colombia. The presence of Argentina and Venezuela may surprise some, but the U.S. does have significant trade with these countries.
The picture is a bit different and it shows the US$ as being stronger than it shows against just the major components of the US$ Index. That makes sense as the US$ has been quite strong against numerous other currencies. And that is a problem for those countries especially if they have debt denominated in US$ which many of them do. A rising US$ is anathema to them as it makes it more expensive to service that debt. The broad US$ Index is off its highs and is showing signs of rising again. Economists and others pay attention to the broad US$ Index while the market watches the traditional US$ Index.
© David Chapman
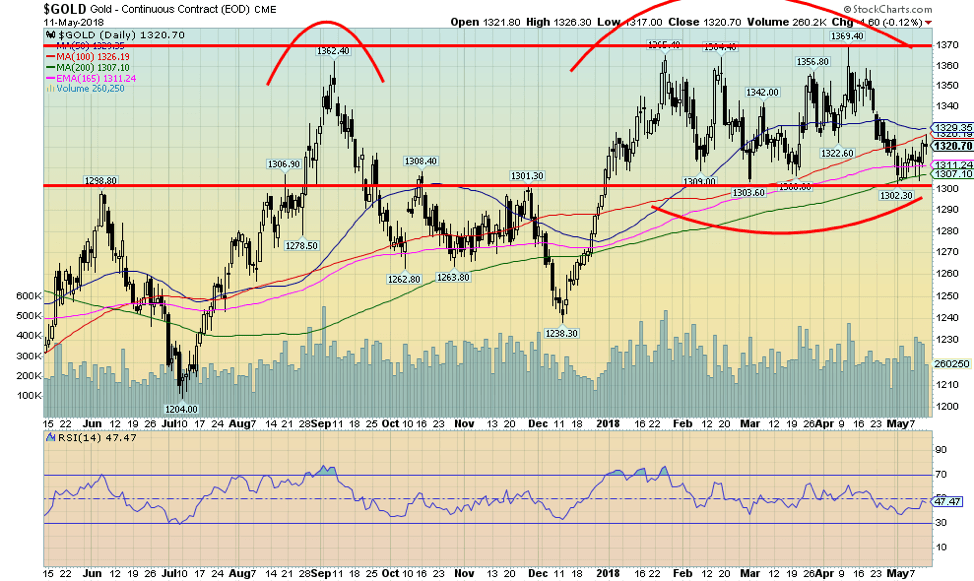
Gold prices managed to eke out a gain this past week, but it was a feeble one. Gold rose 0.5% and is now up about 0.9% on the year. Gold continues to hold support down towards $1,300 and the 200-day MA, currently at $1,307, also held. Gold has been frustrating. The major breakout zone is seen at $1,370 and it seems the entire world knows that. That may or may not explain why over the past several months approaches to $1,370 are sold while approaches towards $1,300 are bought.
It certainly defines the support/resistance levels. And everyone knows it. A breakout over $1,370 could see a run to $1,435. A breakdown under $1,300 could see a decline to $1,235. While we doubt the breakdown, we’d be foolish to rule it out. The US$ has been rising and typically if the US$ is rising gold, acting as it does as a currency, falls.
Despite the recent rise in the US$ Index gold’s decline has been muted. Gold could see some support from the outbreak of hostilities in the Mid-East particularly between Israel and Iran. A conflict between the two could quickly draw in many others; i.e., the U.S. and Russia. WTI Oil has been rising in price despite the rising US$. It is reacting to events in the Mid-East. Gold has not, at least not yet.
Gold’s short-term trend is still down but considerably weakened. The intermediate trend is currently neutral. It wouldn’t take much to move both into an up mode. Odds favour a rise for gold. An initial break over $1,330 would be positive and suggest further moves towards $1,340 and $1,350. Support down to $1,300 appears solid, but until we break higher we remain at least wary.
© David Chapman
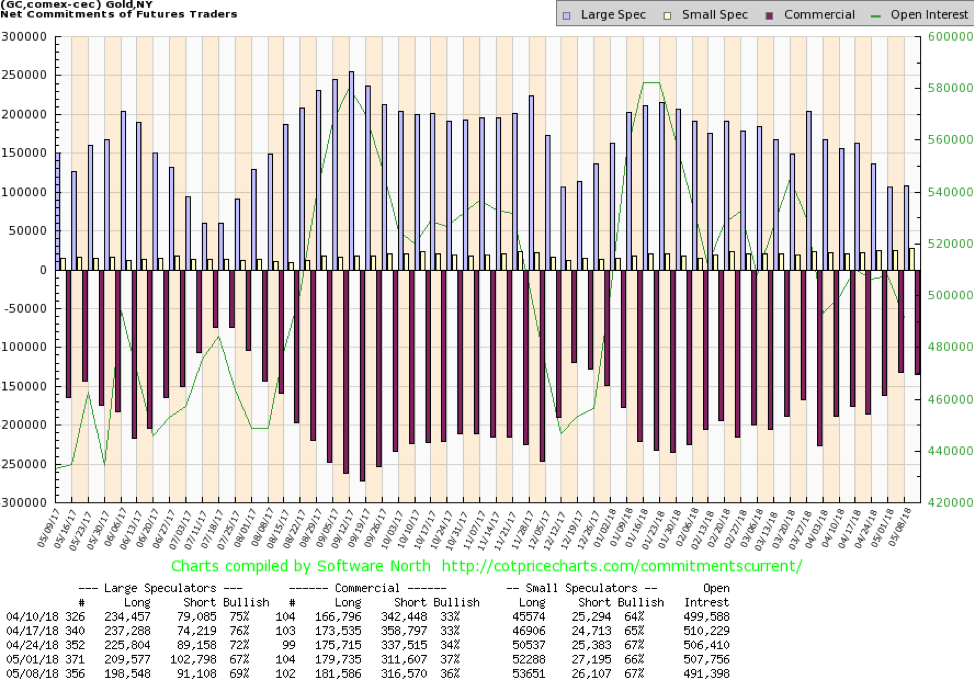
The gold commercial COT slipped slightly this past week to 36% from 37% the previous week. Long open interest did rise about 4,000 contracts but short open interest jumped about 5,000 contracts, offsetting the jump in longs. The large speculators COT (hedge funds, managed futures, etc.) rose to 69% from 67%. But it was the opposite with the commercials, who trimmed both their long and short open interest. We remain with the commercials and continue to view the gold COT as at least mildly bullish going forward. Ideally, we’d like to see it over 40% and even up towards 50%.
© David Chapman
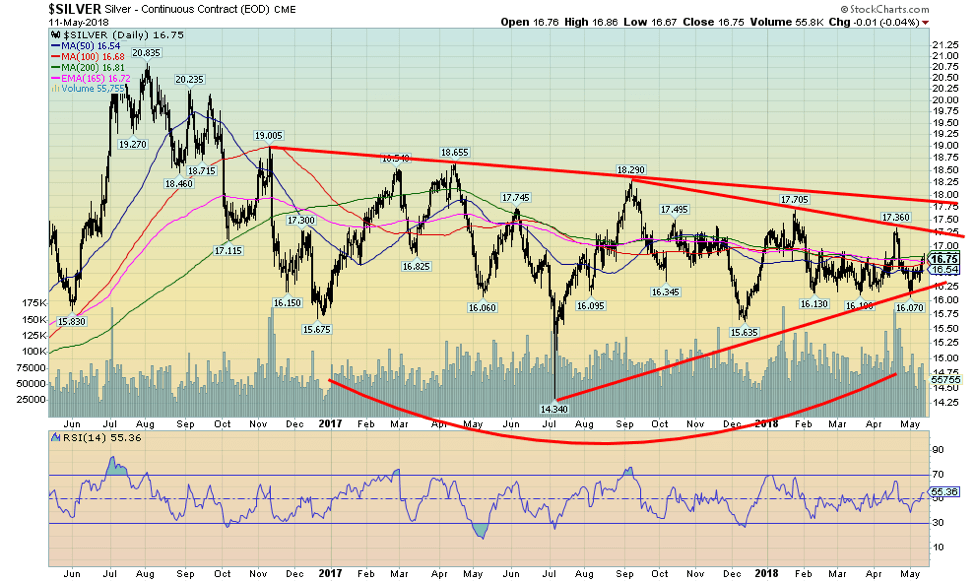
Silver rose 1.4% this past week and once again challenged the 200-day MA even as it failed to move over it. The loss on the year was cut to 2.3%. The short-term trend has turned up, but the intermediate trend remains in a weak downtrend. It won’t take much to turn the intermediate trend up. Silver continues to form what we believe is a large important bottom pattern but it remains frustratingly below key breakout levels. A move above $17.25 would be positive but a move above $17.75 would be significant and could, in theory, bring silver up to at least $22.40
. As we have noted on numerous occasions, silver remains cheap compared to gold. The gold/silver ratio has fallen to just under 79, but historically that remains quite high. In 2011, at the top of the market, the ratio was just under 32. We have noted that long-term ratios are closer to 16 to 20 although those levels haven’t been seen in years. The base on silver continues to grow. The question is “when,” not “if” silver breaks out.
© David Chapman
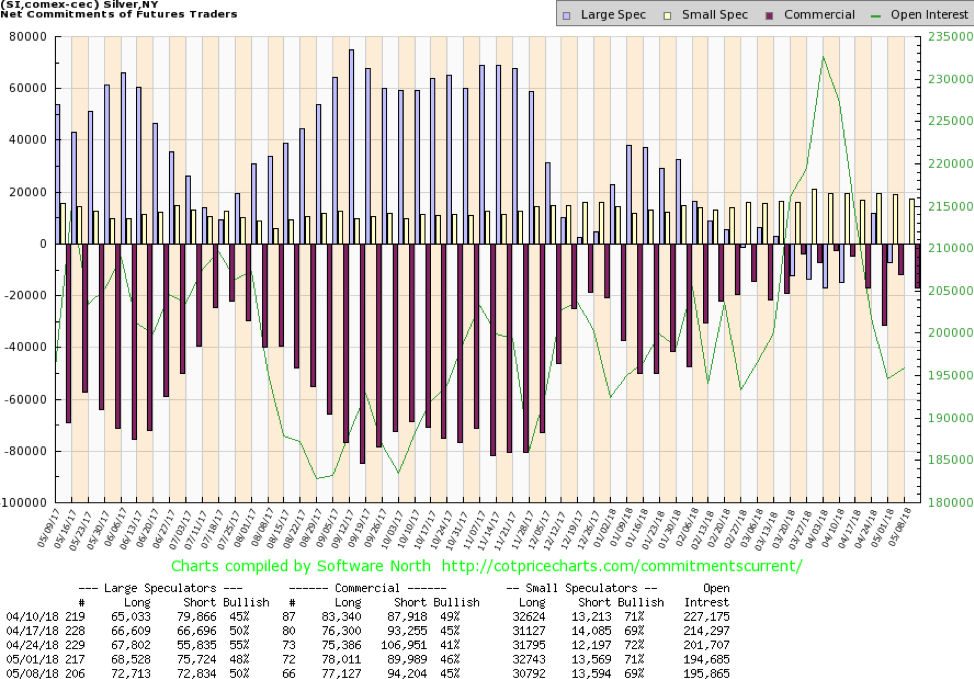
The silver commercial COT slipped back this past week to 45% from 46% the previous week. Long open interest fell just under 1,000 contracts while short open interest rose just over 4,000 contracts. The commercial COT remains positive and our expectation is silver prices should rise further. The large speculators COT jumped small to 50% from 48% as the large speculators added to their longs and cut their shorts. Overall, the silver COT remains positive.
© David Chapman
Gold stocks, as represented here by the TSX Gold Index (TGD), went nowhere this past week. The TSX Gold Index was off a small 0.1% while the U.S-based Gold Bugs Index (HUI) gained about 0.5%. Despite the relatively flat week the potential rising or ascending triangle continues to form. A firm break above 194 could see the TGD rise to at least 215. A firm breakout over 200 would be even more meaningful and could project the TGD up to 300 or higher.
The TGD remains well down from its all-time highs seen in 2011, off some 58%. At the major low in 2015 the TGD was down 75% but has since gone up by 66%. But it has been a slow grind. The TGD is still down roughly 33% from the seeming breakout high of July 2016. Nonetheless solid support is seen down to 172/175.
The TGD has been hitting the 200-day MA but has thus far failed to break up through it. Support is seen at 189, 187, and 182. The TGD has been holding up well of late, considering the recent weakness in the gold and silver. Since topping in 2016 the 200-day MA has acted as resistance on a number of occasions. That is why a firm break over 200 would be quite positive.
Chart of the week
© David Chapman
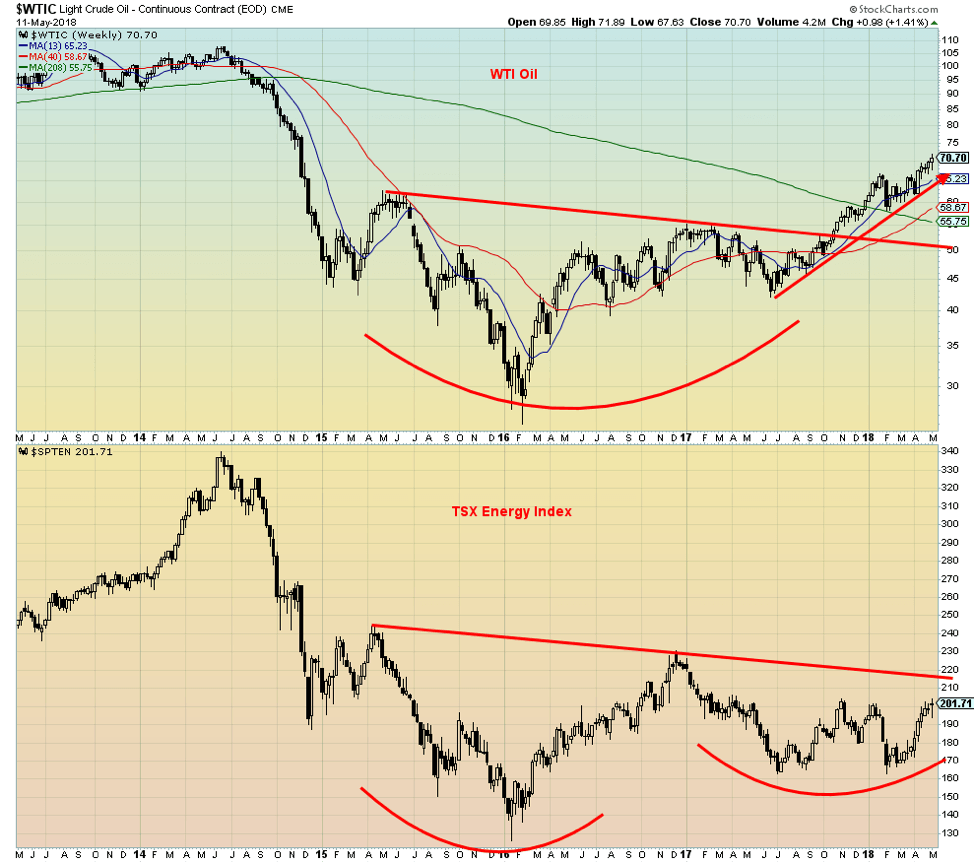
With oil prices rising and threats of war in the Mid-East, could the languishing energy stocks finally break out? While WTI Oil clearly broke out from a multi-year bottoming pattern, the TSX energy stocks have had a much tougher go. They are higher from that low in early 2016, but when you consider that WTI Oil is up 171% from its major low the TSX Energy Index (TEN) is up only 60% in the same period. While we often find significant divergences between the stocks and the oil price, that the stocks have lagged is, needless to say, somewhat of a surprise.
But this bottom pattern could soon translate into a significant move for the energy stocks. WTI Oil has an initial target zone for us up to $89 and, of course, could go higher if a serious war broke out in the Mid-East. The TSX Energy Index could have a target up to 271 as a minimum and even up to 340 once it firmly breaks out over its neckline, currently near 220. There is a lesser neckline as well at 204 so once over that level a move to 220 is likely. With low oil prices, energy stocks have been underperformers for a number of years. That may be about to change.
__
DISCLAIMER: David Chapman is not a registered advisory service and is not an exempt market dealer (EMD). We do not and cannot give individualized market advice. The information in this article is intended only for informational and educational purposes. It should not be considered a solicitation of an offer or sale of any security. The reader assumes all risk when trading in securities and David Chapman advises consulting a licensed professional financial advisor before considering a position in any security. That includes consulting with your own licensed professional financial advisor.


Youth Cannabis Use in Colorado Is Falling — But the Full Story Is More Complex
The 2026 Colorado survey shows teen cannabis use fell to 10 percent in 2025, down from 21 percent in 2015....


Morocco’s Growth Holds at 4.6% as Agriculture Offsets Economic Pressures
Morocco’s economy grew 4.6% in Q1 2026, driven by a strong agricultural rebound offsetting declines in industry. Services expanded moderately...


Abivax Shares Surge as New Trial Data Eases Safety Concerns Over Ulcerative Colitis Drug
Abivax shares surged nearly 36% after positive updated trial results for its ulcerative colitis drug obefazimod reassured investors following earlier...


El Dorado Raises $9M to Expand Cross-Border Fintech Platform
El Dorado, a Latin American fintech improving cross-border financial services, raised a $9 million Series A led by Paradigm with...


Bitcoin Stalls Near $60K as Strategy Moves, ETFs Outflow, and EU MiCA Rules Take Effect
Bitcoin hovers near $60,000 with ETF outflows, while Strategy boosts reserves, sells BTC, and raises dividends to reassure investors. Ethereum...
 |
|
 |  |
 |
|
-

 Crypto5 days ago
Bitcoin and Ethereum Slide as Market Pressure Builds Amid Strategy Concerns and Layer 2 Disruptions
-
 Business2 weeks ago
Fed Policy Shift Raises Concerns Over Debt and Inflation Risks
-
 Crypto1 day ago
Bitcoin Stalls Near $60K as Strategy Moves, ETFs Outflow, and EU MiCA Rules Take Effect
-

 Biotech1 week ago
Galicia Launches €805M Biotechnology Strategy to Drive Innovation and Competitiveness (2026–2030)
You must be logged in to post a comment Login