Markets
Turmoil at the White House as Trump administration and the Fed continue to clash
The odds of a clash between the Trump administration and the Fed looms as a real possibility. The Fed remains cautiously optimistic on the US economy with Fed Chair Janet Yellen characterizing the economy as “progressing nicely,” whereas Trump has called the US economy a “mess.”

The possibility of a clash between the Trump administration and the Fed is real as the Fed is optimistic about the US economy, whereas Trump thinks it’s a total mess.
The long anticipated March FOMC came and went, and, as was widely expected, the Fed raised the key Fed rate another 25 basis points (bp) to 0.75%–1.00%. Canada’s bank rate remains at 0.50%. It is the first time in years that Canada’s bank rate is below the Fed rate. The rate hike was widely telegraphed in advance, but if there was a change it was the Fed’s hawkish tone before the rate hike contrasted with a more subdued mood following the rate hike. Some termed the rate hike as the “dovish hike.” The markets had widely expected that the Fed would hike four times in 2017 but the latest indication from the Fed is that it might only be three.
Not quite as hawkish as the market had led itself to believe. The result was bond prices softened after the rate hike and gold soared. So did the stock market believing that all is well with the economy and that the Fed is not quite as hawkish as it was before. Still, the rate hike coupled with soothing tones from the Fed allowed economists to up their forecasts going forward.
The odds of a clash between the Trump administration and the Fed looms as a real possibility. The Fed remains cautiously optimistic on the US economy with Fed Chair Janet Yellen characterizing the economy as “progressing nicely,” whereas Trump has called the US economy a “mess.” With the potential for huge stimulus programs, tax cuts, and increased military and homeland security spending the Fed fears an upsurge in inflation. The administration’s desire to slash departments such as Justice and the EPA and a host of programs along with Obamacare is already running into considerable roadblocks in both Congress and the Senate. Many have said the proposed changes are “dead on arrival.” If the spending is increased without offsetting cuts, and even if they did happen, the proposals would still be potentially inflationary and add considerably to the US deficit.
Janet Yellen’s term ends in February 2018 and it is becoming widely expected that she won’t be renewed. With upwards of a year to go and the US debt ceiling expiring the potential for a clash between the Fed and the White House is real given their agendas are polar opposites.
The Trump administration was admonished by the Senate Intelligence Committee for their accusation that former President Obama tapped the Trump Tower during the election campaign. Even Great Britain was accused of acting on behalf of Obama, which was vehemently denied by Britain. The head of the FBI James Comey also denied that any wire-tapping took place. Nonetheless, the Trump administration continued their line that it did happen. The circus in the White House continues.
The Dutch election saw the re-election of a center-right party with the far right anti-EU party a distant second. That seemed to end at least one piece of political uncertainty hanging over the EU, but it hasn’t buried the anti-EU xenophobic populist parties. France’s Presidential election looms on April 23 and May 7 and Britain is on the cusp of triggering the Brexit which has to be done by the end of the month. The potential for turmoil in the eurozone remains real.
Model Portfolio
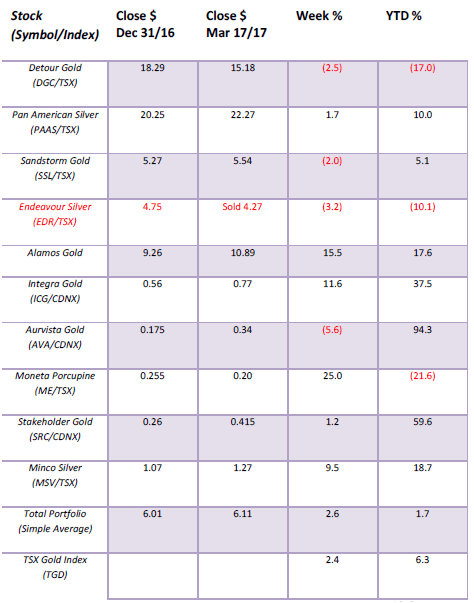
The model portfolio improved this past week. Of the big cap stocks, Alamos Gold (AGI/T) was the surprise with a 15.5% jump on the week. Detour Gold (DGC/T) continues to disappoint but we will continue to hold as it can move up and down quickly. Detour is in prime gold mining territory in Northern Quebec. Of the juniors, Moneta Porcupine (ME/T) had a recovery week and Integra Gold (ICG/T) had a good week.
© David Chapman
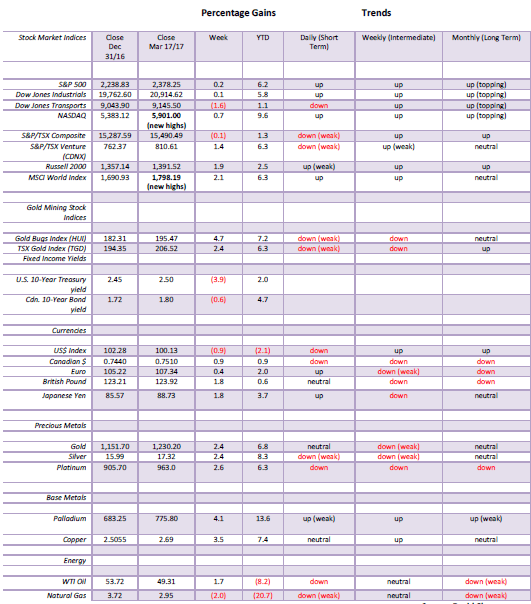
MARKETS AND TRENDS
© David Chapman
Note: for an explanation of the trends, see the glossary at the end of this article.
New highs refer to new 52-week highs.
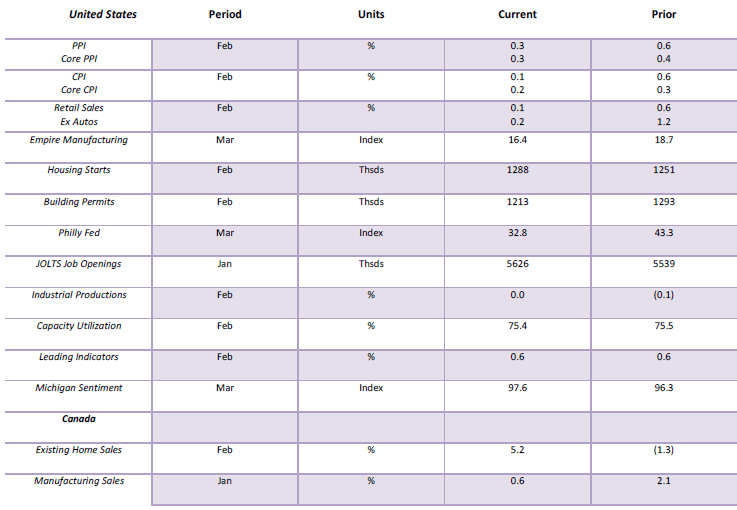
Key Economic Numbers Week March 13 – March 17, 2017
(Source)
(Source: www.shadowstats.com, www.data.bls.gov, www.statcan.gc.ca, www.tdeconomics.com)
Note: % M/M unless otherwise noted
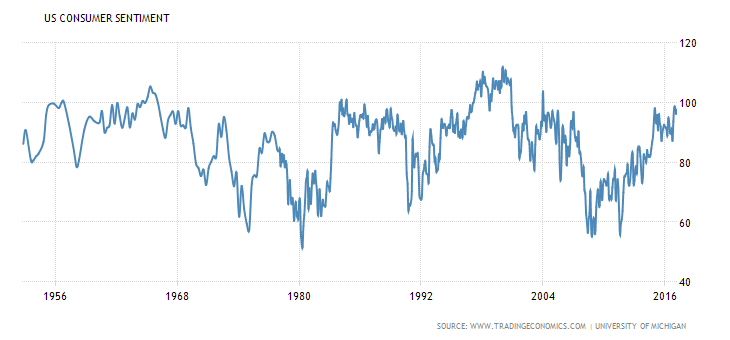
March consumer confidence as measured by the preliminary Michigan Sentiment Index rose to 97.6 from 96.3 the previous month. It was over the estimate reading of 97. The index is at its highest level since November 2000. Improved personal finances are behind the rise. The all-time high was in June 2000 at 111.40. The current Michigan Sentiment Index is higher today than it was in 2007 before the financial crash of 2008. Many are pointing to the high reading as confidence in the Trump administration and its plans for the economy. The other interpretation is that a high consumer confidence level was seen before important market tops. The consumer confidence index is seen as a contrarian indicator.
(Source)
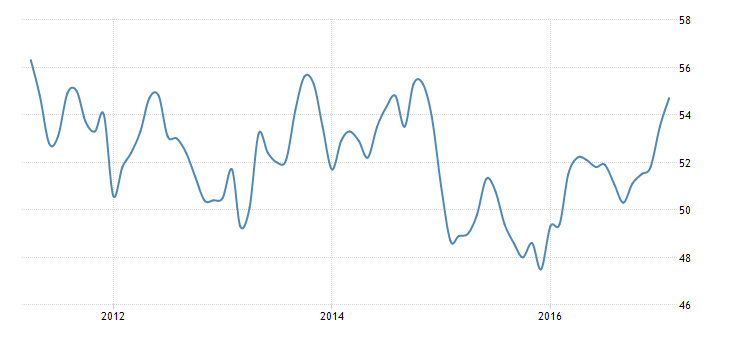
The Canadian Manufacturing PMI rose to 54.7 in February from 53.5 in January, the highest reading since November 2014. The high reading points to strong new orders and accelerated growth and production levels in Canadian manufacturing. It has pointed to strong employment growth as well. The all-time high was at 56.3 in April 2011. The report comes from Markit Economics.
(Source)
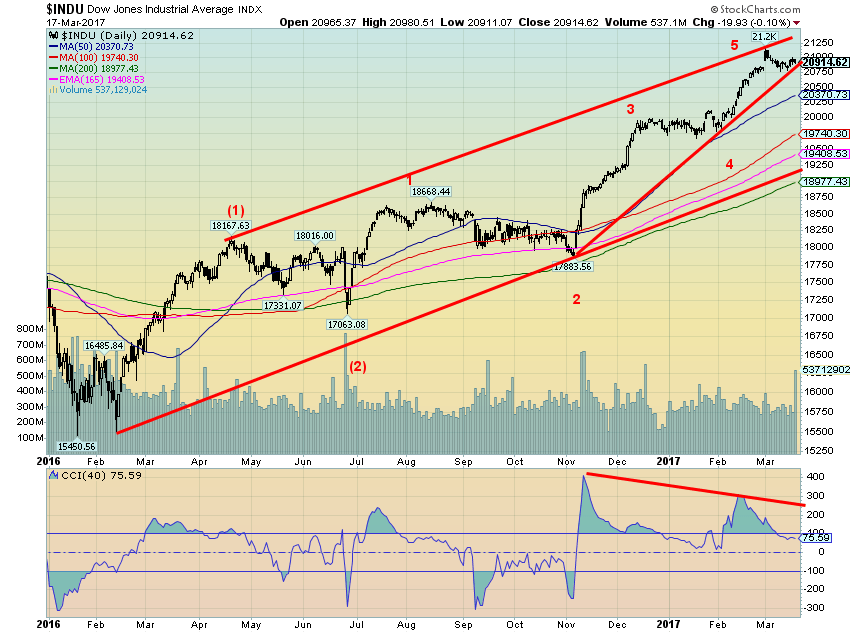
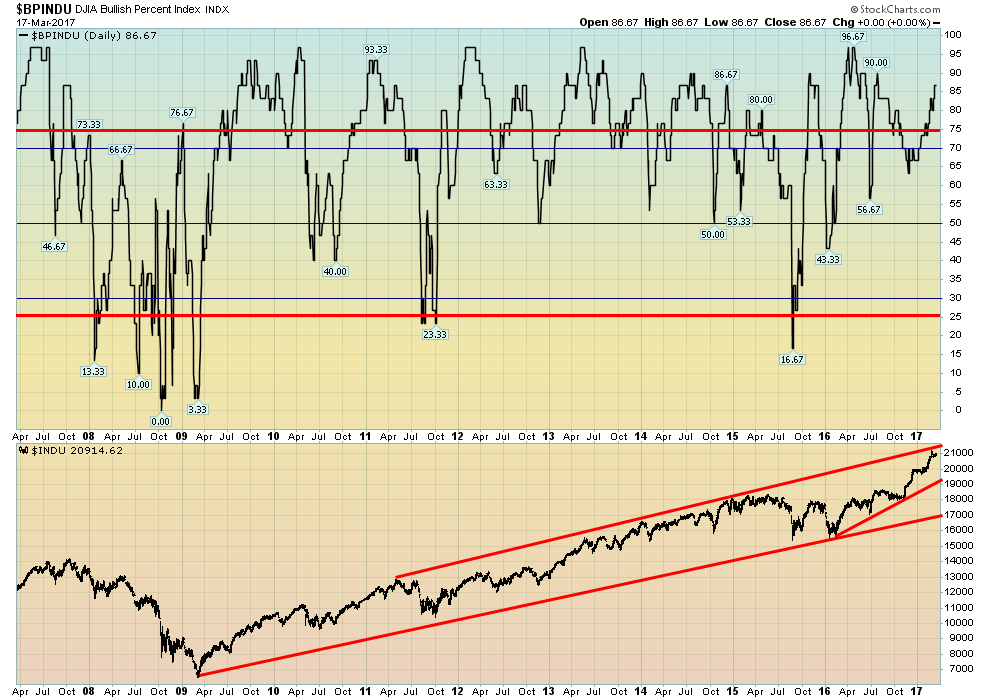
It is possible now that the Dow Jones Industrials (DJI) has put in at least a temporary top. The potential ascending wedge triangle forming suggests a possible correction could occur at any moment. The DJI made a high, pulled back, and then attempted to return to the high. That the index failed on Friday to make any further advance now leaves the advance open to question. A breakdown under 20,900 would appear to break the ascending wedge triangle and could target back down to support that ranges between 19,400 and 19,700. A breakdown below the August 2016 high of 18,668 would suggest that the entire up move might be over. We do not believe so and suggest five minor waves to the upside may have formed intermediate wave (3). Major support is seen at 19,250 and below there the August 2016 high. A breakdown under wave (2) at 17,883 would suggest that a major breakdown could be underway.
If our scenario of a pullback to the 19,400/19,700 zone is correct, then the markets led by the DJI could move once again to new highs sometime into the summer. If this up wave is not yet complete then there remain targets up to 21,400/21,500. Note the uptick in volume on Friday, a down day. That is another suggestion that the high of 21,169 seen on March 1, 2017 may have been the top. The market has been riding a wave of optimism for the Trump agenda. But with the presentation of a budget from Trump this past week and strong suggestions that it is “dead on arrival” at congress, it may begin to sow seeds of doubt as to whether the agenda can be accomplished. Even the repeal of Obamacare with nothing to replace it is coming under opposition. It has been suggested by the CBO that while the plan will save upwards of $337 billion over 10 years upwards of 24 million could lose coverage by 2026.
(Source)
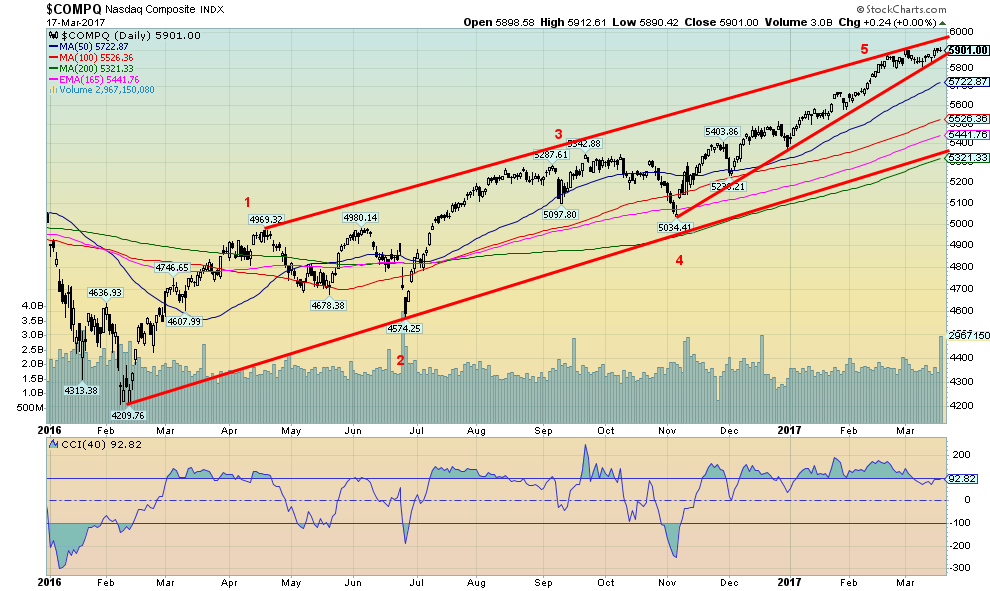
While the DJI, the Dow Jones Transportations (DJT), and the S&P 500 failed to make new all-time highs this past week the tech-driven NASDAQ did. Is this a divergence? It’s hard to say until points below break down. It is interesting to note the DJT has already fallen 5% from its all-time highs even as the DJI is down only 1%. Divergences always occur at important tops (and bottoms), so this divergence bears watching. Note what appears to be an ascending wedge triangle forming on the NASDAQ too. It wouldn’t take much to push the NASDAQ down. A break of 5,875 could do it.
(Source)
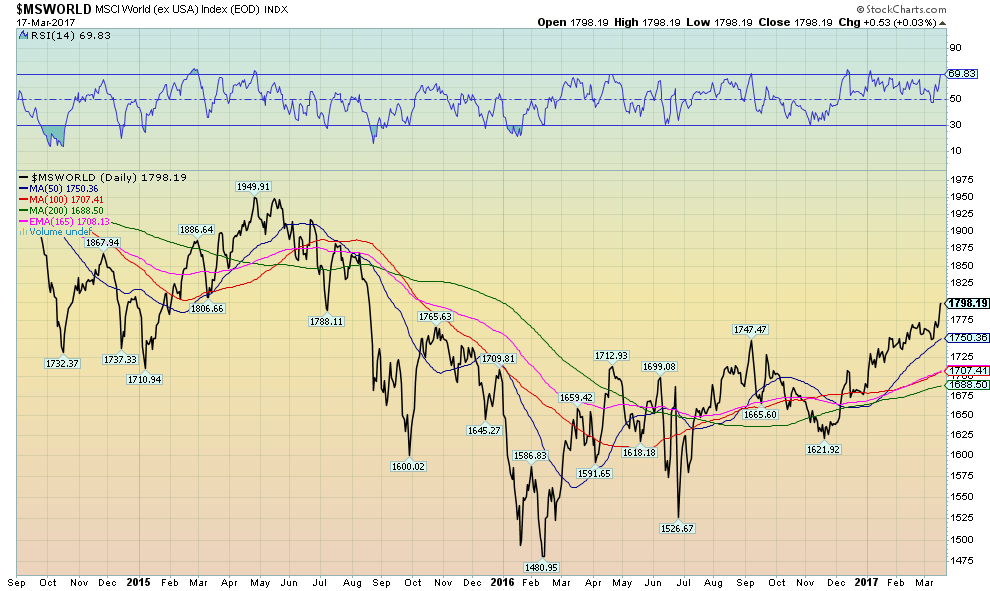
The world economy must be doing okay as the MSCI World Index just made new 52-week highs this past week. It is well off the highs of April 2015 and the all-time high for the index was seen way back in October 2007 at 2,390. The index is still down 26% from that high.
(Source)
The DJI Bullish Percent Index is in danger territory currently at 87. Anything over 75 is considered warning territory of a potential high. Conversely, anything under 25 suggests a potential low is forming. The Bullish Percent Index was more optimistic back in April 2016 then it is today. However, the markets have moved to new highs but the Bullish Percent Index has not. A divergence? Worth keeping an eye on.
(Source)
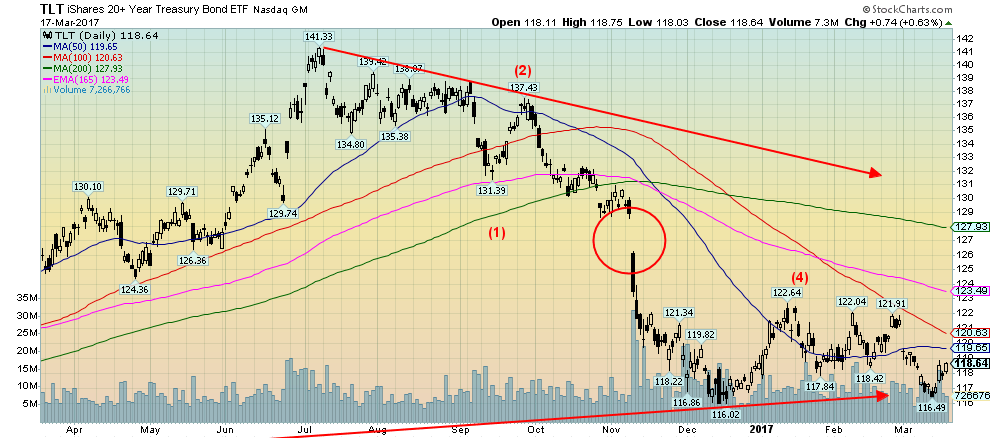
Have interest rates topped (bond prices bottomed as prices move inversely to yields)? Bonds reacted positively to the Fed rate hike this past week. It is possible that the iShares 20-year Treasury Bond ETF (TLT) has put in five waves down with the fifth wave a truncated one. Keep an eye on 121.91 the last high. If that were taken out to the upside then it would confirm the low at 116.49. Potential targets on the up wave would be to the 200-day MA currently near 128. This should be a corrective wave that unfolds in an ABC manner.
(Source)
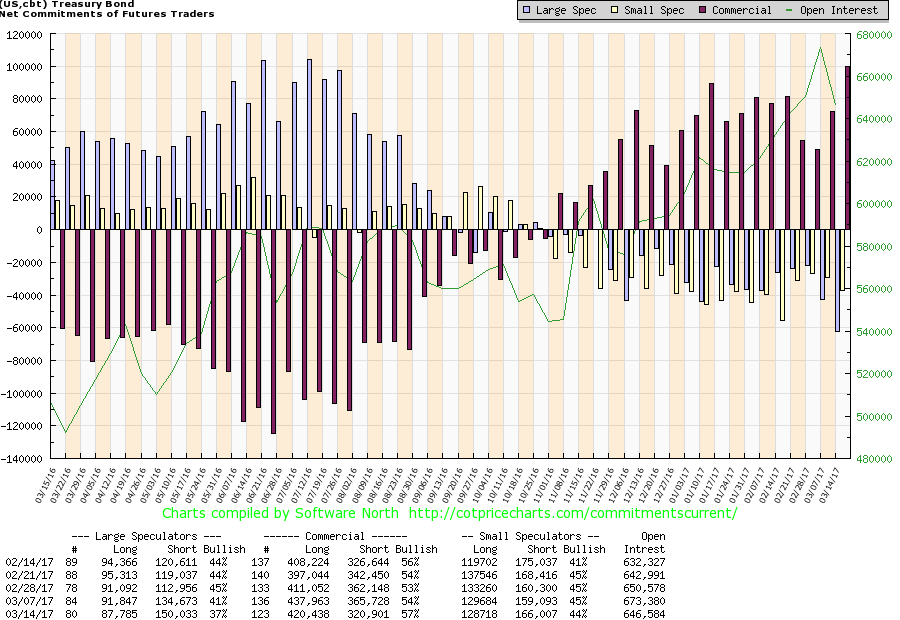
It is probably no surprise that the commercial COT has jumped higher as bond prices moved lower. The commercial COT improved to 57% this past week even though long open interest fell about 17,000 contracts but short open interest dropped about 45,000 contracts. At the other end, the large speculators (hedge funds, managed futures, etc.) who are often wrong at tops and bottoms saw their COT fall to 37% the lowest level in weeks. Long open interest dropped about 4,000 contracts while short open interest jumped about 16,000 contracts. Two bond players, both moving in opposite directions. We follow the commercials.
(Source)
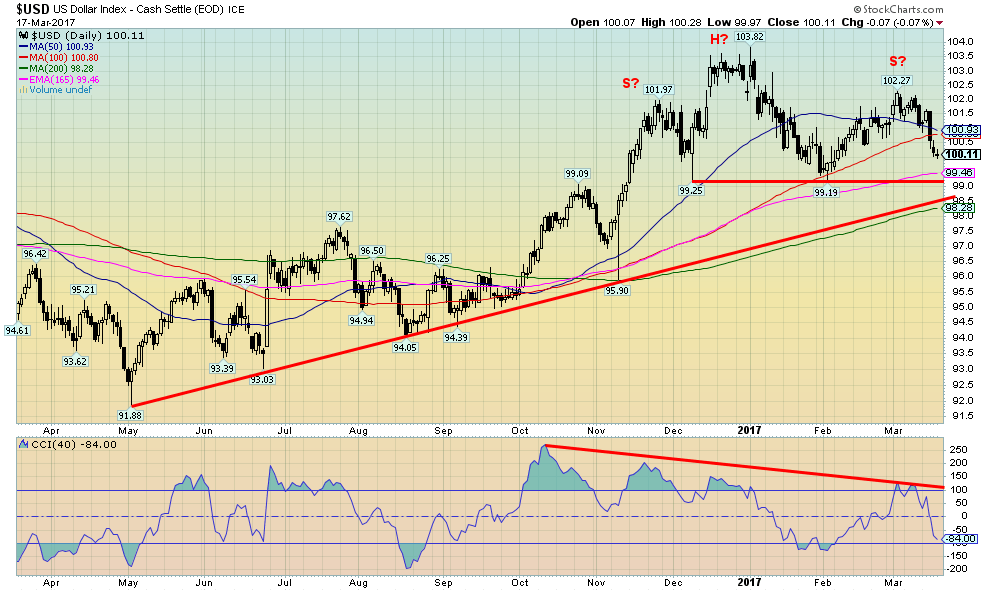
Has the US$ Index topped? Once again, a breakdown under 99 looms large. A breakdown under 98.50 would most likely mean a sharp decline in the US$ Index. If we really do have a head and shoulders top, the projected target would be between 94 and 95. Despite the Fed hike this past week the US$ did the opposite of what was expected—it fell rather than rose. Still, one cannot eliminate the bullish case just yet. Key is the 99 area, and if that holds then another rebound could get underway. The US$ Index is not oversold yet and this is where, if a rally is developing, it would be from the 100 level. A move lower in the early part of the week would, however, weaken the bullish case.
(Source)
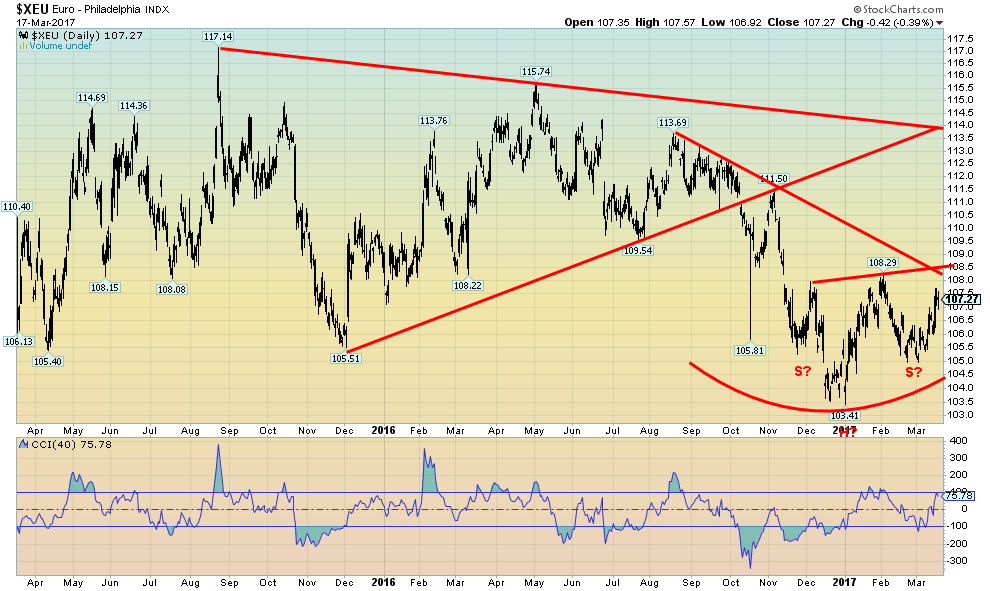
It is hard to call the pattern on the Euro a head and shoulders bottom. The neckline is upward sloping when the classic definition is a downward sloping neckline. And the right shoulder is below the left shoulder. But many would acknowledge it as an H&S bottom pattern. Let’s assume it is. So, no surprise it is the opposite of what we are seeing on the US$ Index since the Euro makes up 57.6% of the US$ Index. The Euro breaks out over 108.50 and could project up to about 113.50. No doubt the Dutch election helped the Euro this week. A coalition of centrist left and right parties will assume power keeping the far-right anti-EU party to the sidelines. Polls are showing that the French far-right party under Marine Le Pen is also slipping. Anything that takes the pressure off a potential breakup of the EU is positive for the Euro. Obviously, if the Euro fails to break out and falls back under 105 then odds would favor new lows.
(Source)
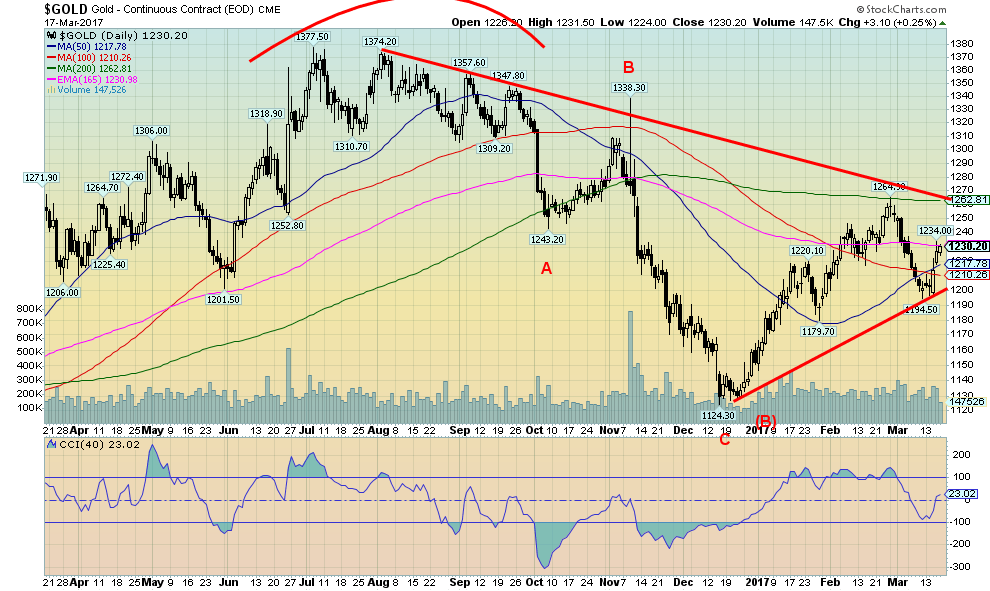
As we had suspected gold followed the “sell the rumour—the Fed is going to hike interest rates” and “buy the news—they hiked, they hiked” pattern. The question now is: is the recent decline back towards $1,190 over, or is there another decline to come? Gold did gain 2.4% this past and marginally outperformed silver. Usually one wants to see silver leading. As well, the gold stocks were better on the week but not hugely better. Regaining above $1,250 and especially above $1,260 would go a long way to suggest that the bottom is in and another leg up is underway. A decline back under $1,215 would be a warning sign and under $1,210 and especially under $1,200, new lows would most likely lie ahead. Right now the wave count is confusing so we don’t have a sense of the pattern just yet. Often, gold tops around the time of PDAC and goes through an irregular decline into May/June. This time gold topped in front of PDAC on February 27, 2017. The Fed hike sparked the rally as the Fed’s comments were more cautious than the market had expected. Volume wasn’t strong this past week either. But, as noted, a break over $1,250 would most likely signal that the low is in.
(Source)
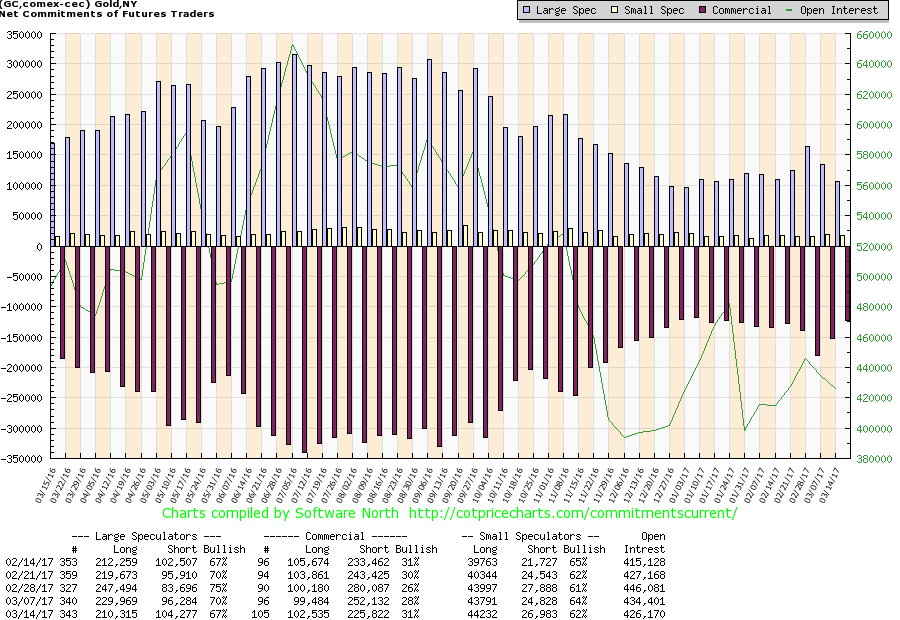
There was good news on the commercial COT front as it rose to 31% this past week from 28% the previous week. The large speculators COT (hedge funds, managed futures, etc.) fell to 67% from 70%. The commercial COT saw a small roughly 3,000 gain in long open interest, but more importantly, short open interest fell about 26,000 contracts. This is a positive report as it suggests that the commercials were covering their short positions on the recent gold pullback. One would now expect gold prices to start rising again.
(Source)
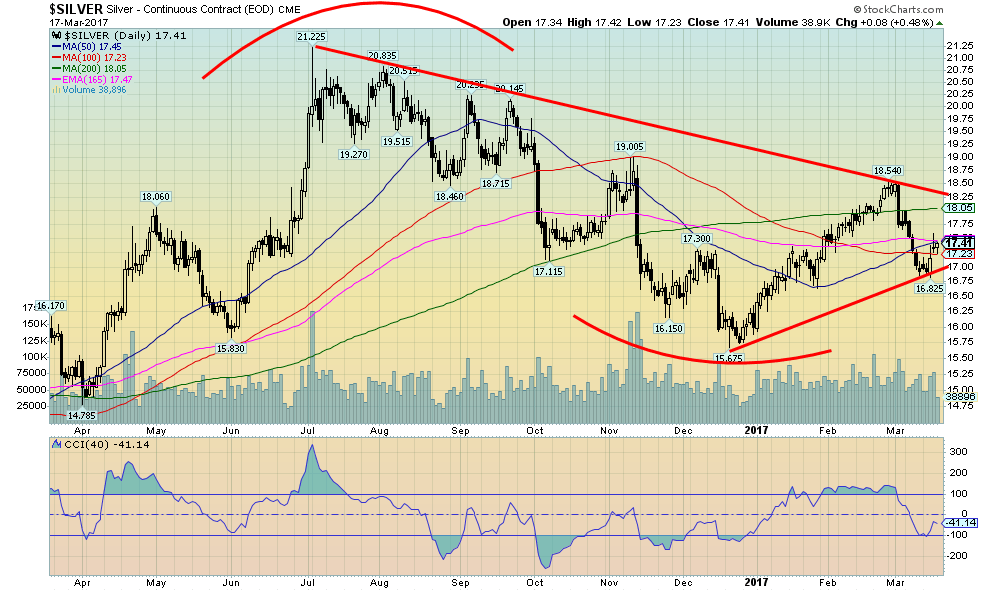
Silver rallied this past week as well, but the rebound was marginally behind the jump in gold prices. Silver needs to rebound above $18.10 to suggest that a low is in and that the recent $18.54 high might fall. A return back under $17 would be negative and suggest that silver was set up to fall below the recent low of $16.82. As with gold, the volume on the rebound wasn’t overly strong.
(Source)
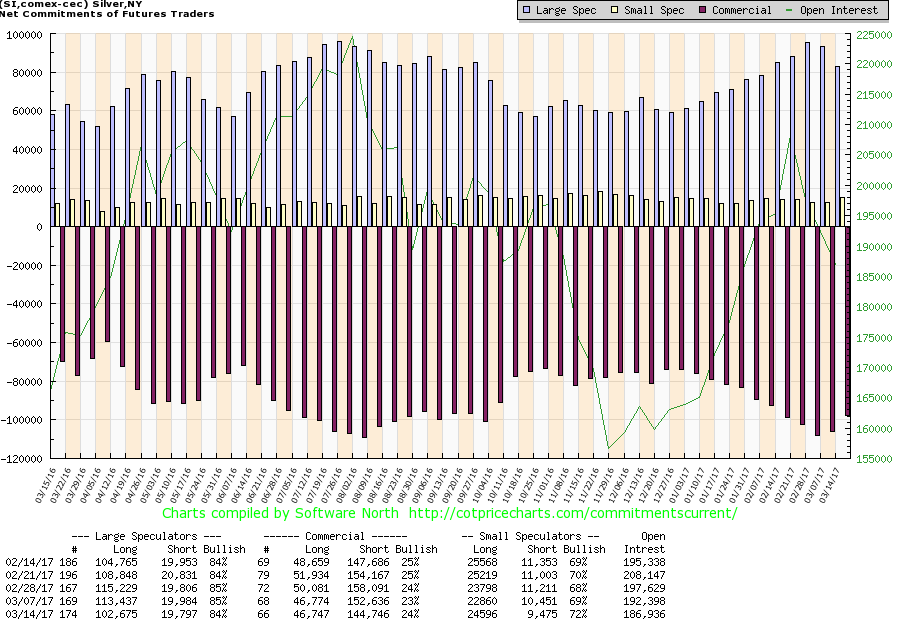
Unlike the gold commercial COT, silver’s commercial COT is not showing a lot of strength. It improved marginally this week to 24% from 23%. The large speculators COT is quite high at 84%. Our preference is to see the commercial COT improving while the large speculators COT falls. It is not happening with silver even as it has appeared to happen with gold. So this is a possible warning sign that the recent correction is not yet over.
(Source)
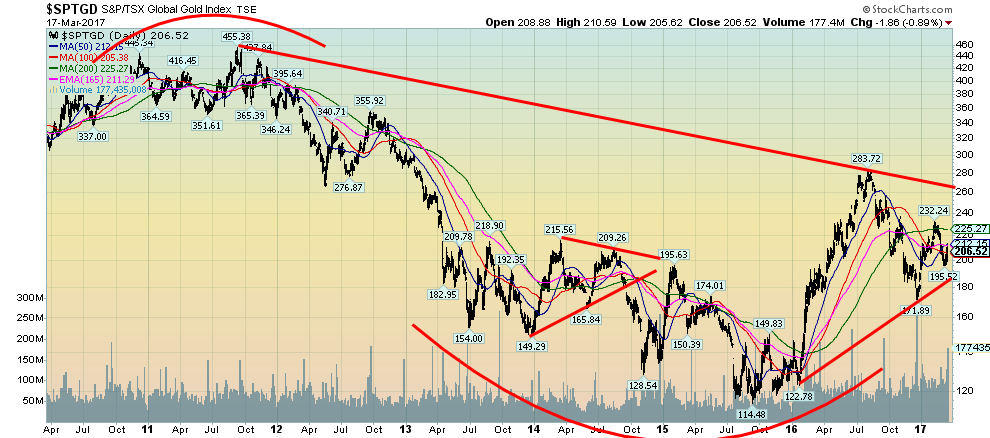
Gold stocks, as represented here by the TSX Gold Index (TGD), have been through a healthy correction. The recent decline to a low of 191.89 was just over 50% of the entire move from the September 2015 low of 114.48 to the July 2016 high of 283.72. Recent up action has taken place on good volume suggesting that a low may be in. Overall, the gold stocks only gained 2.4% this past week despite the big up day on Wednesday following the Fed hike. And lest we become complacent the TGD remains down 55% from its September 2011 high. The TGD reached to the 200 day MA (225.27) in February 2017 before failing. The rebound this past week has only taken it back to the 50 day MA (212.25) and it has found support so far on the 100 day MA (205.40). The TGD needs to break through 225 to suggest new highs lie ahead. It will be important that 195 holds on any pullback. The TGD breaks down under 175. Despite the up week, the Gold Miners Bullish Percent Index barely budged this past week and remains at 32. It most likely will take another good up week to pull the index higher. The action on the gold stocks appears bullish, but there is more work to do before we can declare that the recent correction is over.
GLOSSARY
Trends
Daily – Short-term trend (For swing traders)
Weekly – Intermediate-term trend (For long-term trend followers)
Monthly – Long-term secular trend (For long-term trend followers)
Up – The trend is up.
Down – The trend is down.
Neutral – Indicators are mostly neutral. A trend change might be in the offing.
Weak – The trend is still up or down but it is weakening. It is also a sign that the trend might change.
Topping – Indicators are suggesting that while the trend remains up there are considerable signs that suggest that the market is topping.
Bottoming – Indicators are suggesting that while the trend is down there are considerable signs that suggest that the market is bottoming.
—
DISCLAIMER: This article expresses my own ideas and opinions. Any information I have shared are from sources that I believe to be reliable and accurate. I did not receive any financial compensation in writing this post, nor do I own any shares in any company I’ve mentioned. I encourage any reader to do their own diligent research first before making any investment decisions.


Morocco’s Growth Holds at 4.6% as Agriculture Offsets Economic Pressures
Morocco’s economy grew 4.6% in Q1 2026, driven by a strong agricultural rebound offsetting declines in industry. Services expanded moderately...


Abivax Shares Surge as New Trial Data Eases Safety Concerns Over Ulcerative Colitis Drug
Abivax shares surged nearly 36% after positive updated trial results for its ulcerative colitis drug obefazimod reassured investors following earlier...


El Dorado Raises $9M to Expand Cross-Border Fintech Platform
El Dorado, a Latin American fintech improving cross-border financial services, raised a $9 million Series A led by Paradigm with...


Bitcoin Stalls Near $60K as Strategy Moves, ETFs Outflow, and EU MiCA Rules Take Effect
Bitcoin hovers near $60,000 with ETF outflows, while Strategy boosts reserves, sells BTC, and raises dividends to reassure investors. Ethereum...


Cannabis Dominates Global Drug Use: Trends, Risks, and Shifting Markets
Cannabis remains the world’s most widely used illicit drug, with 256 million users in 2024, surpassing all others combined. Growth...
 |
|
 |  |
 |
|
-

 Fintech6 days ago
Talentir Secures €4M to Transform Global Payouts
-

 Cannabis2 weeks ago
WNBA Removes Cannabis From Banned Substances List in New CBA
-

 Markets1 day ago
Cotton Market Weakness Persists Despite Brief Rebound
-

 Cannabis1 week ago
Trulieve NYSE Listing Signals New Era for Global Cannabis Industry
You must be logged in to post a comment Login