Markets
Twenty Largest Market Caps for 2024 & 1975
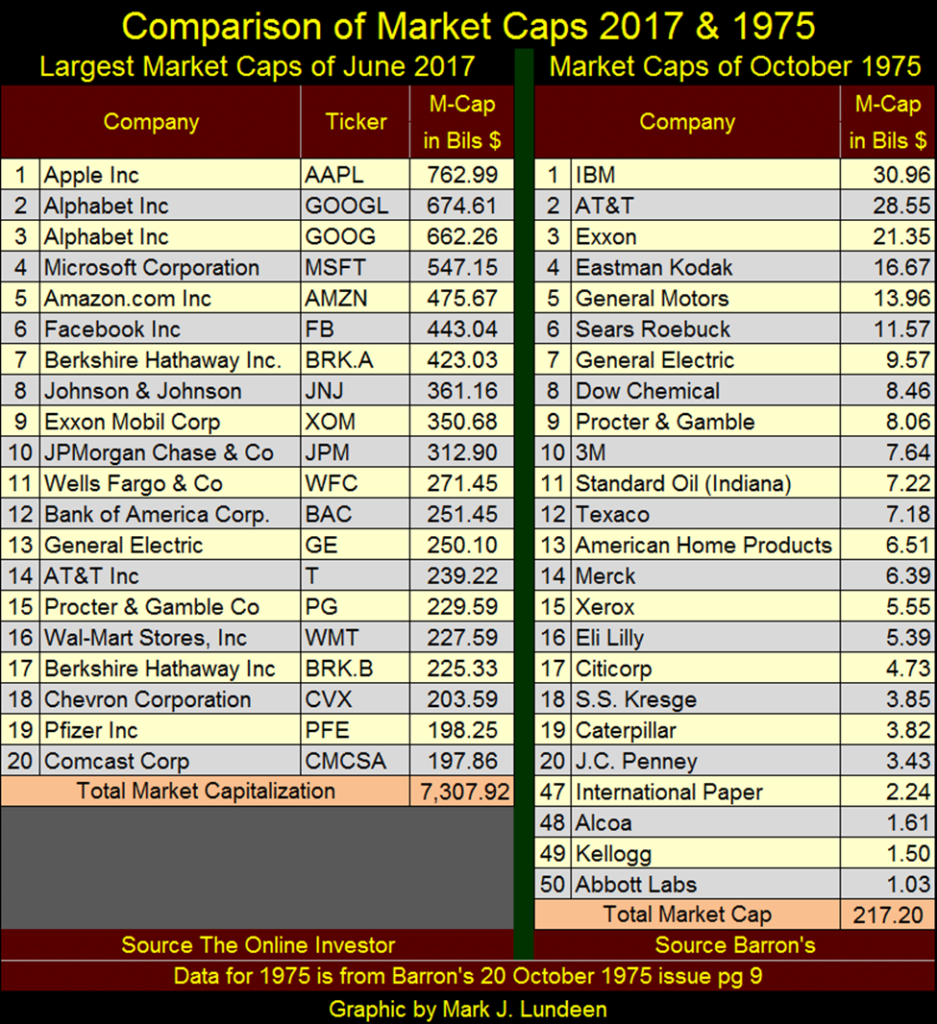
In October 1975, only four years after the US Treasury broke the dollar’s link to the Bretton Woods $35 gold peg, IBM (#1) had an enormous market cap of $30.96 billion. Way back in October 1975, when the US national debt was only $551.6 billion, a $30.96 billion market cap was HUGE! The market caps from seven years ago were remarkably smaller than those seen today; no trillion-dollar market caps in 2017.

Since December 13th, to the close of this week, the Dow Jones has seen its twelfth BEV Zero (0.00% / new all-time high) of its current advance seen below (Red Circle), with three of those BEV Zeros made just this week. This is a hot market.

But then, a BEV chart can only show a new all-time high as a 0.00%, and never more. Looking at a chart plotting the Dow Jones in dollars, as with the Dow Jones in daily bars below, it becomes apparent how since December 13th, the Dow Jones with those twelve new all-time highs has advanced by only 1,531.49 dollars, or 4.19%. Looking at the Dow Jones in its daily bar chart below, since mid-December, the current advance for the Dow Jones no longer seems so hot.
Look at this week’s daily action within the box. The Dow Jones made three new all-time highs in it, and to my way of thinking, that is pathetic. When are the big daily moves into market history, big daily moves seen below from October to December going to begin again?

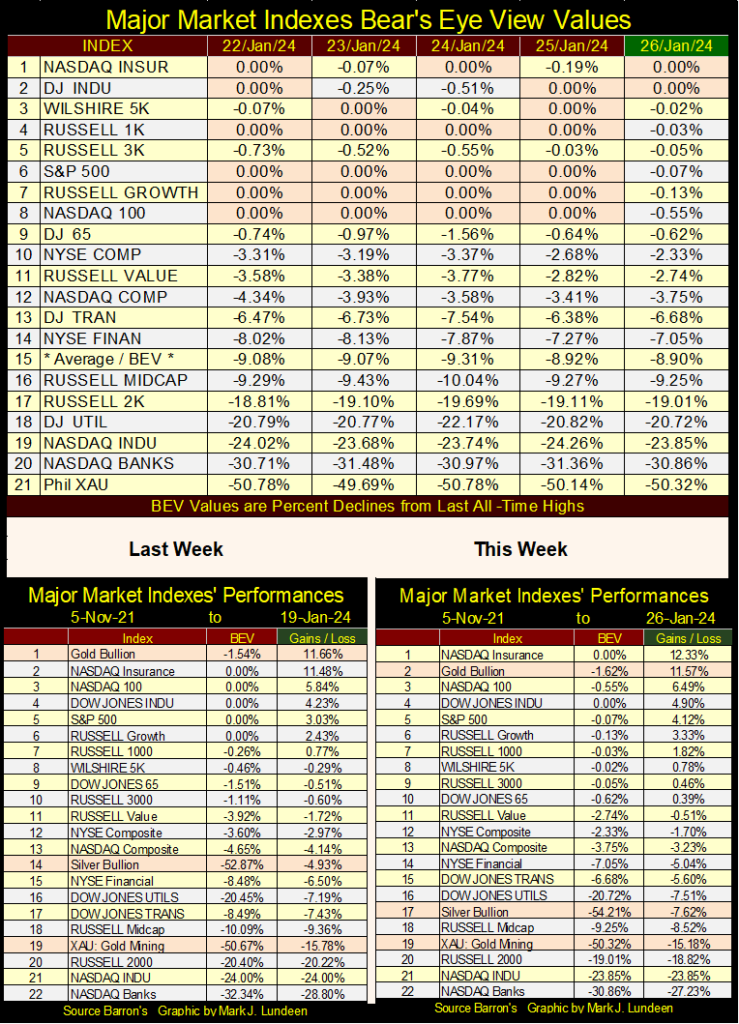
Looking at the major market indexes Bear’s Eye Views I follow in the table below, once again the market is seeing a multitude of new all-time highs (BEV Zeros = 0.00%).
Though I haven’t checked it, I suspect the lazy advance seen above with the Dow Jones is also a problem with the indexes below. So, the stock market is enjoying a bull market advance of a sort. But like kissing one’s elderly aunt (or elderly uncle as the case may be), so far this advance is doing nothing much for investors’ portfolios in the stock market.
This could all change in the weeks and months to come. Maybe we are at the cusp of a market advance of a life’s time. Then again, maybe we are only at the top of a major market advance that began in May 2020 with FOMC primate idiot Powell’s multi-trillion dollar Not QE#4, and what we’re seeing now is only the bulls gasping for oxygen at the market’s current high altitude.
I suspect 2024 will be full of surprises for everyone, which is no reason for me to move out of the market’s peanut gallery.

In the performance tables above, comparing this week to the former high-water level of Powell’s Not QE#4 market advance seen on 05 November 2021, precious metal assets are descending in this table’s ranking.
But the market indexes themselves are making gains above their highs of November 2021. So, maybe after over two years, we’re looking at a new high-water level in the market being made. It wasn’t all that long ago I though that was not possible. Well, I was wrong, proving I’m not always right.
But this market advance is odd, as bond yields are once again rising, as seen in the T-bond below maturing in February 2050.

It not just this bond seeing yields rising. In the table below, I used pink to mark peak bond yields of last autumn, and green to mark these yields bottoms of a few weeks ago. It’s too early to state anything with certainty, but looking at the data we do have in the last week of January 2024, once again bond yields are sneaking up in the table below.
If this rising trend in yields and interest rates continues, it will be a big problem for the bulls in the market.

In the chart below showing three yield curves, the idiots at the FOMC have nailed their Fed Funds rate at 5.33% since the end of July of last summer. So, any decline in T-bond yields have only made “monetary policy” tighter. That makes life difficult for the banks, or anyone else who borrows short and lends long.
Keep in mind, March of last year there were banks in California that were closing their doors as T-bond yields were rising (T-bond valuations deflating). But, if the idiots don’t soon lower their Fed Funds rate to something below the T-bond yields seen below, somewhere below 4%, we may once again see some bank failures. But lowering their Fed Funds rate to below 4% may fire up inflation once again!
For central bankers, it’s become damned if they do, and damned if they don’t.

Back in the 1990s, when Alan Greenspan was FOMC primate idiot, central banking was such fun. Everything “the maestro” did turned into gold for governments and investors around the world. Thirty years ago, it’s accurate saying Alan Greenspan was the most famous person on planet Earth for the bubbles he inflated into the global financial system. In testimony before the US Senate, Senator John Mccain called Greenspan a precious jewel.
Greenspan also had a great sense of humor. When he told this one to Congress, it was a real hoot! I saw it on CNBC, Congress began laughing. They didn’t care what he said, as long as he continued doing what he was doing; lowering interest rates and bond yields, and kept “injecting liquidity” into the financial system.

What a guy, what a central banker, what a genius!
Back in the 1990s, no one cared if Greenspan mumbled, yes mumbled total nonsense about this, that and everything else before Congress and the financial media. The man would go on for hours and not say anything, Alan Greenspan was the star of the dog-and-pony show Congress hosted twice a year. The 1990s was a time when everything that should be going up was going up, and everything that should be going down was going down, all thanks to the “genius” called Alan Greenspan.
But thirty years later, things have changed in the 2020s.
Years and decades ago, when investors wise in the ways of “monetary policy” saw the yield curve invert; when the FOMC’s Fed Funds Rate (Blue Plot below) increased above the yield for the Treasury’s long bond (Red Plot below), they knew trouble was brewing for the stock market and economy.
But that was then, and this is now, and now the yield curve has been inverted for over a year (see chart below). And for all that, the stock market’s major indexes are now rising to new all-time highs, and “market experts” everywhere are seeing no significant problems with the economy. This shouldn’t be, but there it is. What is the “Whiskey, Tango, Foxtrot” with that?

This is what happens when a bunch of idiots are ramrodding “policy” on the markets and economy. I don’t know when, but bad things are going to come from this monetary buffoonery sometime in our uncertain future.
Someone who is more certain than I of our uncertain future is Gregory Mannarino. Greg says there are banks already failing, its just the FDIC and FOMC aren’t making a big deal about that for the financial media. If a bank fails in the middle of a forest, does this failure make a sound if no one important is there to hear it? Maybe not. This 20-minute video below is worth your time.
Let’s look at large market-cap stocks trading in the stock market, comparing today’s large market-caps with those of 1975. Market-caps for January 2024 were downloaded from The Online Investor; https://www.theonlineinvestor.com/large_caps/
Market-caps from 1975 come from an article published in Barron’s 20 October 1975 issue (pg. 9), on institutional holdings of the fifty largest market-cap stocks trading in the stock market.
This article from forty-nine years ago didn’t actually publish the market-caps for these fifty companies. Rather, Barron’s published the percentage of the public float of the fifty largest companies trading on the stock market, that were owned by institutional money managers, and the dollar value these holdings were worth. This is sufficient information to calculate the total market cap for these companies, listed on the right side of the table below.
It’s interesting comparing the actual companies from 1975 to 2024. In 1975, only one company is on the list that would be considered high-tech by today’s standards; #1 IBM, or “Big Blue” as it was called in 1975.
What about AT&T (#2), the one and only American phone company in 1975? The one and only phone company of 1975 was certainly high-tech. But AT&T had a monopoly on the phone system, so was classified as a utility company, and regulated as such.
In 2024, IBM didn’t make the list, nor did AT&T which was broken up in the 1980s as the telephone system was deregulated, enabling Apple’s iPhones to dominate the telephone market a half century later. Who owns a line-phone anymore? In 1975, who didn’t?
One advantage having a line-phone from AT&T was, it took a court order from a judge before a law enforcement agency, and only a law enforcement agency could listen into what you were saying. Today with cell phones, Apple and other high-tech companies not only listen in whenever they want, but sell your personal data to anyone who is willing to pay for it, including law enforcement agencies, and possibility even the Chinese Communist Party? Sure, why not?
The January 6th protestors who are now sitting in jail without trial somewhere in Washington DC, those who entered the capital at the instigation of agent-provocateurs, such as Ray Epps of the FBI, were apprehended because they carried their cell phones with them into the capital. The Capital Police and FBI used their cell phone’s GPS feature to bag them, and I doubt the police first went to a judge to sign a search warrant to obtain this information from a cell phone company.
Congress and the courts aren’t in any hurry to correct this violation of America’s Constitution’s 4th Amendment. Yep, everyone loves high-tech these days.
Also in 1975, there was only one financial company that made the top 20 list; #17 Citicorp.
Looking at the top 20 list for 1975, the economy, as traded daily in the stock market was much more diverse than it is today. Number 3 on the list; Eastman Kodak was a manufacturer of photographic film. Today, one has to look hard to even find 35MM film in a store, as digital photography has come to dominate the market. In the top twenty of a half century ago, we see retailers, oil companies, consumer goods, drug companies, a manufacturer of bathroom fixtures, automotive and heavy-equipment manufacturers, in the top 20.
As we are looking at market caps, let’s look at them. In October 1975, only four years after the US Treasury broke the dollar’s link to the Bretton Woods $35 gold peg, IBM (#1) had an enormous market cap of $30.96 billion dollars. Way back in October 1975, when the US national debt was only $551.6 billion dollars, a $30.96 billion dollar market cap was HUGE!
On the right side of the table, I also included the last four of the fifty companies listed in Barron’s article from its 20 October 1975 issue. Number fifty; Abbot Labs had a market cap of $1.03 billion. In October 1975, about 1,800 issues traded daily at the NYSE. If #50’s market cap on this list barely broke above $1 billion dollars, there must have been many companies trading at the NYSE, significant companies whose market caps were below $100 million.

Reviewing the top 20 market-caps for 2024, the market-caps are much larger, but concentrated in high-tech and finance. Retail and consumer goods still have a presence in today’s top 20. But the list has shifted towards what I believe to be a propensity of Soviet-light, high-tech snoops whose real business is to know all about you. Companies willing to use their customer base’s personal data to maximize their companies’ profit potential.
I take no joy in saying this. But I’m not stupid, so I can see it for what it is. If you use a cell phone or computer, these companies make money selling your personal information to anyone willing to buy it. All without your permission, knowledge or returning a dime to you in the selling of your life on the internet.
Wait a minute! That isn’t correct; as every user accepted these companies’ take it or leave it “TERMS OF SERVICE” before they logged on to their “services.” People should begin squawking about this digital high-tech abuse to their Congressmen and Senators, because this should not be.
There is a notable exception to that; Elon Musk’s Tesla (#8), which purchased Twitter, now X, to oppose the WEF’s New World Order.
I realize people read material, such as mine for insight into matters of finance. But in 2024, keeping finance separate from power politics is not only impossible, but imprudent if someone believes they can separate the two. There are people in high places, who have nothing but contempt for the world’s “little people.” The illuminated elite, who gather annually at Davos to make plans for our future, plans that you and I aren’t going to like if they are successful. It’s important they know they no longer work in the dark, by shining a light on them.
Okay, I got that out of my system, so now let’s look at the market-caps for 2024. Apple, a company that didn’t trade in the stock market in 1975, tops the list at $3,007.96 billion dollars. That is about 100 times larger than IBM’s market-cap of $30.96 billion in 1975.
However, back in October 1975, the US national debt was only $551.6 billion dollars. In January 2024 the national debt is $34,069.9 billion dollars, an increase by a factor of 61.76. As I see it, most of the gains in market-caps, and national debt from 1975 to 2024 couldn’t have happened, if the “monetary authorities” weren’t inflating the money supply.
In 1920, the US national debt was only $27.39 billion dollars. CinC (paper dollars in circulation) in the chart below was only $5 billion in 1920. 104 Years later, CinC has increased to $2,332 billion in January 2024.
The chart below points out the fact the Federal Reserve was * NEVER * an “inflation fighter.” Rather, the Federal Reserve was always the GREAT ENGINE OF INFLATION, inflating bubble valuations in the stock market, real estate, costs in education, and everything else, unless it is the valuations for gold, silver, and for share prices in precious metal mining companies.

For your information, below is the table for market caps I first used on this topic way back in June 2017. The companies seen in it mirror most, but not all of the same companies seen above in 2024. The market caps from seven years ago were remarkably smaller than those seen today; no trillion-dollar market caps in 2017.
Why might that be? I believe FOMC’s primate idiot, Jerome Powell’s Not QE#4 of 2020, was the source of the $10,000, billion-dollar valuation inflation seen above.

Golly gee, with all that “liquidity” from the FOMC flowing into the stock market, let’s see what it’s doing for the price of gold in its BEV chart below. As expected, not as much as you and I would like, which is not much at all.
Realize the Dow Jones has daily been closing in scoring position (BEV Values of -0.01% to -4.99%) since November 17th, for the past forty-six continuous daily closings. During this time, the Dow Jones has seen twelve new all-time highs, and that is how market advances work in a BEV chart.
Looking at gold’s BEV chart below, it’s seen daily closings in scoring position since November 14th, for the past fifty continuous daily closings. During this time, gold has seen only two new BEV Zeros, new all-time highs, which is very, very odd in a BEV chart.
That is quite a difference in performance, one that reasonable people must be wondering about. If you ask me, it’s that the stock market has friends in high places, while gold and silver must struggle daily with a bunch of goons, hired guns from the Deep State that are allowed to naked short the hell out of the markets the old monetary metals now trade in. As you can see, it does make a difference.

It’s remarkable gold has been closing daily in scoring position since last mid-November. That by itself may be an indication of remarkable market strength just below the surface in gold market, that one day soon may break to the surface.
But I’m not holding my breadth waiting for this to happen, though I’m sure someday in the next year or two it will happen. Think of all those many trillions-of-dollars now circulating in the stock and bond markets, trying to squeeze into the gold and silver markets. What price would gold and silver be then, with gold and silver mining companies seeing rivers of earnings and dividend payouts gush forth from their operations!
I’ve seen where people smarter than me have considered this idea of a massive flow of funds from the financial markets into gold, silver, and the commodity markets in general. Being precious metal bulls, they’ve concluded they’d like to see this happen, but doubt it ever would as it would be a catastrophic market event. And they are 100% right.
But these are the ruminations of logical people, living in rational times. When Mr Bear returns, he is going to try to turn everything upside down. Being an agent-of-chaos, Mr Bear is going to do his best to make our lives chaotic, and markets irrational. To the degree the United States and NATO are successful in destabilizing the global-geopolitical situation, with their irrational, and ever-expanding conflict with Russia over Ukraine, Mr Bear may be more successful than even I would like him to be.
If the worse thing Mr Bear could do is create a catastrophic flow of funds from the financial markets into gold, silver and the commodity markets, at the bottom of the pending bear market, that may be exactly what we’ll see happen.
If so, that would be the future then. But currently, you and I are living in the now. And right now, in the gold and Dow Jones step sum tables below, we can see the sad performance of gold compared to the Dow Jones in the BEV columns of these two tables. Daily closing in scoring position as far as the eye can see in both tables, but with the Dow Jones making BEV Zeros (Blue Cells) by the score, as gold does little to lift itself up into market history.
Gold, gold – you’re making me old.

If you are someone who believes our current world is still normal, managed by rational people attempting to solve the big and little problems civilizations throughout history had to deal with, well, it must be nice living on Fantasy Island. I’d like to join you, but I can’t.
I can’t as I’m a student of history. And students of history all know that as civilizations throughout history approach their terminal-end points, things begin to get weird. How weird? The People’s Voice link below will take you there.
__
(Featured image by Adam Nowakowski via Unsplash)
DISCLAIMER: This article was written by a third party contributor and does not reflect the opinion of Born2Invest, its management, staff or its associates. Please review our disclaimer for more information.
This article may include forward-looking statements. These forward-looking statements generally are identified by the words “believe,” “project,” “estimate,” “become,” “plan,” “will,” and similar expressions. These forward-looking statements involve known and unknown risks as well as uncertainties, including those discussed in the following cautionary statements and elsewhere in this article and on this site. Although the Company may believe that its expectations are based on reasonable assumptions, the actual results that the Company may achieve may differ materially from any forward-looking statements, which reflect the opinions of the management of the Company only as of the date hereof. Additionally, please make sure to read these important disclosures.

-

 Markets1 week ago
Cocoa Prices Drop Amid Speculative Selling and West African Supply Concerns
-

 Cannabis5 days ago
Is Aurora Cannabis Stock a Risk Worth Taking?
-

 Impact Investing2 weeks ago
EU Eases CO2 Tax Burden on SMEs with Revised CBAM Rules
-

 Fintech12 hours ago
Robinhood Expands to Europe with Tokenized Stocks and Perpetual Futures


