Featured
Why the U.S. Dollar as the World’s Reserve Currency Might Be Displaced
Markets put in a good week last week as they seem to believe the Fed will pivot and the banking crisis is over (hint: it isn’t). Setting aside the brief but vicious pandemic collapse and recession, the financial crisis recession and market collapse of 2007-2009 didn’t end until towards the end of the recession. Thus far, the current recession hasn’t even started, yet almost universally economists are calling for one.

De-dollarization! Is that the new buzz word? The U.S. dollar is the world’s reserve currency. It has been since the 1920s as capital flowed from war-torn Europe and elsewhere to the U.S. The U.S. dollar began to displace the U.K. pound sterling as the world’s currency. A large amount of gold also came to the U.S. It was agreed that the U.S. dollar would be the world’s reserve currency with the Bretton Woods Agreement of 1944. World trade would be conducted in U.S. dollars and the U.S. dollar was fully convertible into gold at the price of US$35/ounce. Commodities and trade would also be priced in U.S. dollars.
Bretton Woods did not last long. As we progressed into the 1950s and 1960s, European and Japanese exports were becoming more competitive with U.S. Huge amounts of funds were being sent to Europe and elsewhere to rebuild the war-torn countries. Finally, with the U.S. financing a raging war in South East Asia (Vietnam), there was now a large supply of U.S. dollars sloshing around the world. As a result, central banks were approaching the U.S. for conversion of their U.S. dollars for gold. Backing the U.S. dollar with gold was becoming more difficult.
U.S. gold reserves hit their peak in 1949 at about 20,000 metric tonnes. By 1971, that amount had fallen to just over 7,000 metric tonnes. Further requests for conversion were being made. The result was that on August 15, 1971, former president Richard Nixon took the world off the gold standard. U.S. dollars would no longer be convertible into gold. A default? A few years later, the era of the gold standard was officially over and the era of fiat currencies was underway. Currencies were no longer pegged to the U.S. dollar as they were under Bretton Woods. Bretton Woods was dead and currencies were free to float in value to the U.S. dollar as the world’s reserve currency. It has been that way ever since. The U.S. did rebuild it’s gold reserves to some 8,133.5 metric tonnes where it has roughly remained at that level ever since. It continues to be carried on its books at the rate of US$42.22/ounce a rather artificially low price.
The U.S. dollar has dominated trade and capital flows. But now the supremacy of the U.S. dollar is under attack. Many nations are looking for alternatives to the U.S. dollar to reduce their dependence on the U.S. and the U.S. dollar.
In the 1920s, the U.S. dollar began to displace the U.K. pound sterling as the world’s reserve currency. The replacement was fait accompli with the Bretton Woods agreement. The U.K. and Europe had been severely weakened by World War I. The eventual demise of the pound sterling was, at the time, just another reserve currency in a long line of global reserve currencies that had fallen over time. History has shown us that a reserve currency does not last forever. A couple of years ago, we did a presentation on the subject on the MoneyShow (www.moneyshow.com). Our presentation, titled “A Reserve Currency Does Not Last Forever,” can be found here: https://www.youtube.com/watch?v=P5RiDEhjebM&list=LL&index=5&t=11s.
History of World Reserve Currencies: 1450–Present
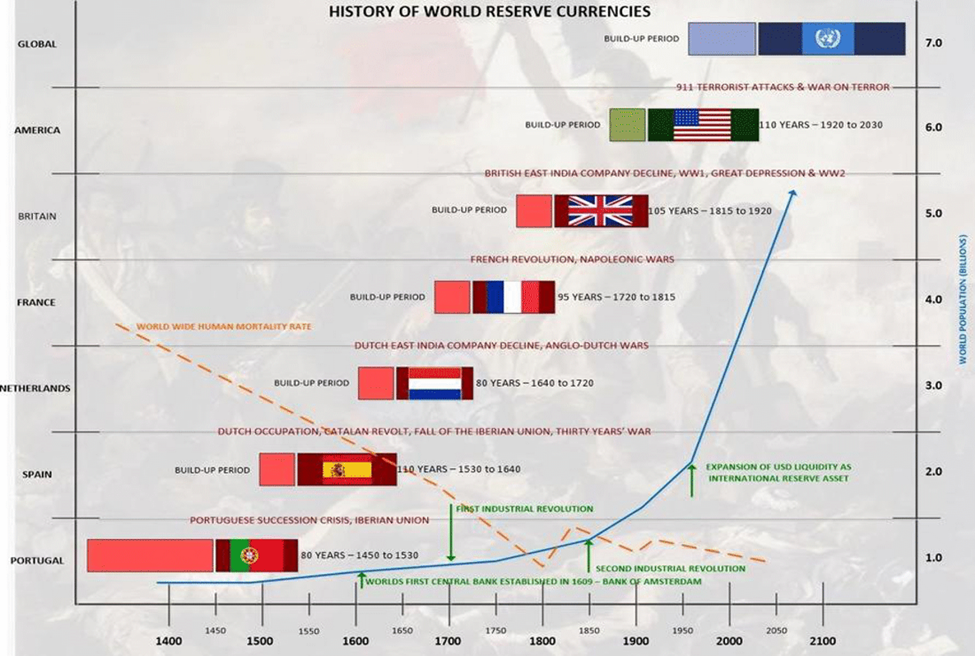
So, will the reign of the U.S. dollar come to an end just as the pound sterling came to end and before that many other currencies that had been considered reserve currencies? History suggests that it should eventually happen. Since medieval times the average life of a reserve currency is 94 years. The longest was the Spanish peso and the British pound. Both lasted 110 years. As we note, the U.S. dollar began its rise around 1920 after World War I. 110 years puts us at 2030, some seven years away. Could it happen? And what will replace it?
What caused previous reserve currencies to disappear? We could go back even further to ancient times and note as well that both Greece and Rome who at one time ruled the Western world had their currencies used as the primary currency of trade. The Greek drachma and the Roman denarius were at one time the most powerful currencies in the world. They too eventually saw their demise.
What causes a reserve currency to collapse? Increasing debt, easy credit, and wars and the need to finance them eventually led to their demise in all cases. Today, the U.S. sits as a behemoth across the world with its upwards of $1 trillion military budget and maintenance of between 750 and 1,000 military bases around the world. The U.S. is built on debt—currently some $31.6 trillion, the largest national debt in the world. The U.S. is also the world’s largest economy, but it is the challenge to U.S. global domination and U.S. dollar hegemony that is behind the challenge to its power.
It’s not the first time that a great power has been challenged. Before World War I, Germany had been challenging the U.K. as the world’s most dominant economic and military power. That led to World War I. The Great Depression and World War II added to the U.K.’s woes and the end to its global economic and military domination. The same fate befell the Portugese real, the Spanish peso, the Dutch guilder, and the French franc. Debt, wars, and a challenge from a rising power. The Portuguese War of Succession, the Spanish Catlin revolt, a Dutch challenge to Spain’s power, and the Thirty Years’ War helped end Spain’s domination. Remember the demise of the Spanish Armada 1588? The Dutch ended their reign as they were challenged by Britain and France for domination. The Dutch-Anglo wars of the 17th and 18th century finished the Netherlands as a global power, although, as with both Spain and Portugal they maintained most of their colonies. France was next and they were in turn challenged by Great Britain. The Seven Years’ War, the French revolution, and the Napoleonic Wars all eventually led to the demise of France as a global power and the rise of Great Britain.
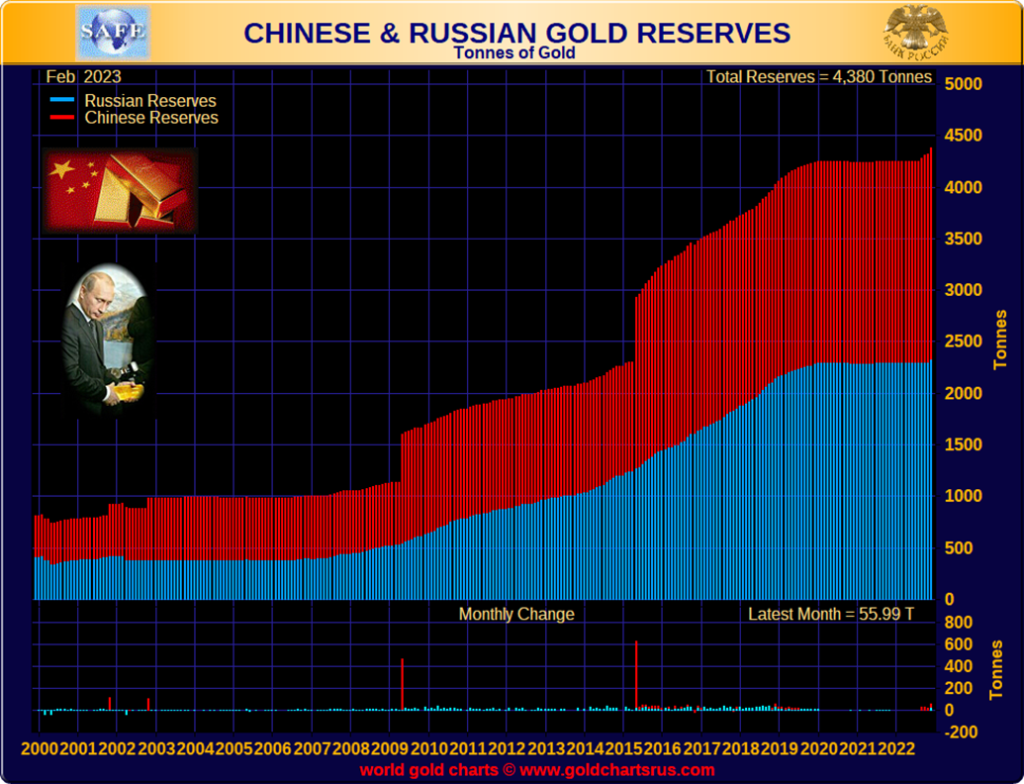
Now it is the U.S. that is being challenged. Led by China, many nations are concerned over the U.S.’s dominance and its ability to weaponize its military and economic power to suit their needs. The rise of sanctions as a weapon against nations such as Russia, Iran, and Venezuela have hastened both Russia and China to speed up their economic partnership. The U.S. effectively weaponized the U.S. dollar with its expulsion of a number of Russian banks from SWIFT the global payments system. There is a long list of other countries that also have trouble settling international payments because of the inability to deal with SWIFT including Iran and Afghanistan. Since the invasion of 2022, China and Russia have increased their ruble-yuan trade 80-fold. These two countries, along with other Asian and Middle Eastern central banks have all increased their gold holdings in order to back their currencies. Irrespective of banning from SWIFT Russia and others find alternative means to transact through countries that do not go along with U.S. sanctions and barring from organizations like SWIFT.
Russia and China are also moving to create their own International Monetary Fund (IMF), World Bank, as well as SWIFT payments system. Currently, all these global organizations are dominated by the U.S. The Chinese alternative is CIPS and numerous Asian and African countries are interested in joining. CIPS would be yuan-based as opposed to U.S. dollar-based. All these moves have been noticed by other countries and the feeling is if they can do that to Russia and others, they could do it to us. Hence, the desire to move away from the U.S. dollar and U.S.- dominated world organizations.
China/Russia Gold Reserves 2000–2023
The process of de-dollarization is going on elsewhere as well:
- Brazil and Argentina have discussed the creation of a common currency for the two largest economies in South America
- In a conference in Singapore in January, multiple former Southeast Asian officials spoke about de-dollarization efforts underway
- The UAE and India are in talks to use rupees to trade non-oil commodities in a shift away from the dollar, according to Reuters
- For the first time in 48 years, Saudi Arabia said that the oil-rich nation is open to trading in currencies besides the U.S. dollar. Note how China brokered a deal to reconcile the differences between Saudi Arabia and Iran. Saudi Arabia has expressed interest in dealing with China in yuan
- The BRICS (Brazil, Russia, India, China, and South Africa) and the Shanghai Cooperation Organization (SCO) (India, Pakistan, China, Russia, Kazakhstan, Kyrgyzstan, Tajikistan, Uzbekistan, plus Observer States – Afghanistan, Iran, Belarus, Mongolia, plus possible entries Armenia, Azerbaijanian, Cambodia, Nepal, Saudi Arabia, Turkey, and Sri Lanka) together are all looking at de-dollarization and creating a common currency (yuan?) backed by gold across the entire region; the BRICS countries and others are effectively coming to the rescue of Russia
- Rumors are that any new international currency would be backed at least partially by gold
- The next BRICS+ meeting is scheduled for August and we could find out more information then
The IMF publishes a chart on the currency composition of official foreign exchange reserves. It is not a publishable chart so we have re-created as best we can. The last update to this chart was in December 2022 and the numbers only go to Q3-2022. The U.S. still has some 60% of the world’s foreign exchange reserves.
World Official Foreign Exchange
Reserve Currency (U.S. Dollars – billions)
| Currency | Period – Q3 2022 |
| Total Foreign Exchange Reserves | $11,598.63 |
| Allocated reserves | $10,773.07 |
| U.S. dollars | $6,441.65 |
| Euros | $2,117.94 |
| Chinese yuan (renminbi) | $297.79 |
| Japanese yen | $566.43 |
| U.K. pound sterling | $497.33 |
| Australian dollars | $206.26 |
| Currency | Period – Q3 2022 |
| Canadian dollars | $264.15 |
| Swiss francs | $25.04 |
| Other currencies | $356.47 |
| Unallocated reserves | $825.56 |
It is noteworthy that China continues to unload its reserves of U.S. securities. China reduced its U.S. dollar holdings by a further $7.7 billion in January 2023 and is now down $174.4 billion in the past year. China cannot sell all at once without causing a potential crash in the U.S. Treasury market. But if one is moving towards war with the U.S., the last thing China wants is to be caught with any securities that the U.S. could in theory default on. However, defaulting China would be the equivalent of defaulting the entire world. Overall foreign holdings of U.S. securities have fallen $253.4 billion in the past year with Japan being the other large seller, probably to defend the Japanese yen.
It is also noteworthy that, of the 10 largest banks in the world, four are in the U.S., three are in China, and one each is in France, the U.K., and Spain. In terms of market cap, four are Chinese, four are U.S., and one each are in the U.K. and Canada (yes, the Royal Bank of Canada). The financial capitals of the world are New York, London, and Shanghai.
De-dollarization has been a popular topic. Many are calling for the collapse of the U.S. dollar and the rise of gold in response. The global dominance of the Fed, the growing problems in the U.S. banking sector, and inflation, which is being blamed on the U.S. coupled with the looming U.S. debt limit fight, have all conspired to make U.S. dollar assets toxic. Many countries whose debt is denominated in U.S. dollars are teetering on the edge of default because of the Fed hiking rates.
The U.S. dollar has been steadily losing purchasing power. We have shown this chart many times, but it is always worth noting. The chart on the next page shows how the U.S. dollar has lost purchasing power over the past 100+ years. It is noteworthy that a dollar doesn’t purchase much when compared to 1913. That is equivalent to a 97% loss of purchasing power. Or inflation on a large scale. Most of the loss has occurred since the world came off the gold standard in 1971. Some believe we should go back to a gold standard. But there are also many arguments against that.
The U.S. dollar as the world’s reserve currency has come under constant attack, particularly since the financial crisis of 2007–2009. Yet today the U.S. still dominates, with some 42% of the world’s equity markets and 24% of global GDP with only about 4% of the world’s population. The U.S. dollar, as measured here by the US$ Index, has been on a roller coaster ride over the past 50+ years. Tops in the US$ Index have usually corresponded with bottoms in gold and vice versa. Are we currently poised to break out in gold as the US$ Index falls once again?
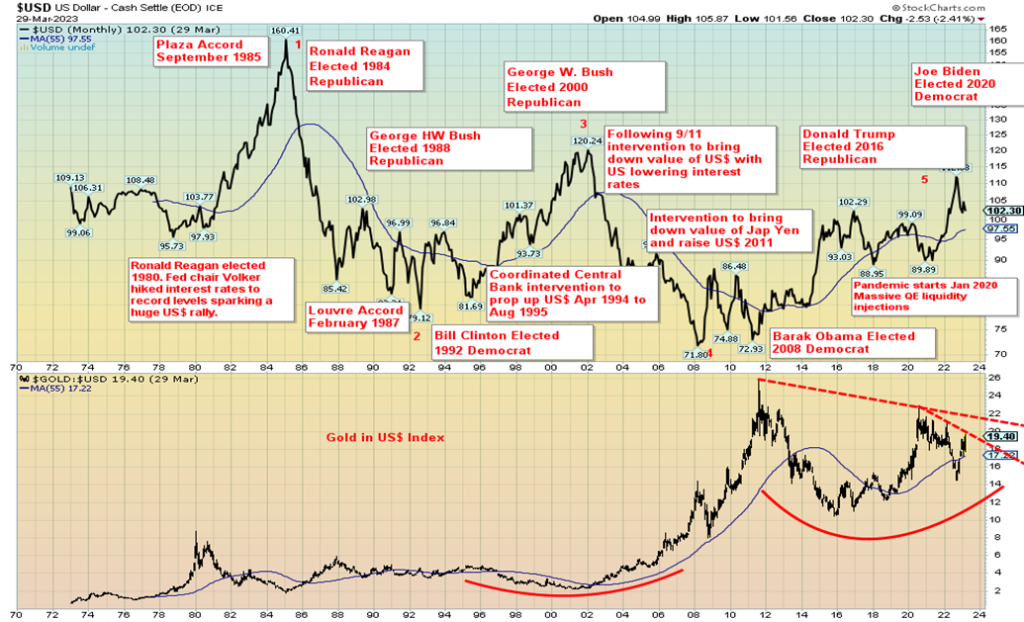
No, the U.S. dollar as a reserve currency is not about to end tomorrow. And no, it is not about to outright collapse. But it does appear poised for another shakedown and, in turn, gold could rise once again. The two are inextricably linked together. But the ongoing turmoil with the trend to de-dollarization is an economic war that history has shown eventually turns to real war. The end of an era does not come easily. It comes with huge uncertainty, volatility and disruption. If the world is de-dollarizing that means that holding U.S. dollar assets could be a problem. But where does one go? Gold is an option. All signs continue to show that is the current trend, one that is not about to end anytime soon.
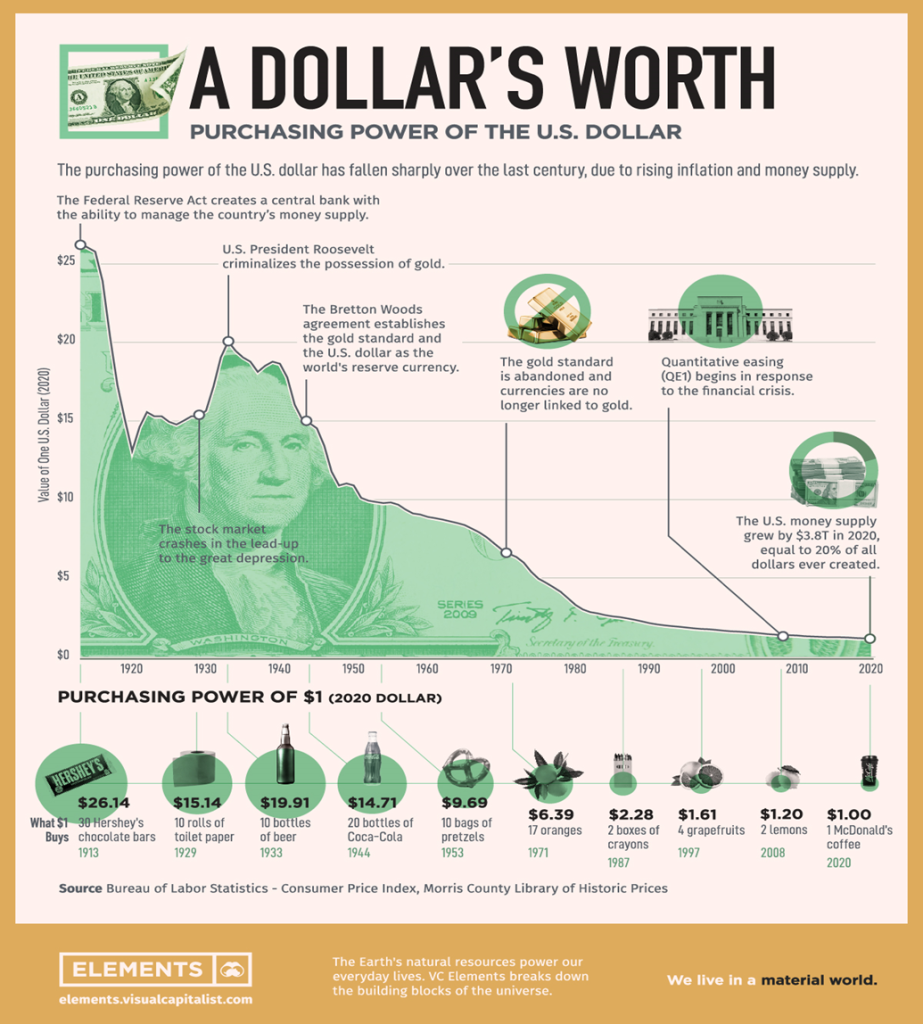
Chart of the Week
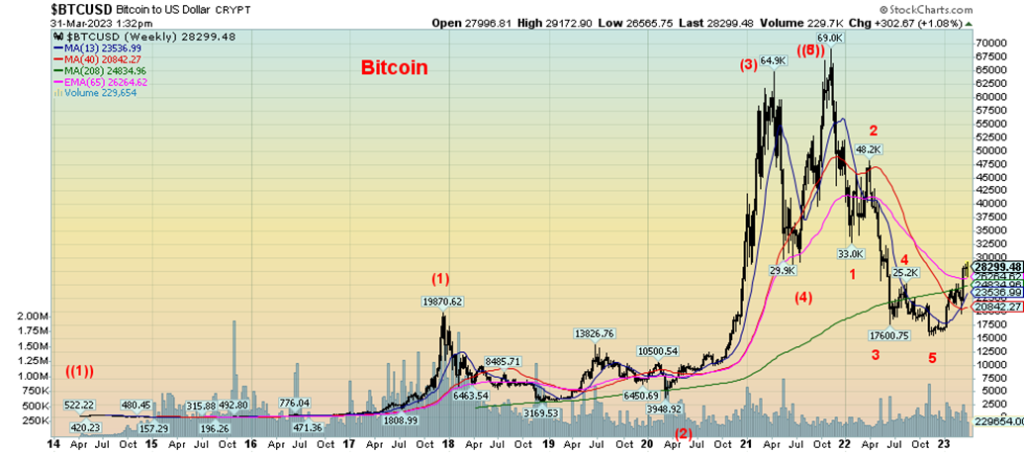
Bitcoin has been on a bit of a tear of late, rising from its low of around $15,500 to a recent high of just over $29,000. This has got a few people excited that crypto is back. We’ve even seen calls that Bitcoin is headed to $100,000. Of course, we saw that before in runups in 2017 and 2020–2021. Back then, calls were that Bitcoin was headed to $1,000,000. Okay, it almost made it, peaking out at around $69,000 in November 2021.
Bitcoin now has a market cap of around $550.0 billion. If Bitcoin were a company, it would place them as about the 10th largest company in the world. But for the entire crypto industry, Bitcoin makes up some 46% of the entire market. With a market cap of $1,185.0 billion, the entire crypto market would only be the 5th largest company in the world, just ahead of Amazon and behind Apple, Microsoft, Saudi Aramco, and Google. Bizarrely enough, the crypto market, according to Coin Market Cap (www.coinmarketcap.com) still lists some 23,121 cryptos on 591 exchanges.
However, crashing crypto exchanges and exposure of frauds, scams, and more still plague the industry. FTX and Sam Bankman-Fried are just the tip of the iceberg in the industry. Besides scams, frauds, and people and exchanges just disappearing overnight (with everyone’s money), the industry was well-known for money laundering. But other names resonate as well—Three Arrows Capital, BlockFi, Voyager Digital, and Celsius Network are just some other exchange names that failed in the past year. 2022 has proven to be a seminal moment for the crypto industry despite the recent rebound for Bitcoin.
The crypto market topped out at around $2.8 trillion in market cap. Today, it is down some 57% from that lofty high. Bitcoin wasn’t spared and it too is down around 57% from its high. There are a number of crypto ETFs that trade on stock exchanges. The most popular is one called ProShares Bitcoin Strategy ETF (BITO-AMEX). It’s down 60% from its high.
No crypto has been spared. Our old favorite Dogecoin rose from virtually nothing to trade as high as $0.74. Today it is $0.076, down 90%. But, hey, it’s still up some 6,800% from its low.
Could Bitcoin go higher? Of course, it could. We haven’t seen anything to suggest a top just yet. Next resistance appears to be up around $32,000/$32,500. A normal 50% correction could take Bitcoin to around $42,000. Note a potential congestion zone of resistance from around $37,500 to $48,000. Why Bitcoin is rising we are not sure. It’s not the safe haven many touted it to be. Unlike gold, it’s not real, just virtual. No wonder it can be here today, gone tomorrow. If we broke back under $23,000 and especially under $20,000, the rally would be over.
We like what appears to be a five-wave up pattern for Bitcoin, seen from its humble beginnings in 2014 to that lofty peak in November 2021. But that wave down also appears to be five waves, suggesting that this current up wave is merely a corrective wave to the down wave that bottomed in November 2022. Altogether, Bitcoin fell an incredible 77%. We suspect that the next wave down could take Bitcoin even lower. Yet many continue to believe that Bitcoin and crypto are the next big thing. The regulators may have something to say about that as they seek to tighten their grip. And high-profile cases like Sam Bankman-Fried and FTX should keep many out of a market that has attained a very shady reputation. We’ve even had movies about it, mostly documentaries. Maybe stick to the movies. Your money would be safer.
Markets & Trends
| % Gains (Losses) Trends | ||||||||
| Close Dec 31/22 | Close Mar 31/23 | Week | YTD | Daily (Short Term) | Weekly (Intermediate) | Monthly (Long Term) | ||
| Stock Market Indices | ||||||||
| `S&P 500 | 3,839.50 | 4,109.31 | 3.5% | 7.0% | up | up | neutral | |
| Dow Jones Industrials | 33,147.25 | 33,274.15 | 3.2% | 0.4% | neutral | neutral | neutral | |
| Dow Jones Transport | 13,391.91 | 14,438.66 | 5.3% | 7.8% | down (weak) | up (weak) | up | |
| NASDAQ | 10,466.48 | 12,291.91 | 3.4% | 16.8% | up | up | neutral | |
| S&P/TSX Composite | 19,384.92 | 20,099.91 | 3.1% | 3.7% | neutral | up (weak) | up | |
| S&P/TSX Venture (CDNX) | 570.27 | 634.18 | 3.6% | 11.2% | up | up (weak) | down (weak) | |
| S&P 600 (small) | 1,157.53 | 1,182.07 | 3.7% | 2.1% | down | down (weak) | neutral | |
| MSCI World Index | 1,977.74 | 2,099.19 | 1.8% | 6.9% | up (weak) | up | neutral | |
| Bitcoin | 16,535.23 | 28,560.33 | 2.0% | 72.7% | up | up | neutral | |
| Gold Mining Stock Indices | ||||||||
| Gold Bugs Index (HUI) | 229.75 | 256.18 | 3.2% | 11.5% | up | up | down (weak) | |
| TSX Gold Index (TGD) | 277.68 | 307.44 | 0.5% | 10.7% | up | up | neutral | |
| % | ||||||||
| U.S. 10-Year Treasury Bond yield | 3.88% | 3.48% | 3.0% | (10.3)% | ||||
| Cdn. 10-Year Bond CGB yield | 3.29% | 2.91% | 5.8% | (11.6)% | ||||
| Recession Watch Spreads | ||||||||
| U.S. 2-year 10-year Treasury spread | (0.55)% | (0.56)% | (40.0)% | (1.8)% | ||||
| Cdn 2-year 10-year CGB spread | (0.76)% | (0.84)% | (23.5)% | (10.5)% | ||||
| Currencies | ||||||||
| US$ Index | 103.27 | 102.19 | (0.6)% | (1.1)% | down | down | up | |
| Canadian $ | 73.92 | 74.00 | 1.6% | 0.1% | up (weak) | down | down | |
| Euro | 107.04 | 108.41 | 0.7% | 1.3% | up | up | down | |
| Swiss Franc | 108.15 | 109.29 | 0.5% | 1.1% | up | up | up (weak) | |
| British Pound | 120.96 | 123.32 | 0.8% | 2.0% | up | up | down | |
| Japanese Yen | 76.27 | 75.32 | (1.5)% | (1.3)% | neutral | up | down | |
| Precious Metals | ||||||||
| Gold | 1,826.20 | 1,986.20 | 0.1% | 8.8% | up | up | up | |
| Silver | 24.04 | 24.16 | 3.5% | 0.5% | up | up | neutral | |
| Platinum | 1,082.90 | 1,003.10 | 2.0% | (7.4)% | up | up (weak) | neutral | |
| Base Metals | ||||||||
| Palladium | 1,798.00 | 1,468.0 | 3.8% | (18.4)% | neutral | down | down | |
| Copper | 3.81 | 4.09 | 0.5% | 7.4% | up (weak) | up | up (weak) | |
| Energy | ||||||||
| WTI Oil | 80.26 | 75.67 | 9.3% | (5.7)% | neutral | down | neutral | |
| Nat Gas | 4.48 | 2.22% | (5.9)% | (50.5)% | down | down | down (weak) | |
New highs/lows refer to new 52-week highs/lows and, in some cases, all-time highs.
The S&P 500, along with the rest of the market, had a good up week. The S&P 500 gained 3.5%, the Dow Jones Industrials (DJI) was up 3.2%, the Dow Jones Transportations (DJT) gained 5.3%, while the NASDAQ was up 3.4%. Only the NASDAQ moved to new highs. As to other US indices, we note the S&P 400 (Mid) gained 4.5%, the S&P 600 (Small) was up 3.7%, the KBW Banking Index (BKX) gained 4.7%, but then it fell 49% from its high. The Dow Jones Utilities (UTIL) was up 3.2%, the NASDAQ 100 gained 3.3%, the AMEX was up 6.7%, the Wilshire 5000 gained 3.7%. The Russell’s saw the 1000 up 3.7%, the 2000 gained 3.6%, and the 3000 was up 3.6%. Nobody except the NASDAQ 100 saw new highs.
The S&P 500 Equal Weight Index rose 4.4% on the week, but is nowhere near its earlier high made in February. The SPXEW is down 7% from that high while the SPX is down only 2%. A divergence? The NY FANG Index was up 4.2% and, like the NASDAQ, it did make new highs. Bitcoin gained about 2% on the week and some believe we could soon hit $32,000 (See Chart of the Week).
In Canada, the TSX Composite gained 3.1% and the TSX Venture Exchange (CDNX) was up 3.6%. In the EU the London FTSE gained 3.1%, the Paris CAC 40 was up 4.4%, the German DAX gained 4.5%, while the EuroNext jumped 4.1%. In Asia, China’s Shanghai Index (SSEC) was up a small 0.2%, the Tokyo Nikkei Dow (TKN) gained 2.4% and the Hong Kong Hang Seng (HSI) jumped 2.4%. Nobody was making new highs for the recent moves.
We note some divergences below following our note on the NASDAQ. All of this suggests that whatever the markets are doing, it should not be the start of a big new wave to the upside. However, considerable bullishness is creeping back in the market.
Somehow, they believe the banking crisis is over. They also believe the Fed is going to pivot. But with over $600 billion in losses at banks, the banking crisis is far from finished. The Fed is trying to rescue and the Federal Deposit Insurance Corporation (FDIC) is trying to insure. But we note that money supply is falling and deposits are coming out of commercial banks (chart later), all suggesting that things are not well. As well, we have the threat of war lurking in the background.
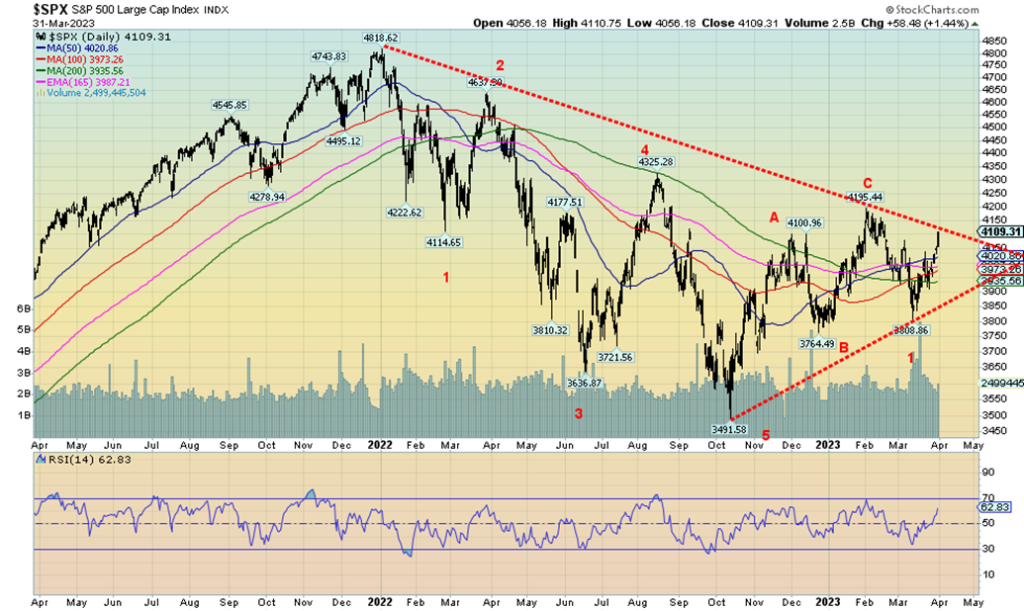
We won’t deny that we could go higher. The S&P 500 needs to break out over 4,100 and especially over 4,150 to suggest to us that we could go higher. On Friday, we did close at 4,109 but more work needs to be done. To the downside, our break points remain at 3,900 and especially under 3,700. 3,764 was the December low and if that fell, then the rally is over.
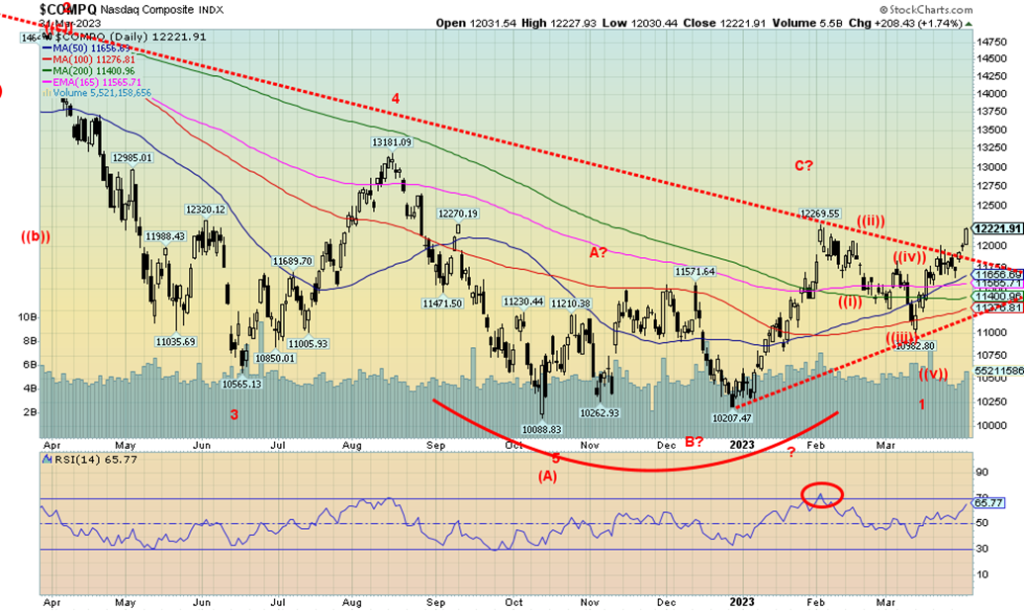
Is the NASDAQ leading the way? The NASDAQ broke out this past week and appears to be the leader to the upside. But, as we show in our next chart that uses the NASDAQ 100 instead of the broader NASDAQ, we are seeing a divergence with the new highs-new lows index. That may signify that the breakout is false. The NASDAQ was up 3.4% on the week. The NY FANGS Index was up 4.2% as the FAANG stocks appeared to be
leading the way. Risk on? Two FAANGS—Meta and Nvidia—both made new all-time highs with Meta up 2.9% and Nvidia up 3.7%. The forever bouncing-around Chinese FAANGS saw Alibaba gain 17.6% on the week but its sister Baidu fell 3.4%, one of the two loser FAANG stocks. The other loser was Google, off 1.9%. We note that the NASDAQ finally saw its golden cross as the 50-day MA crossed over the 200-day and 165-day EMA this past week. Is that the sign of a bigger jump that could help propel the NASDAQ and by extension the market to higher prices? An uptrend line has developed and the breakdown point is near 11,200, with confirmation of a breakdown under 11,000.
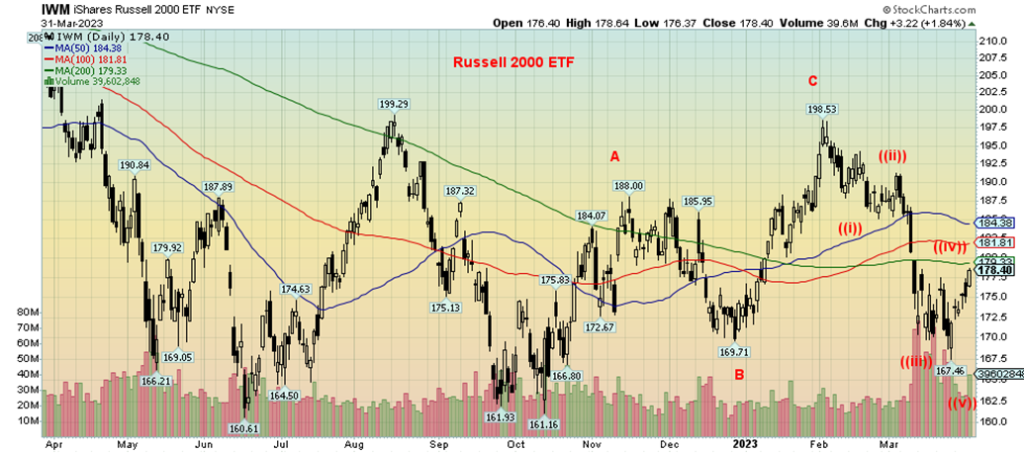
Maybe our real clue as to what is going on is the Russell 2000 ETF. The low was, along with everyone else, last October. A clear ABC corrective pattern was seen topping out in January. The wave down fell in a clear five-wave pattern to make a minor wave 1, suggesting this was the start of a new wave to the downside. Much remains to be seen, but the current Russell 2000 rebound should unfold in an ABC-type pattern to make minor wave 2. Note the golden cross on the Russell 2000.
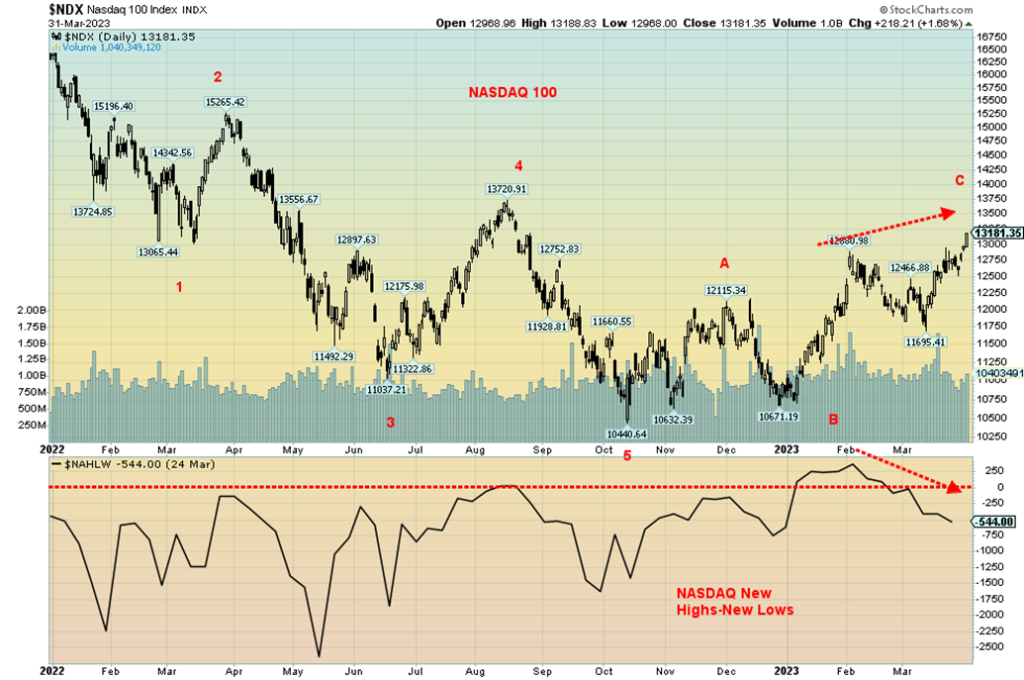
Divergence number 1. Seems that the NASDAQ 100 moved to new highs this past week (as did the broader NASDAQ), but the NASDAQ new highs less new lows index (NAHLW) is falling. The NASDAQ NAHNL is not confirming the new high for the NASDAQ 100. It’s a note of caution, a warning.
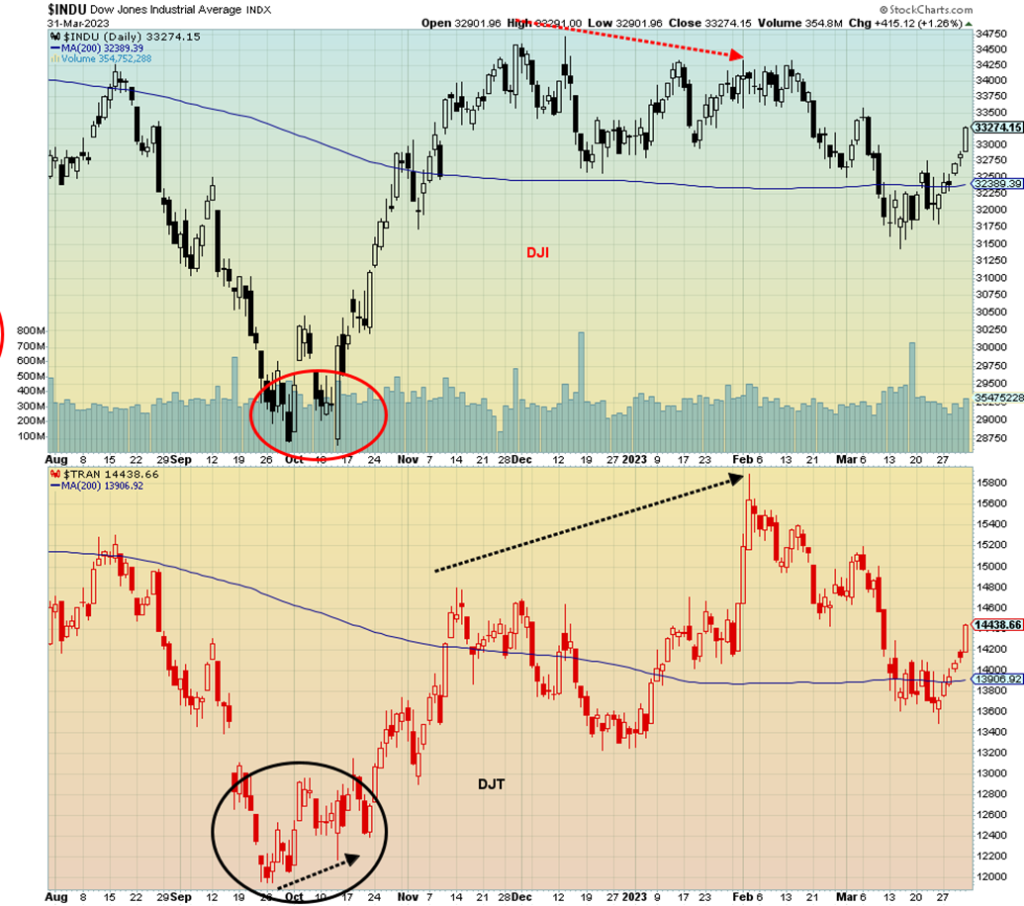
Divergence number 2. One we have noted in the past. The DJI did not make new highs along with the DJT in late 2022-early 2023. Since then, both have fallen. Note how the DJI took out its December low but the DJT did not. Another divergence. Like the NASDAQ NAHNL, this is a warning that all is not well.
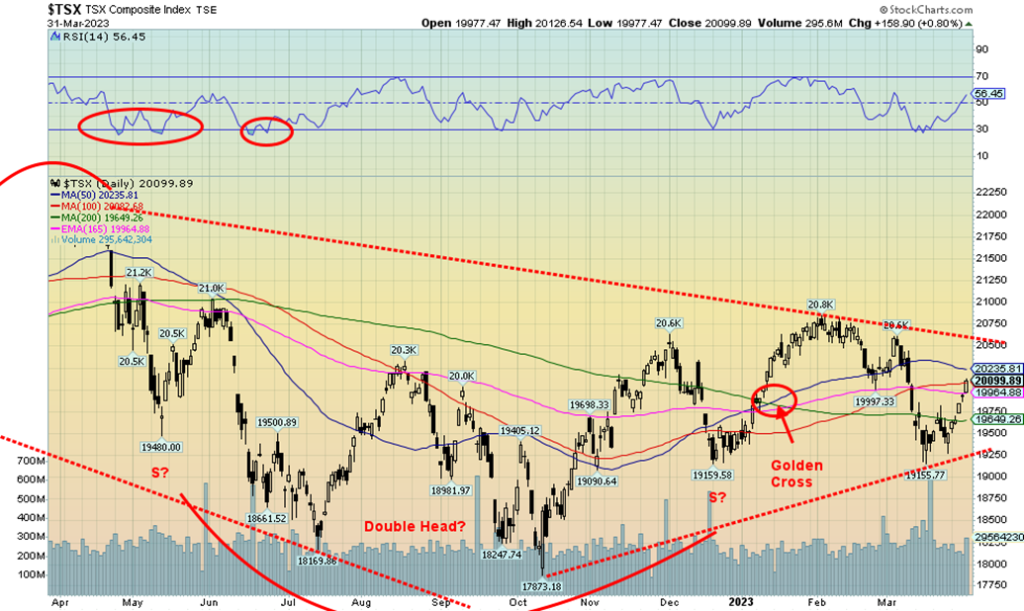
The TSX Composite rallied 3.1% this past week and is now up 3.7% on the year. However, the TSX remains some 3% or so off its recent high in January. The TSX remains below a potential breakout line near 20,500. Of the 14 sub-indices, only one was down and that was Health Care (THC), down a tiny 0.05%. Leading the way to the upside was Energy (TEN), up 5.6%, followed by Consumer Staples, up (TCS) 5.4%. Surprisingly, TCS made fresh 52-week highs. Consumer Discretionary (TCD) was up 4.5%, Information Technology (TKK) gained 4.2% and Metals & Mining (TGM) was up just under 4%. We were hard-pressed to find a poor performer, but Golds (TGD) and Telecommunications (TTS) were the laggards, with only about a 0.5% gain. After rallying from the October low of 17,873, the TSX topped out around 20,800 in January. The pattern appears to us as an ABC corrective pattern. However, the wave down to the recent March low also fell in an ABC, suggesting it is corrective only. Whether this one has the legs to rally above 20,500 remains to be seen. If it does, it may be a five-wave pattern to the upside, signifying the C wave of a larger degree and completing a big ABC correction. To the downside, the line is around 19,250. A break of that level would signify that the rebound is over and a fresh wave to the downside is underway.
U.S. 10-year Treasury Bond/Canadian 10-year Government Bond (CGB)
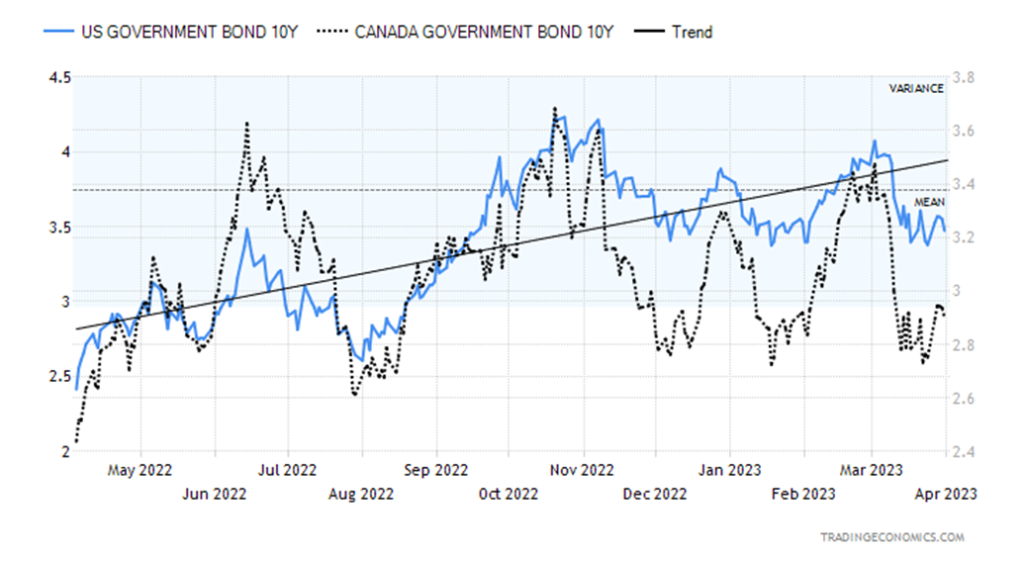
Bond yields rose this past week. The 10-year U.S. treasury note rose to 3.48%, up from 3.38% the week before. In Canada, the 10-year Government of Canada bond (CGB) was up to 2.91% from 2.75%. The prime reason appears to be resilience in the economy. In Canada, they reported that the January GDP rose 0.5%, well above the expected 0.3%. February’s preliminary GDP was up 0.3%, again above forecasts of a retraction of 0.1%. In the U.S., the house price index rose 0.2% for January when they thought it would fall 0.2%. The Consumer Confidence Index came in at 104.2 vs. an expectation of 101. The Richmond Fed Index was +2 instead of -11, February’s pending home sales gained 0.8% rather than falling 2.3%. Initial weekly jobless claims were 198,000, but at least that was slightly above expectation of 196,000. GDP growth for Q4 was 3.9%, about as expected, while PCE prices for Q4 were 3.7%, again, about as expected.
Personal income for February was up 0.3%, above the expected 0.2% while personal spending was up 0.2%, below the expected gain of 0.3%. The PCE price index for February gained 0.3% below the expected 0.4% gain. Year-over-year PCE prices were up 5%, slightly below the expected 5.1%. The Chicago PMI continued to signal recession, coming in at 43.8, but that was better than the expected 42.0. The Michigan Consumer Sentiment Index was at 62 and that was below the expected 63.2 and below last month’s 67. All in all, more numbers came in better than expected, which helped push bond yields up as they lost a little of their safe haven status. Also helps explain why gold faltered and stocks rose.
This week, the big day is Friday when the March employment numbers come out. The consensus nonfarm payroll number is 238,000 vs. last month’s gain of 311,000. The unemployment rate is expected to remain at 3.6%. Watch for consumer credit as it is expected to jump $18 billion vs. last month’s jump of $14.8 billion.
It is difficult to say which way bond yields will go here. The spreads rose as well. The U.S. 2–10 spread was up to negative 56 bp from negative 40 bp the week before while Canada’s 2–10 spread was negative 84 bp vs. negative 68 bp. We don’t see any serious rise in yields unless the U.S. 10-year regains above 3.75% and Canada jumps back over 3.0%. Otherwise, we could just continue to waffle around. Maybe that’s the best. At least it will take some pressure off mortgages and the wobbly housing market in both Canada and the U.S.
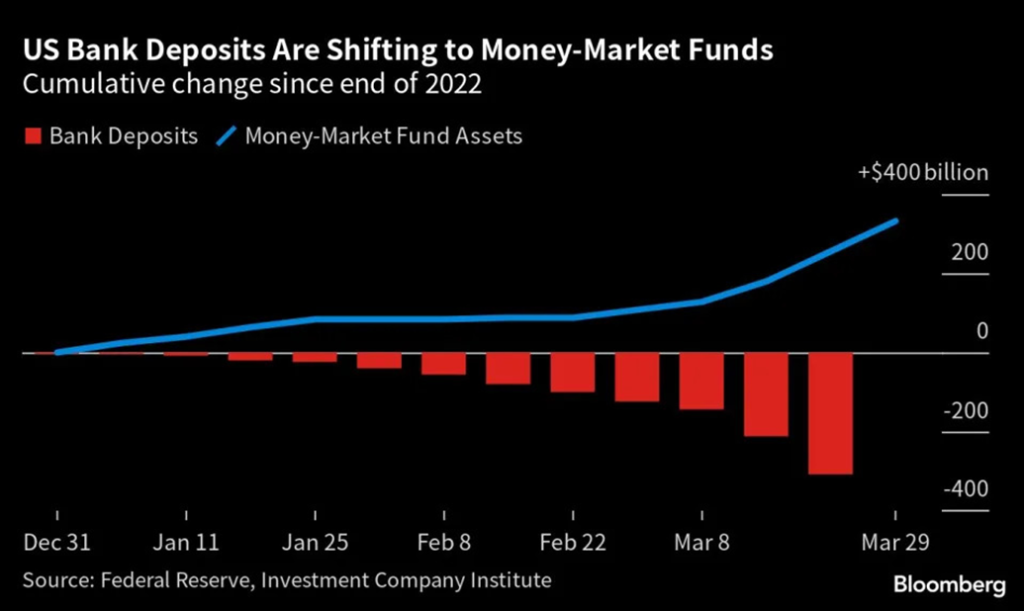
Within the context of the ongoing banking crisis, it’s necessary we note that deposits at banks are falling as they shift to money market funds. There is considerable nervousness about the banks and deposits, especially those deposits above the $250,000 FDIC insurance limit are yanked out. Money market funds, while not covered by FDIC, are more a mixture of U.S. treasury bills, commercial paper usually rated at least Tier 1 and more likely Tier 1+, and short-term bonds and notes maturing less than one year of the U.S. treasury or top tier corporates. Ergo, more diversification and less exposure to any particular bank. Withdrawal of deposits puts pressure on the banks who are then forced to sell liquid assets to cover the losses. As with SVB Bank, the assets are sold at a loss. The banking crisis, despite the current lull, is not yet over. Economist Nouriel Roubini (aka Dr. Doom) has noted that many banks are technically insolvent and many others are technically near insolvency.
The US$ Index fell this past week, losing about 0.6%. Other currencies rose as the euro was up 0.7%, the Swiss franc gained 0.5%, the pound sterling was up 0.8%, but the Japanese yen lost 1.5%. The big winner was the Canadian dollar, up about 1.6% thanks to a rise in oil prices and higher-than-expected GDP report. The US$ Index is falling because of thoughts the Fed could ease, bond yields have been falling, and gold has been rising for a variety of fear reasons. Also, there is concern the U.S. could soon fall into recession, and there is the banking crisis that is probably not over. Other things like the debt limit fight could have a negative impact on the US$ Index. Finally, as we note in our main essay, there is the ongoing trend to de-dollarization, led by China. Foreign holdings of U.S. treasuries have been falling and that too is negative for the US$ Index.
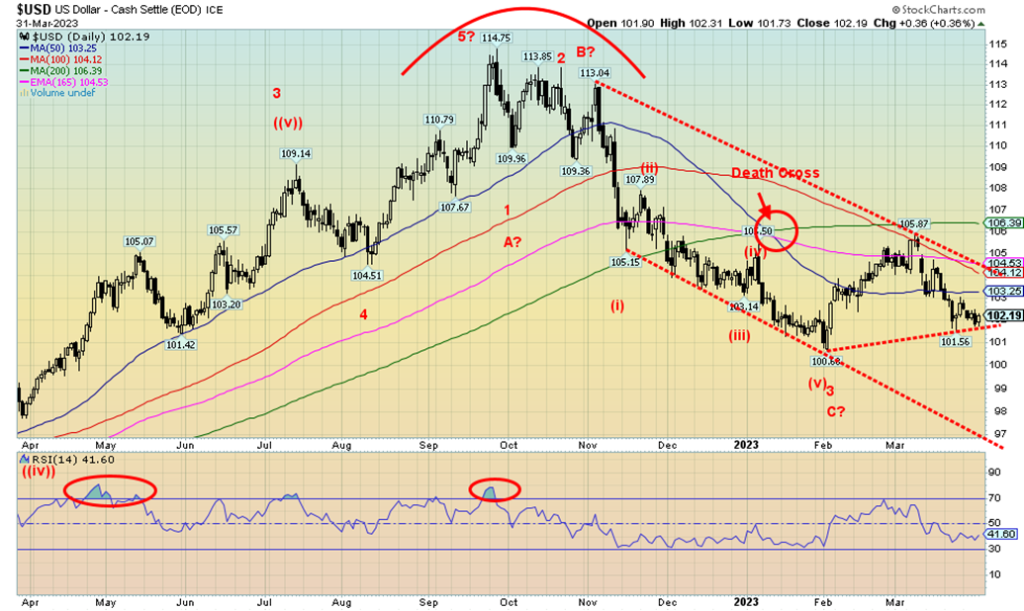
The question we have on our mind is, is the US$ Index about to take a further tumble? The high at 114.75 back in September 2022 appears to be a significant high. We have fallen about 11% from that high. We had the death cross back in January. That has not changed. We remain below our key MAs of 50, 100, and 200 days. But we are hanging above our recent low of 100.68. A break now of 101 would be negative and a breakdown under 100 would be quite negative and could send us towards the bottom of that channel near 97.
With an RSI at 41, we have considerable room to move lower before we are under 30 RSI. The correction off that low of 100.68 appears to have been short-lived, but it corrected roughly 36% of the decline which is between the 1/3 correction and the Fibonacci 38.2% correction. From that perspective, it was a normal correction. The next move down may now be underway and will confirm with new lows.
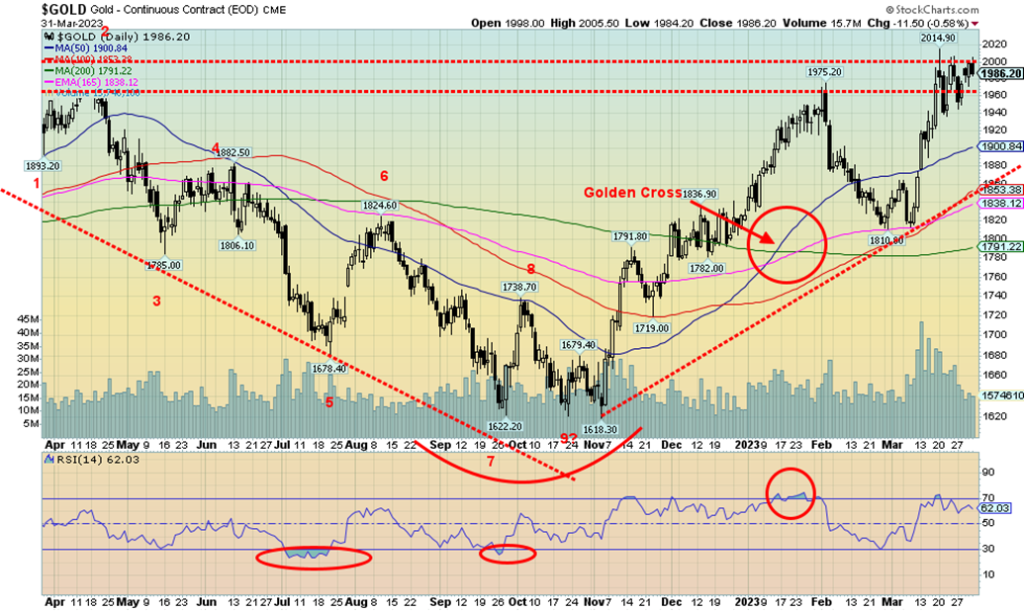
Gold prices struggled this past week as $2,000 remains a barrier. All this despite the decent PCE prices report and a banking crisis that is not over. Gold rose a small 0.1% this past week. On the quarter, gold was up 8.8%. Gold has been making new highs, unlike the stock markets which mostly remain below recent highs. We are up nearly 10% from that February low at $1,810 and up 22.7% from the November low of $1,618.
Elsewhere on the week, silver gained 3.5%, platinum was up about 2.0%, palladium gained 3.8%, and copper was up 0.5%. The gold stocks also rallied, with the Gold Bugs Index (HUI) up 3.2% and the TSX Gold Index (TGD) up about 0.5%. Platinum and palladium remain down on the year, the only losers. Platinum was down 7.4% in the quarter and palladium off 18.4%. Copper gained 7.4%.
Gold is responding positively to thoughts that the Fed might ease its rate hikes as inflation eases. The US$ Index also fell this past week and that helps gold. As well, bond prices have rallied although they backed off a bit in the past week as yields rose. However, one thing we note that others are noting is the ongoing beating of war drums. According to sources we have read mostly in European newspapers, there has been a build-up of NATO troops in Poland, Russia is looking at sending tactical nuclear weapons to Belarus, and we learned that North Korea could be sending 50,000 troops to Russia to aid in the fighting in Ukraine. Widening potential for war is, at the end of the day, good for gold. Naturally, none of this is fully confirmed as we’ve seen little to nothing in Western newspapers. But it is worth keeping an eye on.
Other issues worth keeping an eye on for gold are the debt limit fight and the indictment of former president Donald Trump. While we are sure it will turn into a media circus, we are unsure as to what his followers might do and what impact, if any, it could have on gold. Finally, there is the ongoing banking crisis. While SVB Bank fell along with Signature bank, Credit Suisse was gobbled up by UBS, and Deutsch Bank is experiencing liquidity problems, we know there are probably more banks in trouble behind the scenes. As my colleague Mike Ballanger notes, there is always more than one cockroach scurrying around in the cupboard. Gold acts as a safe haven in war, civil war, and banking crises. Besides all the banks we mentioned, remember we also had a huge collapse in the crypto market led by FTX and earlier we had the run in the U.K. over the policies of the former PM Liz Truss’s attempts to change everything. That almost brought down the U.K. pension funds and sparked a huge intervention in the markets by the BOE. As we say, “who’s next?”
Debt limit, indictment (the first) of a former president, banking troubles, crypto troubles, and building up of war. Gold, along with U.S. treasuries, becomes the safe haven.
Despite the deterioration in the commercial COT noted next, we believe gold should break through $2,000. A solid break (and close) above $2,000 could set our sights on the all-time high of $2,089 seen in August 2020. The RSI is still at a reasonable 62%, so there is room to move higher here. As well, despite the deterioration in the commercial COT, it usually takes more than few weeks of ongoing deterioration before we usually see a high. A spike into April would not surprise us. Whether it is an April or early May high, we do expect one, then a pullback into at least June. It is not usually until July or August that the next rally could get underway. The Fed next meets on May 2–3 so we won’t know until then what the Fed might do. Hints have been for another 25 bp hike.
Gold has formed over the past 11 days what appears to us as bull pennant. We need that breakout over $2,000 to confirm the pennant. It would have measuring implications to at least $2,080 with even higher potential. That would warm the cockles of the gold bugs’ hearts, but given the deterioration in the commercial COT we’d be looking for a spike top followed by a more substantial correction.
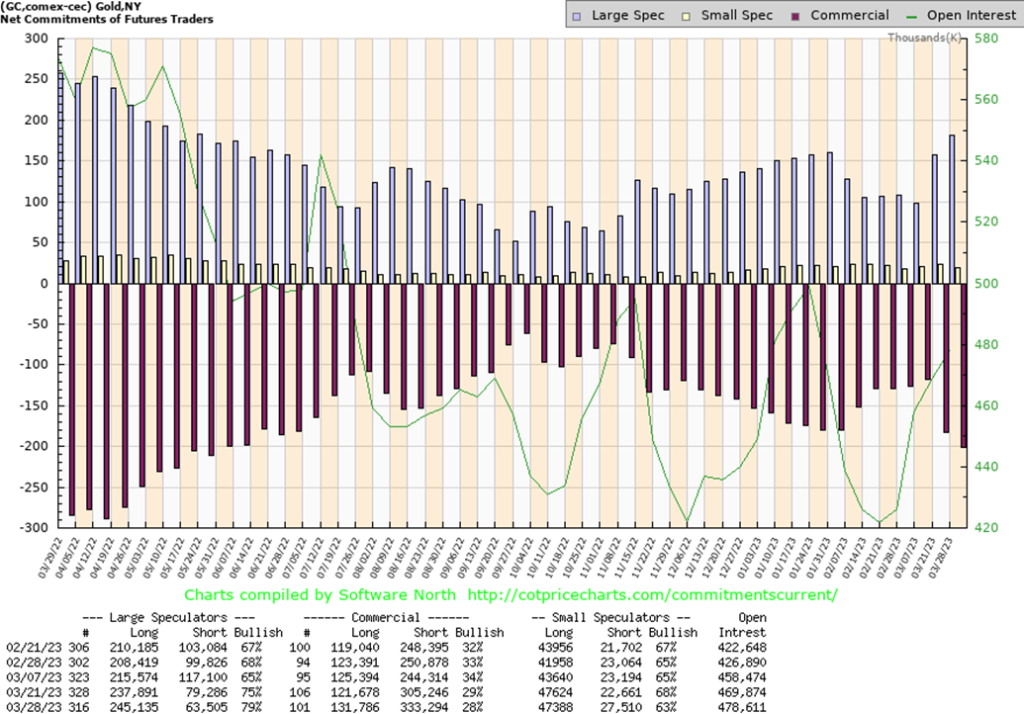
At long last, an updated COT. While it’s good to get the COT, the fact that the commercials have begun to go short is not a great sign. This past week the commercial COT fell to 28% from 29% and down from a peak of 34% seen only three weeks ago. Longs actually went up roughly 10,000 contracts, but shorts also rose up 28,000 contracts. The large speculators’ COT rose to 79%, the best seen in weeks as they added just over 11,000 longs while slashing their shorts by about 16,000 contracts. Open interest rose about 11,000 contracts on an up week for gold. We are not yet at the low 20% that we might associate with a high for gold. As a result, the commercial COT may fall further over the next few weeks. It’s still early but, as we note, a spike high in April would not be a surprise.
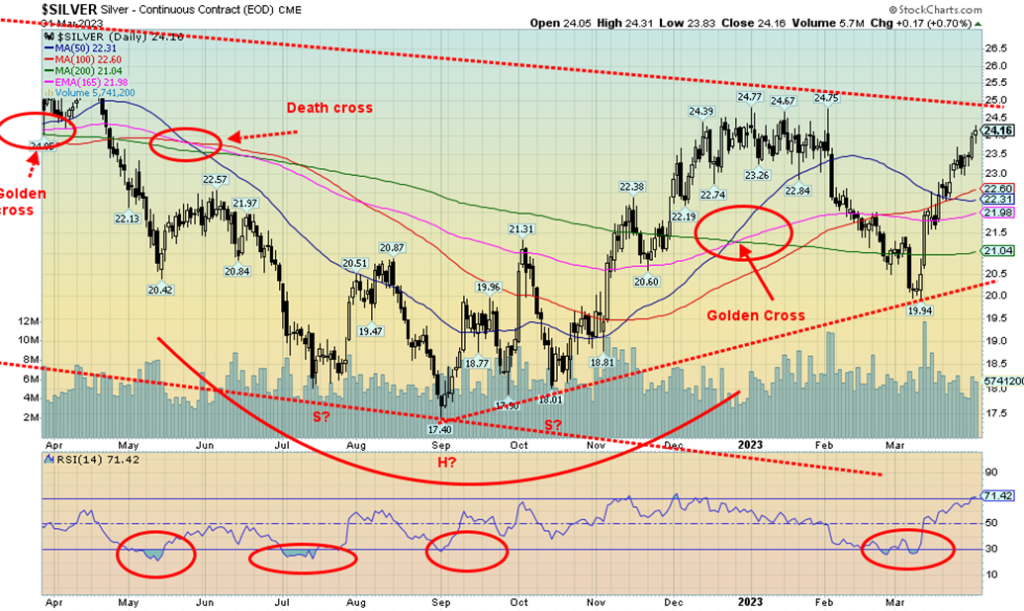
Silver prices jumped through $24 this past week with a gain of 3.5%. Silver is now, finally, up on the year but only by 0.5%. Not exactly spectacular. Still, we have rallied a nice 21% from that early March low. Like gold, we expect that silver could spike into April sometime. A big breakout for silver remains elusive. We need to get over $25 to suggest that. We need to get over $27.50 to suggest to us that new highs are possible over $30.35, the spike high seen in February 2021. While gold has been making new highs, silver has not. This is a potential negative divergence—hence, why we need to get over $25 to at least suggest that we could move higher. While gold topped out at $2,089 in August 2020, silver’s high so far is only that $30.35 seen in February 2021, well off its all-time high of $49.82 seen in April 2011. These divergences between gold and silver are ongoing sign that things may not be as good as they seem. The RSI has crept over 70, but that can stay that way if we are really bullish. We’d consider only a drop back below $23 as negative and a suggestion that the rally is over.
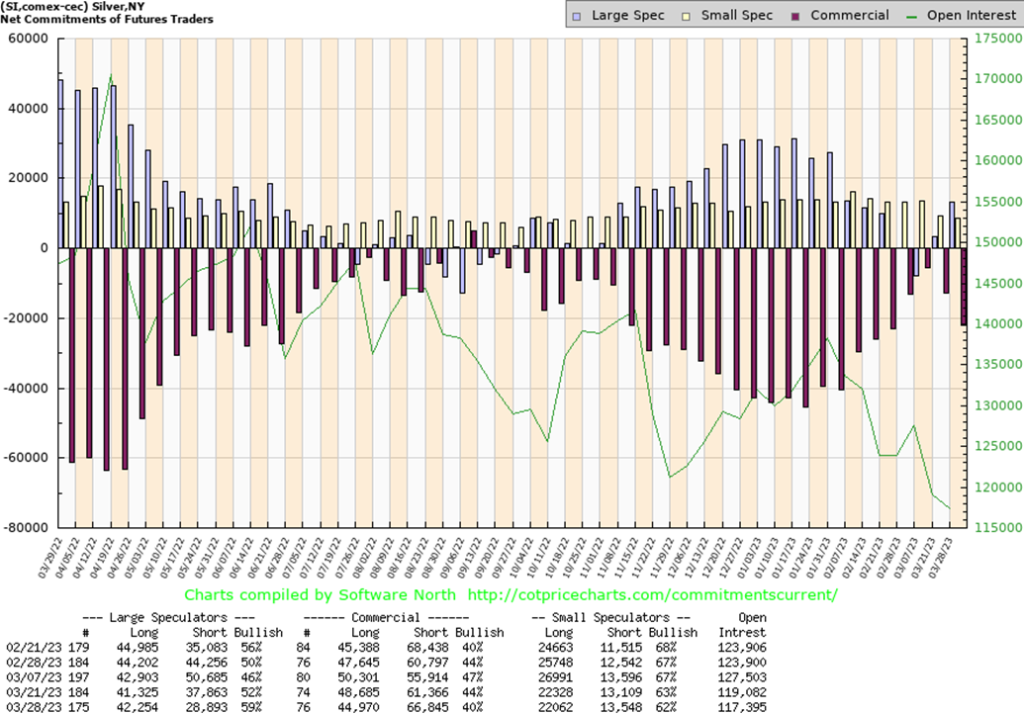
Yes, we have an up-to-date silver COT as well. The commercial COT for silver fell to 40% this past week from 44% and is down from a peak at 47%. Like gold, this is a warning but it does not yet signal that the silver rally is over. The large speculators COT is at 59%, the highest in weeks but still not at levels where we’d consider that they are getting very bullish. We need to see the commercial COT well down in the 30s and the large speculators COT up near 70% to suggest to us that a top may be nigh. Open interest fell despite the up week for silver. This past week, for the commercials, longs fell about 4,000 contracts while shorts jumped over 5,000 contracts.
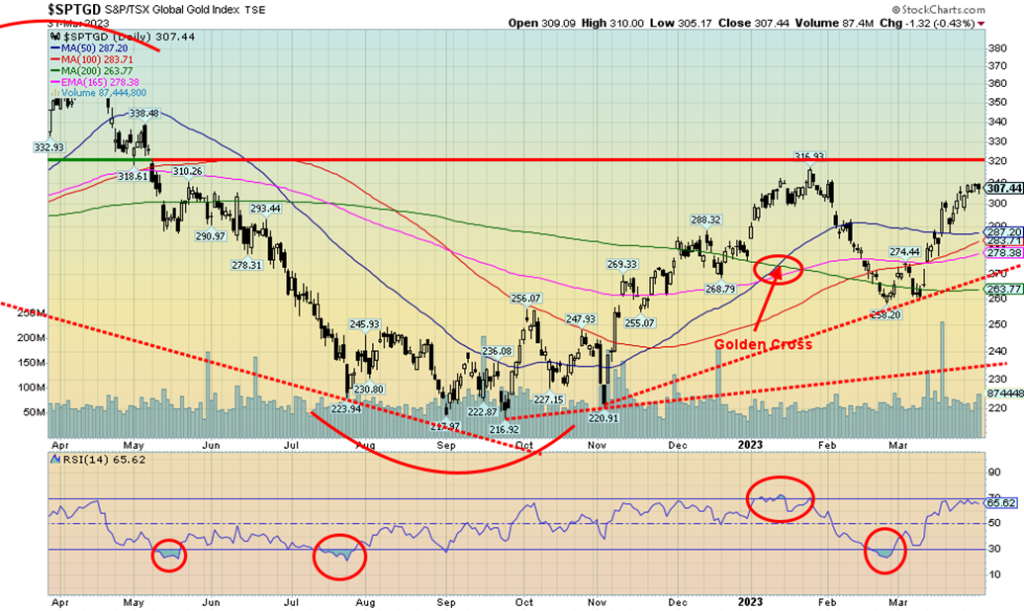
Despite a weak week from gold, the gold stocks managed yet another up week. It was the fifth consecutive weekly rise. The Gold Bugs Index (HUI) was up 3.2% but the TSX Gold Index (TGD) lagged, gaining only about 0.5%. The rise in silver prices over $24 helped the silver stocks, as we noted a number of them had a good week. Despite the rise, the TGD remains shy of breaking to new highs. We are over 300, but the January high of 317 is still 10 points away. We need to break above 320 to tell us that we are headed higher. We are still on the golden cross, even as it has flattened the past few weeks. We have support now down to around 288/290 and then down to 275 and 265. Below 260 is trouble. The TGD finished the quarter up 10.7% and the HUI was up 11.5%. After a not very good 2022, the first quarter rise was welcomed.
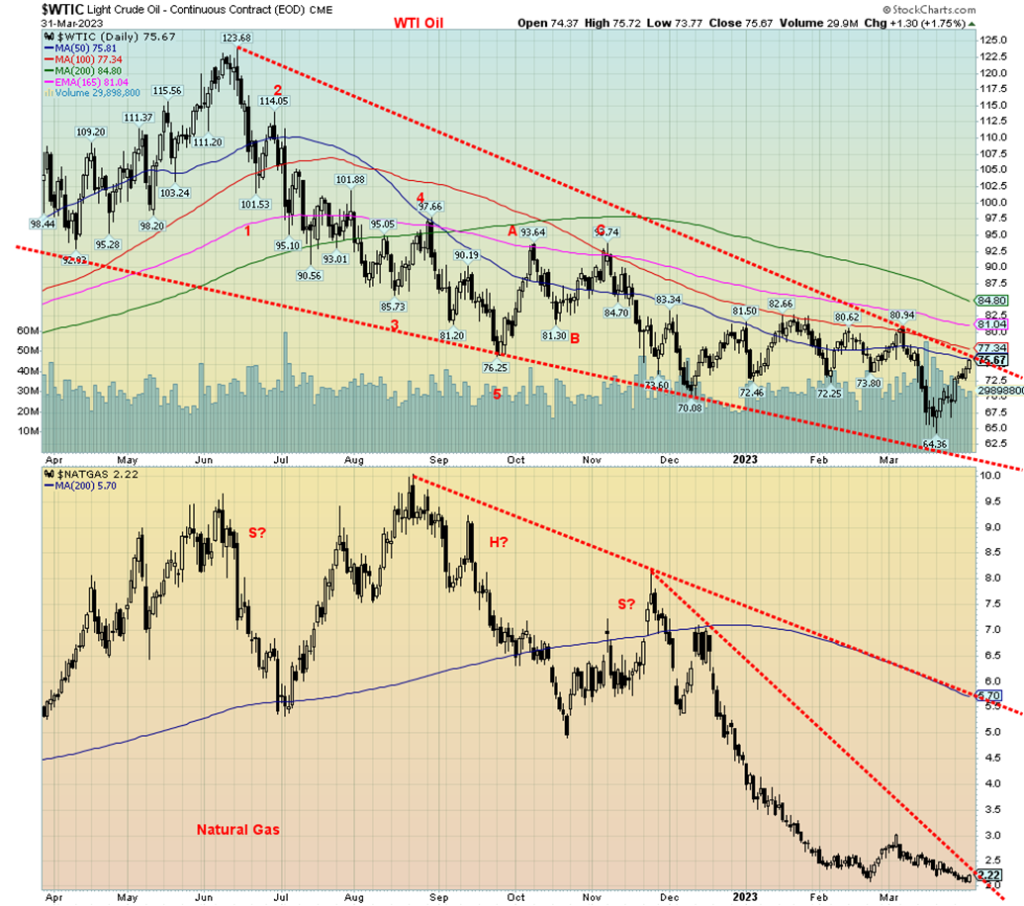
For the second consecutive week oil prices rose. WTI was up 9.3% while Brent jumped 6.4%. The Brent-WTI spread stands at $4.26. Natural gas (NG) continued its woes, losing 5.9% but did bounce back on Friday and at least is making a marginally higher low, for the moment. It is not that far from breaking that very steep downtrend line. A move over $2.50 would confirm the break. EU NG at the Dutch Hub regained up 16.4%.
Helping WTI was supply disruption in Kurdistan and a big drop in U.S. inventories. A drop in the U.S. dollar also helped, along with lower PCE price inflation. In Kurdistan, some oil is being shut in with a dispute raging with Iraq. Kurdish Iraq has the major oil fields of the Tawke and Peshkabir fields. Apparently, the dispute has to do with Turkey exporting Kurdistan oil without Iraq’s approval. Eventually, upwards of 500,000 bpd could be impacted. We noted a big drop in U.S. inventories as well which impacted the price.
WTI still appears to be in a downward descending wedge triangle. Our breakout level remains at around $80, although a move above $77 now would be positive. WTI still appears to be making a huge bottom pattern and, while the recent low at $64.36 was lower than previous lows, momentum had been fading. Nonetheless, there was a spike in volume into the low as traders viewed the drop as very bearish. Then it reversed to the upside, most likely catching a few by surprise and sparking some short covering. We note the recent COT for crude oil showed the commercials slashing their short position as the large speculators loaded up on shorts. That’s a classic example of the large speculators getting caught at the lows.
A move above $76/$77 would be the first sign of a breakout, but to feel comfortable that the breakout might be real we need to get above $80, then above $84.
Copyright David Chapman 2023
__
(Featured image by qimono via Pixabay)
DISCLAIMER: This article was written by a third party contributor and does not reflect the opinion of Born2Invest, its management, staff or its associates. Please review our disclaimer for more information.
This article may include forward-looking statements. These forward-looking statements generally are identified by the words “believe,” “project,” “estimate,” “become,” “plan,” “will,” and similar expressions. These forward-looking statements involve known and unknown risks as well as uncertainties, including those discussed in the following cautionary statements and elsewhere in this article and on this site. Although the Company may believe that its expectations are based on reasonable assumptions, the actual results that the Company may achieve may differ materially from any forward-looking statements, which reflect the opinions of the management of the Company only as of the date hereof. Additionally, please make sure to read these important disclosures.
David Chapman is not a registered advisory service and is not an exempt market dealer (EMD) nor a licensed financial advisor. He does not and cannot give individualised market advice. David Chapman has worked in the financial industry for over 40 years including large financial corporations, banks, and investment dealers. The information in this newsletter is intended only for informational and educational purposes. It should not be construed as an offer, a solicitation of an offer or sale of any security. Every effort is made to provide accurate and complete information. However, we cannot guarantee that there will be no errors. We make no claims, promises or guarantees about the accuracy, completeness, or adequacy of the contents of this commentary and expressly disclaim liability for errors and omissions in the contents of this commentary. David Chapman will always use his best efforts to ensure the accuracy and timeliness of all information. The reader assumes all risk when trading in securities and David Chapman advises consulting a licensed professional financial advisor or portfolio manager such as Enriched Investing Incorporated before proceeding with any trade or idea presented in this newsletter. David Chapman may own shares in companies mentioned in this newsletter. Before making an investment, prospective investors should review each security’s offering documents which summarize the objectives, fees, expenses and associated risks. David Chapman shares his ideas and opinions for informational and educational purposes only and expects the reader to perform due diligence before considering a position in any security. That includes consulting with your own licensed professional financial advisor such as Enriched Investing Incorporated. Performance is not guaranteed, values change frequently, and past performance may not be repeated.


Morocco’s Budget Execution June 2026: Deficit Narrows to 20.2 MMDH
Morocco’s Finance Law execution at end-June 2026 shows a reduced budget deficit of 20.2 billion dirhams, down from 24.9 billion...

Tilray Brands Hits Multi-Year Lows as Cannabis Investors Await Regulatory Clarity
Tilray Brands shares have fallen 57% this year amid cannabis sector weakness and uncertainty over US regulatory reform. While potential...


Ethereum Between ETF Inflows, Price Risks and a Strong July
Ethereum faces mixed signals as ETF inflows and a strong July performance support recovery, while technical resistance and downside risks...


Mercedes-Benz Accelerates EV Decarbonization With Recycled Aluminum
Mercedes-Benz expands its partnership with Hydro to accelerate supply chain decarbonization. Future electric vehicles will use Hydro CIRCAL aluminum containing...

Evotec and BioGaia Boost Biotech, while Vitrolife Disappoints
European stocks moved on earnings and broker actions. Evotec, BioGaia, Plus500, Pharming, Inwido, Amundi and Julius Baer rallied on upgrades,...
 |
|
 |  |
 |
|
-

 Cannabis6 days ago
Namibia Cannabis Activists Seek Political Path After Legal Setbacks
-
 Crypto2 weeks ago
Bitcoin, and Ethereum Rise, While Cardano Enters Transition
-

 Crowdfunding3 days ago
Urbanitae Drives Spain’s Real Estate Crowdfunding Boom with Record Growth and Investor Returns
-

 Impact Investing1 week ago
Swisscanto Launches Catastrophe Bond Fund for Portfolio Diversification