Markets
US stock markets stable, gold might drop due to employment rate
The unemployment rate ticked up to 4.8% primarily because more people were looking as the labor force participation rate rose to 62.9% from 62.7%. Gold, after faltering initially also rose later in the day bucking thoughts that a strong employment number would weaken gold.

The early part of last week saw the US stock markets weakening largely because the recent events happening, like the Muslim ban, attack on Yemen, and the Wall Street reform. Once again the tail is wagging the dog as the markets respond to political events. The US Dollar also fell and that, in turn, pushed gold higher. Friday’s employment report that came in sharply higher than expected helped push the US stock market back up again. As a result, the markets closed largely unchanged on the week. Gold, after faltering initially also rose later in the day bucking thoughts that a strong employment number would weaken gold.
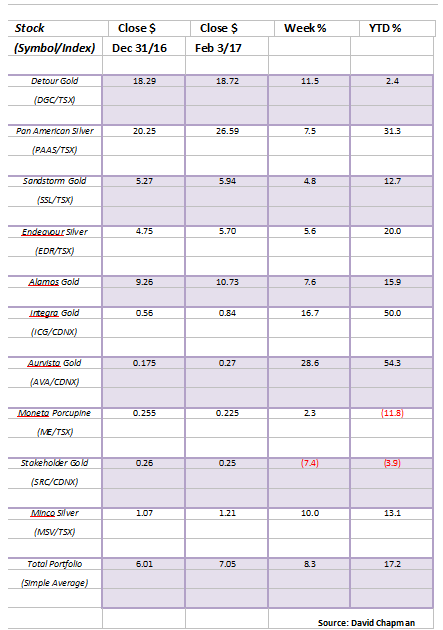
Model Portfolio
A good week for the model stock portfolio with the junior exploration stocks leading the way. Aurvista (AVA) and Integra (ICG) both now up 50% or more in 2017. Pan American Silver (PAAS) leads the way for the large cap gold stocks with a 31.3% gain so far in 2017. The two laggards are Moneta (ME) and Stakeholder (SRC). I believe both will eventually catch up.
© David Chapman
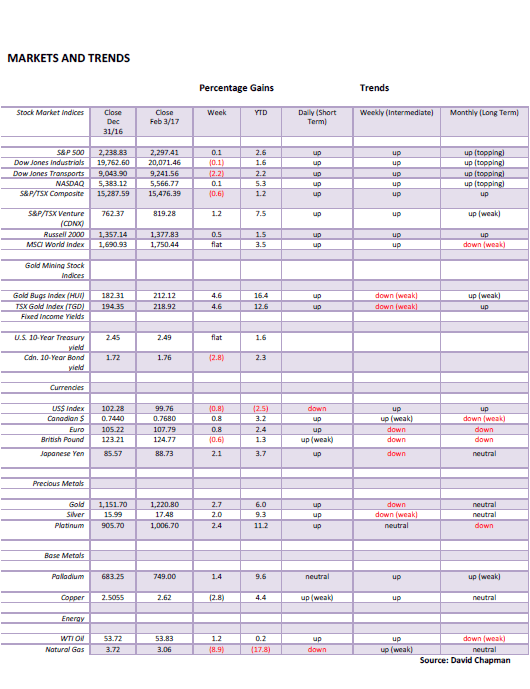
MARKETS AND TRENDS
© David Chapman
Note: for an explanation of the trends, see the glossary at the end of this article.
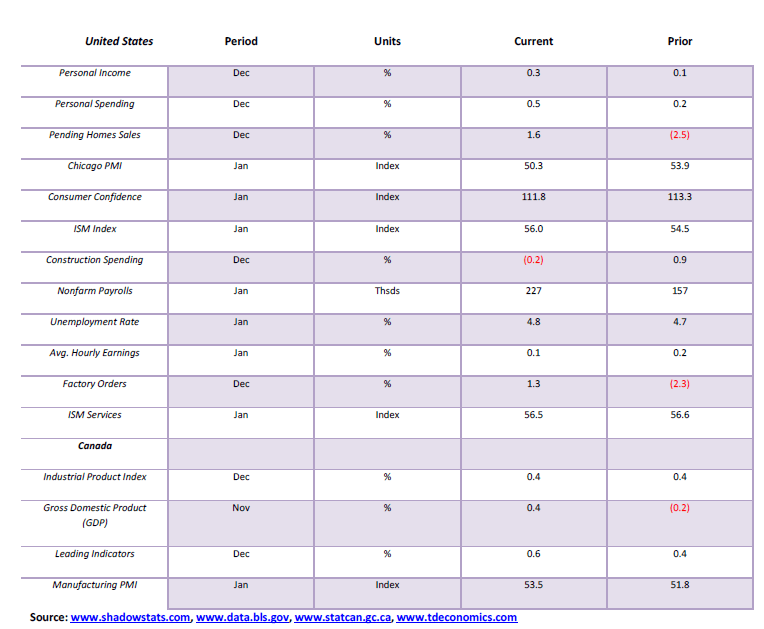
Key Economic Numbers Week January 30 – February 3, 2017
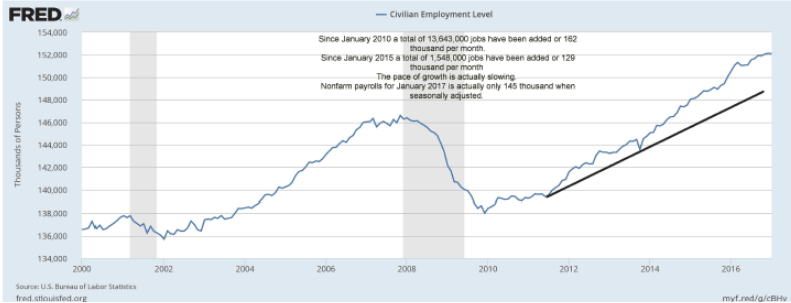
It was a busy week for economic numbers highlighted by the nonfarm payrolls that came out on Friday. They came in higher than expected at 227 thousand when the market was only looking for 170 thousand. The unemployment rate ticked up to 4.8% primarily because more people were looking as the labor force participation rate rose to 62.9% from 62.7% (see further comment on the employment situation below). The FOMC left interest rates unchanged as was expected but continued to believe the economy was improving. The Chicago PMI manufacturing index weakened but the ISM index strengthened somewhat so they kind of offset each other. Personal spending once again outstripped personal income suggesting that Americans are still going into debt. In Canada, the November GDP came in a bit better than expected up 0.4%. Key number out this coming week is the trade numbers for December.
(Source)
(Source)
Non-farm Payrolls – up 227 thousand January vs. up 157 thousand December
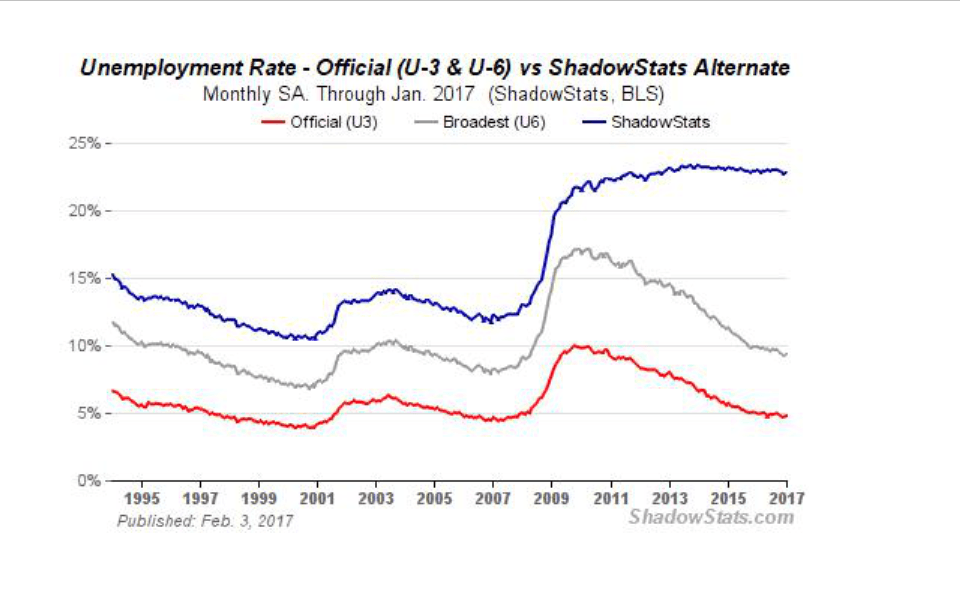
Official U3 Unemployment – 4.8% up from 4.7%
U6 Unemployment – 9.4% up from 9.2%
Shadow Stats Unemployment – 22.9% up from 22.7%
Labour Force Participation rate – 62.9% up from 62.7%
Civilian Employment Population Ratio – 59.9% up from 59.7%
The big problem is while the report sounds rosy these numbers are subject to numerous revisions even months down the road. The revisions are rarely paid attention to.
(Source)
(Source)
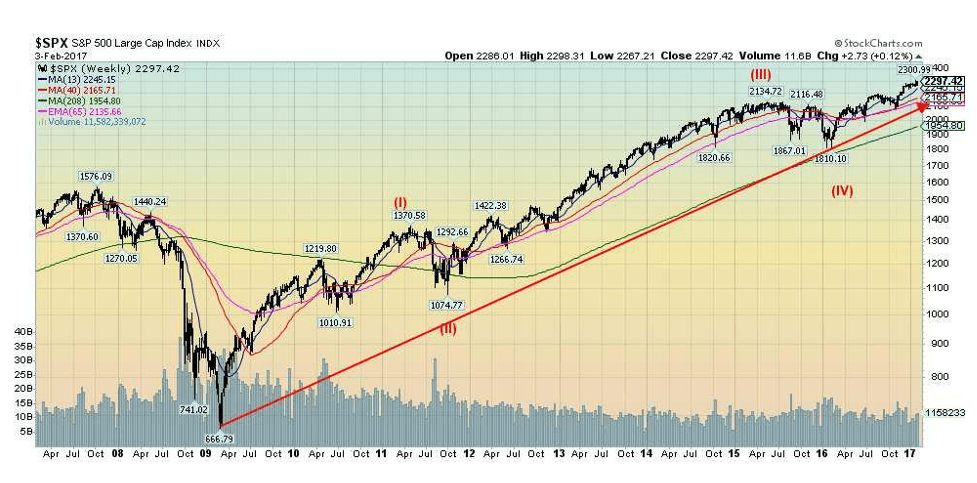
Sometimes it is best to sit back and look at the big picture to see where we are. So far it appears that the S&P 500 has completed four waves to the upside. The first wave topped in April 2011 at 1,370; wave two bottomed during the 2011 EU financial crisis at 1,074 in October; wave three topped out at 2,134 in May 2015; and, wave four bottomed in February 2016 at 1,810. The market is highly likely in wave five and looking for a top. As early as it was the 2011 low (dating from the major financial crisis 2008 and the 2009 low) was most likely a four-year cycle low and the February 2016 low was the next four-year cycle low. The lows of August 2015 and February 2016 were also most likely the 6.5-year cycle again dating from the 2008/2009 lows.
The next four-year cycle low is due anywhere from 2018 to 2020 while the next 6.5-year cycle low is due from 2020 to 2023. The question as always then when does this current cycle top. So where are on a shorter term basis.
(Source)
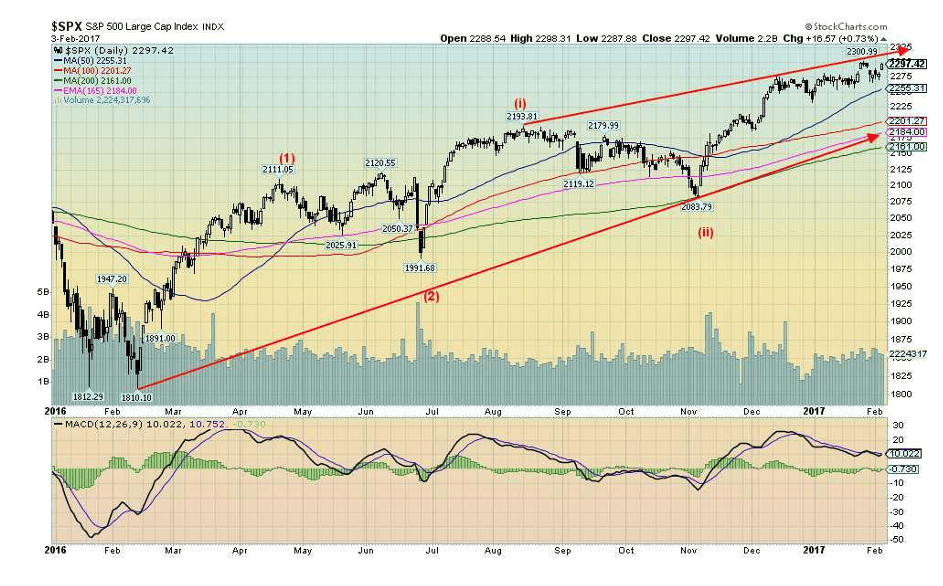
The daily chart of the S&P 500 suggests that following the intermediate low in February 2016 wave one to the upside topped in April 2016 at 2,011, wave two bottomed with the Brexit at 1,991. We now appear to be working on wave three to the upside. We won’t get into the minute count of the current wave but we could be in the late stages of wave three that may not make its final top until April but it could also occur this month in February. Once that is complete a correction should pull the market back down for wave four most likely into May/June but then wave five should or could take us into the summer for the final top. The final wave up could also form a double top with the high of wave three.
Currently, unless the market is able to follow through to the upside and make new highs above 2,301 the top for wave three may already be in. This coming week should tell the tale as the market has to follow through on Friday’s strong up move thanks to the stronger than expected nonfarm payrolls.
A breakdown under 2,230 would tell us a top is in although a breakdown under 2,250 would highly suggest that a top may be in.
(Source)
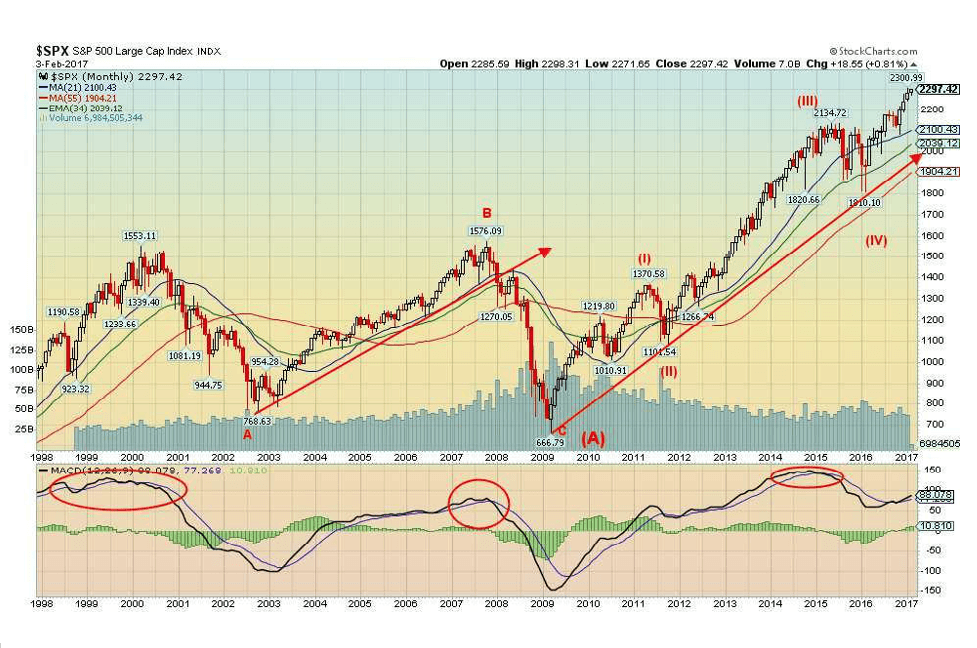
Let’s take another really big step back and look at the even bigger picture. The entire pattern from the major top in 2000 appears as a large ABC. It tells us that the 2008/2009 was quite important. The fact that we appear to be forming a five wave up the pattern from the 2008/2009 financial crisis low suggests that we may indeed be embarking on a new major cycle wave to the upside. However, as we have noted we are late in the cycle for this wave and the final top is not yet determined. But once it completes a significant correction should get underway. Based solely on the current run the Fibonacci retracement levels could be as follows: 38.2% – 1,675, 50% – 1,485, 61.8% – 1,290. Only a major breakdown under 1,050 could suggest a major test of the 2008/2009 low at 667. As to how high we could go the maximum, we see at this time is around 2,500. Certainly, at the recent high of 2,300, the market has achieved at least minimum objectives.
(Source)
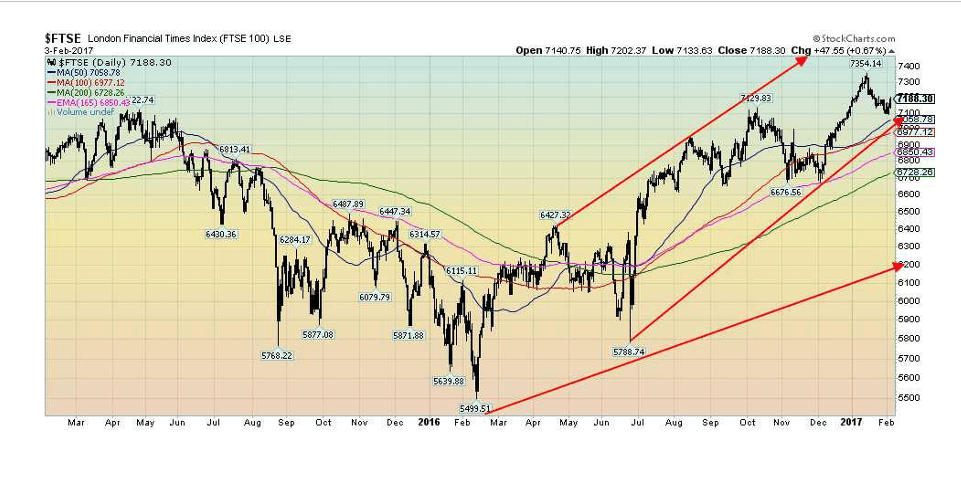
The London FTSE was one of the few indices that eked out a gain this past week. It was less than 0.1%. Other international indices fell. China’s Shanghai Index (SSEC) fell 0.6%, the Paris CAC 40 was down 0.3%, the German DAX was off 1.4% and the Tokyo Nikkei Dow (TKN) fell 2.8% the worst performer of the major indices. Canada’s TSX Composite dropped 0.6% but the TSX Venture Exchange (CDNX) continued its rise up 1.2%.
But note the FTSE is actually off 2.2% from its recent high. Is a top in? A breakdown under 7,100 might suggest that is the case. Otherwise, new highs could still lie ahead.
(Source)
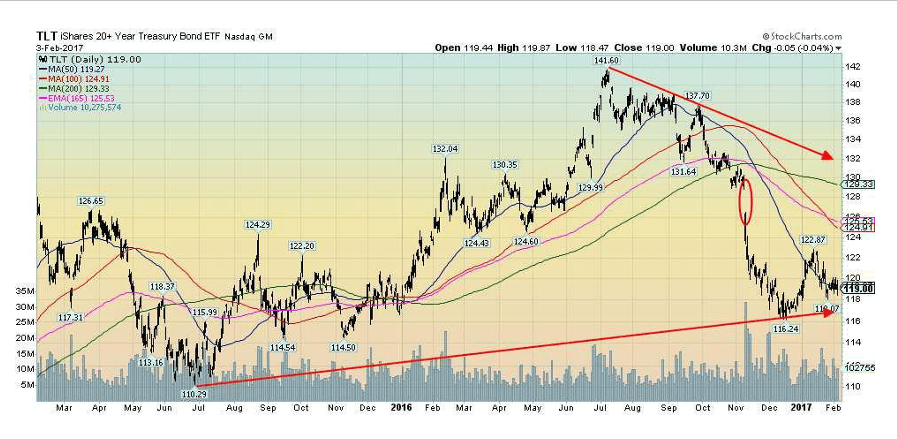
Bond prices as measured by the iShares 20+ Year Treasury Bond ETF (TLT/NYSE) were essentially unchanged this past week. Bond yields (that move inversely to prices) as measured by the 10-year US Treasury Note were unchanged on the week. Here in Canada, the 10-year Benchmark Government of Canada bond yield was down small on the week. The TLT could either be consolidating to make another run to the upside (a base) or it could be a plateau waiting for prices to fall off and move lower. A move over 121 would suggest prices will move higher whereas a fall under 118 would suggest lower prices.
It is noted that yields have been rising globally. The Japanese 10 year Treasury (JGBs) yield is up to 0.116%. It was only back in July 2016 that yields were negative 0.28%. The German 10 year Bund is up to 0.44% a far cry from the negative 0.19% that was also seen last July. After reading numerous stories about negative bond yields one would find it hard now to find negative yields.
At Wednesday’s FOMC meeting the FOMC left monetary policy unchanged. This was not a surprise. If there was a surprise it was that the FOMC was cooler to the idea of economic growth going forward expressing only small confidence in 2nd half 2017 growth. This is a bit of a switch and that helped push stock markets lower, the US$ lower and gold higher. Friday’s unexpected nonfarm payrolls, of course, reversed the drop somewhat. There was no hint of a March interest rate hike. Coming up is Humphrey-Hawkins when Janet Yellen will speak before Congress. That ought to be interesting with you know who tweeting negatives about Janet Yellen from the sidelines.
(Source)
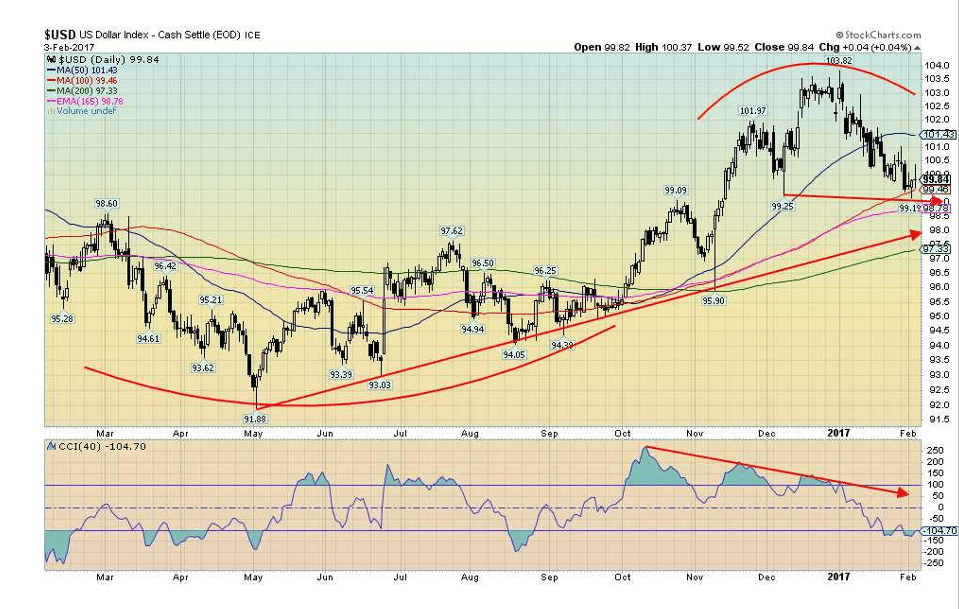
The US$ fell once again this past week maintaining the downtrend that got underway back at the beginning of the year. Since January 3, 2017 the US$ Index has fallen 3.8%. No surprise the Euro is up 4.2% in the same period. The Japanese Yen has gained 5.3% while the Canadian Dollar is up 4%. The British Pound that has come under pressure because of the Brexit has gained 2% in the same period.
So has the US$ topped? At 103.82 the US$ Index has fallen short of our original targets of 106-108. The US$ Index is now at a crossroads. If it is to return towards the recent highs it needs to start rising and soon. Friday’s wide-ranging day suggested that the US$ Index can’t figure out what to do. It rallied on the news of the unexpected higher than expected nonfarm payrolls but pulled back to close largely unchanged. The US$ Index fell into an area of support we have cited in the past. A breakdown under 99 would confirm that a top is in and a move lower is underway with next good support down at 97. If a challenge is to be made to the January 3, 2017 top then a move over 100 and especially over 101 needs to get underway and soon.
My sense is even if we do start another run to the recent highs the best we will do is make a classic double top. The time for a strong US$ appears to be running out. And that would be supported by the President who believes others are currency manipulators and that the US$ is too high. In that respect, he is right to a point as a strong US$ makes US exports more expensive and it does threaten foreign entities that took out issued huge amounts of debt denominated in US$. A strong US$ means what they owe in US$ terms rises as a result of the weakening of their home currency.
(Source)
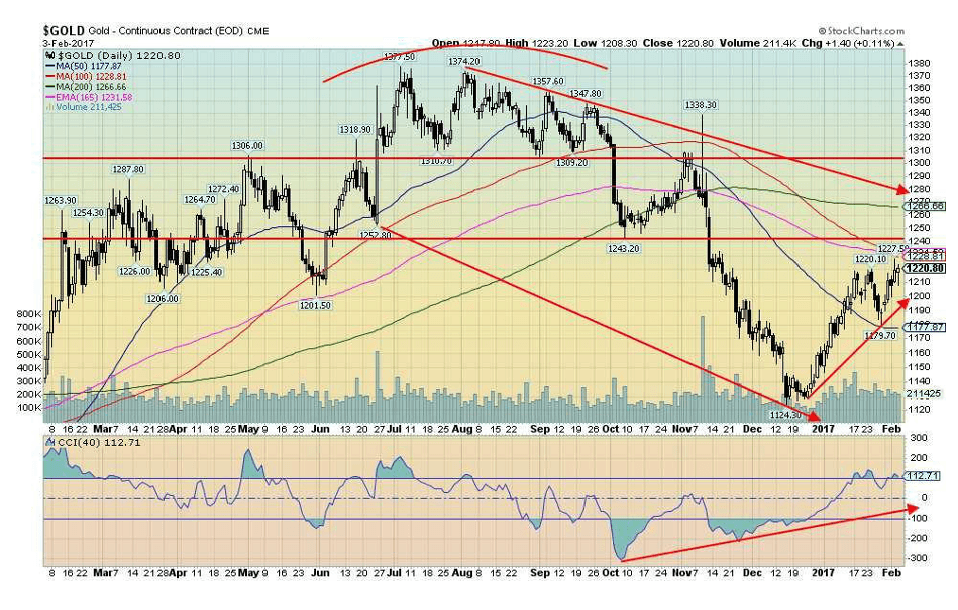
Thanks to a weaker US$ more trade rhetoric from Trump, the Muslim ban and a more dovish FOMC gold rose this past week making new highs for the move up. Gold hit some resistance just under $1,230. There is further resistance up to $1,240/$1,250 but over $1,250 there appears to be a clear path to $1,300. The only question is the recent small correction over? As long as gold holds over $1,200 on any pullback the odds favor higher prices. Even under $1,200, there is good support down to $1,170. Under that level, gold looks more suspect.
But as long as gold remains above $1,200 the alternate to test $1,170 again appears less-probable. Gold is in a sweet spot seasonally with the strength usually lasting at least into late February or even to mid-March. The annual Prospectors and Developers convention (PDAC) takes place early in March and that often signals a high for gold. Weakness then lasts into May/June before another strong rebound begins to take shape. Last year there was a high in March followed by a pullback then another run to higher highs in April before another pullback into May. That low set up a run into the early July 2016 high which turned out to be the high for the year.
The conditions for gold have rarely been better. We believe the recent correction was a set up for a strong run to the upside that could take gold to $1,500 and even back to the 2011 high above $1,900.
(Source)
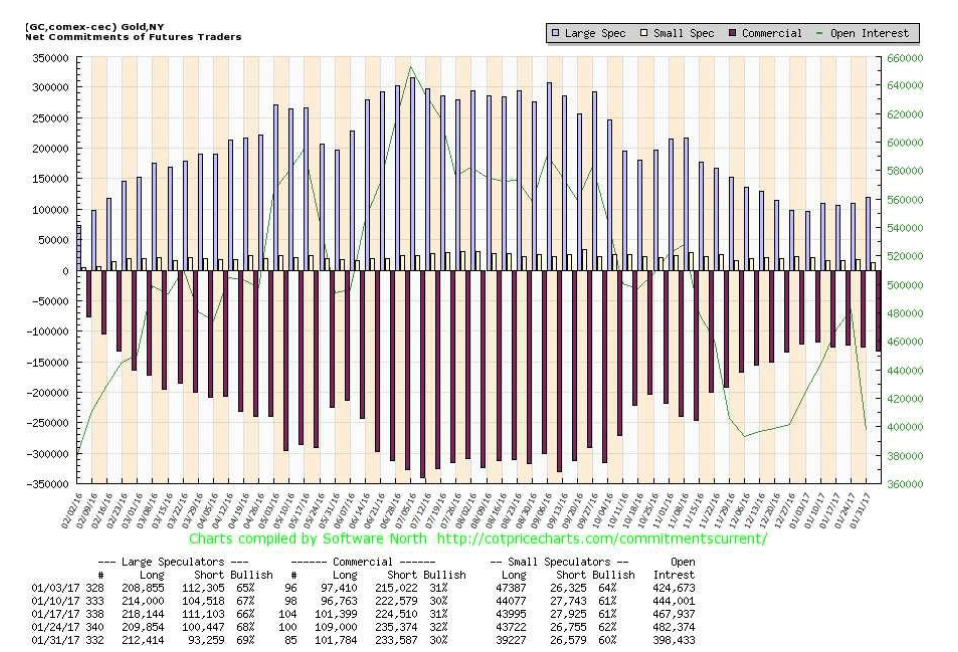
The commercial COT continues to hover in the 30% range slipping this past week to 30% from 32%. Mostly it was because long open interest fell rough 7,000 contracts. The large speculators COT (hedge funds, managed futures etc.) rose slightly to 69% vs. 68%. The large speculators are nowhere near levels that would suggest a top is coming. That usually occurs over 80%. The commercial COT is somewhat neutral here and naturally we would prefer to see it higher if the commercials were really bullish.
(Source)
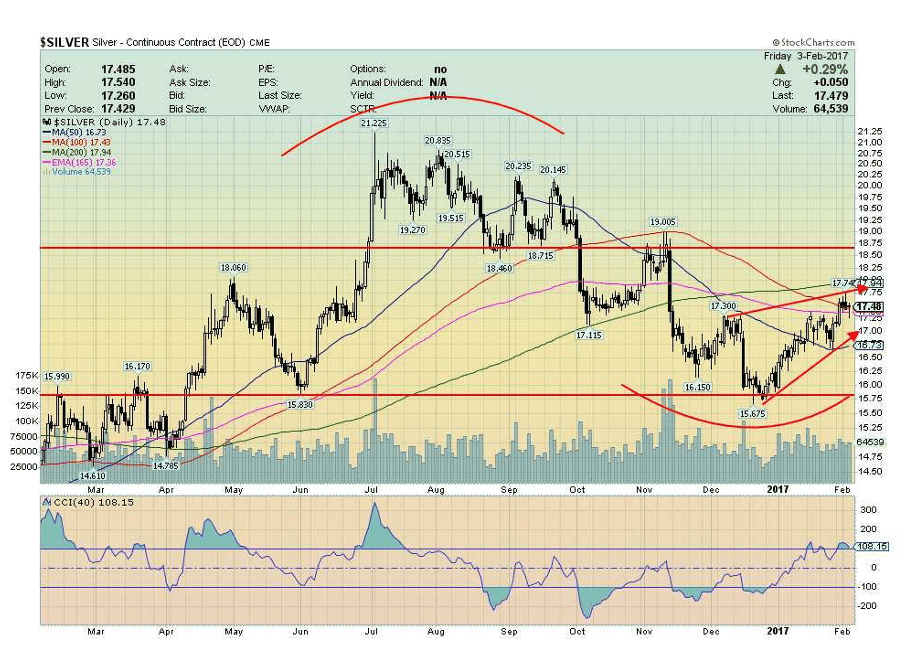
Silver underperformed to some extent this past week but still saw new highs at $17.74. In regaining above $17 silver confirmed the low at $15.68. As long as silver holds above $17 silver looks fine. Further resistance is seen up to $18 but above that level a run to $18.75 and $19 should be underway. Above $19 silver should start a run to the July 2016 high.
GLOSSARY
Trends
Daily – Short-term trend (For swing traders)
Weekly – Intermediate-term trend (For long-term trend followers)
Monthly – Long-term secular trend (For long-term trend followers)
Up – The trend is up. Down – The trend is down
Neutral – Indicators are mostly neutral. A trend change might be in the offing.
Weak – The trend is still up or down but it is weakening. It is also a sign that the trend might change.
Topping – Indicators are suggesting that while the trend remains up there are considerable signs that suggest that the market is topping.
Bottoming – Indicators are suggesting that while the trend is down there are considerable signs that suggest that the market is bottoming.
—
DISCLAIMER: This article expresses my own ideas and opinions. Any information I have shared are from sources that I believe to be reliable and accurate. I did not receive any financial compensation in writing this post, nor do I own any shares in any company I’ve mentioned. I encourage any reader to do their own diligent research first before making any investment decisions.


Youth Cannabis Use in Colorado Is Falling — But the Full Story Is More Complex
The 2026 Colorado survey shows teen cannabis use fell to 10 percent in 2025, down from 21 percent in 2015....


Morocco’s Growth Holds at 4.6% as Agriculture Offsets Economic Pressures
Morocco’s economy grew 4.6% in Q1 2026, driven by a strong agricultural rebound offsetting declines in industry. Services expanded moderately...


Abivax Shares Surge as New Trial Data Eases Safety Concerns Over Ulcerative Colitis Drug
Abivax shares surged nearly 36% after positive updated trial results for its ulcerative colitis drug obefazimod reassured investors following earlier...


El Dorado Raises $9M to Expand Cross-Border Fintech Platform
El Dorado, a Latin American fintech improving cross-border financial services, raised a $9 million Series A led by Paradigm with...


Bitcoin Stalls Near $60K as Strategy Moves, ETFs Outflow, and EU MiCA Rules Take Effect
Bitcoin hovers near $60,000 with ETF outflows, while Strategy boosts reserves, sells BTC, and raises dividends to reassure investors. Ethereum...
 |
|
 |  |
 |
|
-

 Crypto5 days ago
Bitcoin and Ethereum Slide as Market Pressure Builds Amid Strategy Concerns and Layer 2 Disruptions
-

 Business2 weeks ago
Fed Policy Shift Raises Concerns Over Debt and Inflation Risks
-
 Crypto1 day ago
Bitcoin Stalls Near $60K as Strategy Moves, ETFs Outflow, and EU MiCA Rules Take Effect
-

 Biotech1 week ago
Galicia Launches €805M Biotechnology Strategy to Drive Innovation and Competitiveness (2026–2030)
You must be logged in to post a comment Login