Featured
Unemployment: The next big market indicator
I’m always on the lookout for leading indicators that can give us an edge over erratic, irrational markets. There are a lot of them.

Some leading indicators are complicated, like the popular composite index from the Conference Board. It includes average weekly hours by manufacturing workers, initial applications for unemployment, new manufacturing orders for consumer goods, speed of delivery from suppliers to vendors, new orders for capital goods, new residential building permits, S&P 500 stock index, inflation-adjusted money supply (M2), spread between long- and short-term rates, and consumer sentiment.
Yes, complex AND a mouthful!
And not necessarily the best indicator to rely on.
Often, simpler indicators work best
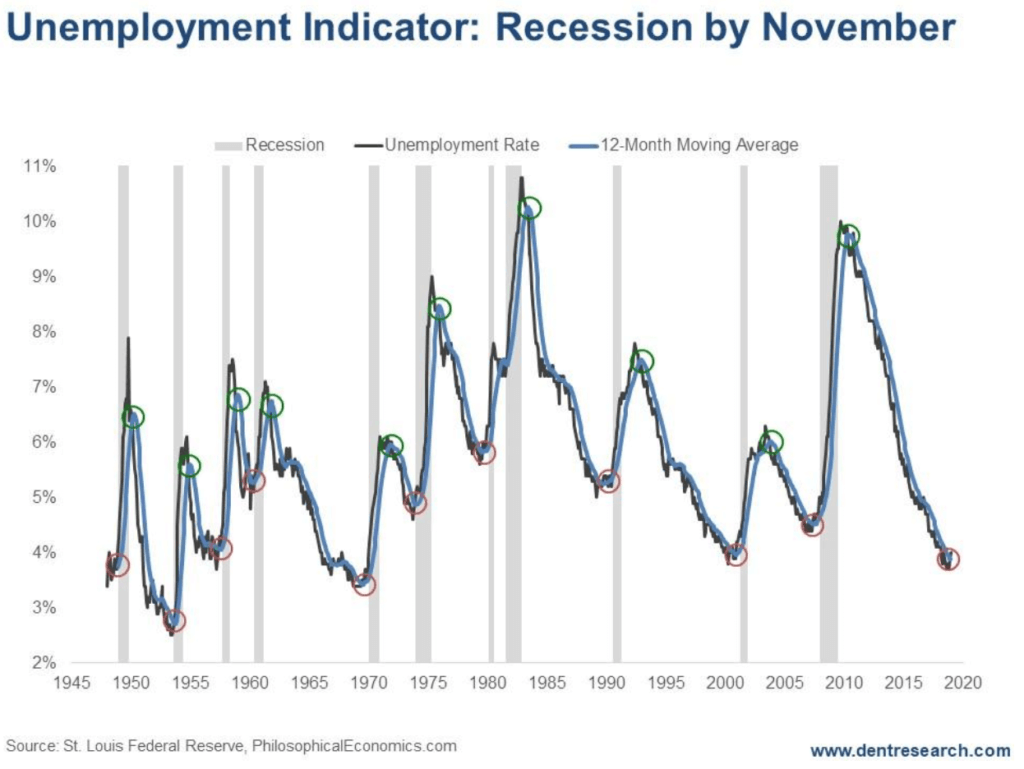
For example, Philosophical Economics found a new one that seems the most accurate: the change in the unemployment rate, when it’s just crossing zero towards negative, is a warning sign.
Or more precisely, when the latest unemployment rate crosses over its simple 12-month moving average — it’s telling.
Here’s the chart:
© Harry Dent
This indicator works at tops AND bottoms, as you can see in the red and green circles on the chart.
Today, we’re focusing on the red circles, which would project a recession in the months ahead.
The lead time for picking the next recession varies between zero and nine months. The average since 2009 has been 3.45 months.
But recent years have tended to be longer
The December 2017 recession onset was preceded nine months by the warning signal from the end of March reported in early April.
We just got a new signal in early February from the January figure. It’s warning that we could see a recession start by November, at the latest — maybe earlier.
That means stocks could peak a little ahead, as they did in 2017, around September, and that is the exact anniversary of the 1929 crash on my Bubble Buster 90-Year Cycle!
All of which is right in line with my Dark Window time table.
There’s also my favorite indicator — the Dow Jones Home Construction Index — that I talk of often. It was the best predictor of the 2007 top and crash, leading the collapse by a whopping 26 months.
Well, it suggests a stock top in very early 2020
So, my range of estimates for the ultimate bubble peak of our era has been September 2017 to March 2020, with January 2020 as the most likely.
But with this new unemployment indicator, September looks more likely to be when we see that market top!
I showed a new reverse head-and-shoulders pattern in stocks in today’s 5 Day Forecast, which would project a modest correction back to 24,000 on the Dow before a surge up to new highs around 30,000 by June. Then a final wave up to follow.
Could our Dark Window blow-off rally see a Dow of as high as 33,000, or a Nasdaq as high as 10,000 by September? Absolutely!
And that will shock everyone, even the strongest bulls.
(Featured image by Sean Pavone via Shutterstock)
—
DISCLAIMER: This article expresses my own ideas and opinions. Any information I have shared are from sources that I believe to be reliable and accurate. I did not receive any financial compensation for writing this post, nor do I own any shares in any company I’ve mentioned. I encourage any reader to do their own diligent research first before making any investment decisions.


Graph Therapeutics Secures $5M to Advance AI-Driven Precision Therapies
Biotechnology company Graph Therapeutics raised 5 million dollars in a funding round led by Daphni, with support from existing investors....


DEA Hearing Signals Historic Turning Point for U.S. Cannabis Policy
The DEA has begun a key hearing on reclassifying cannabis from Schedule I to Schedule III, following a recommendation from...


Italy Leads Europe in Digital Sustainability Reporting for SMEs, EFRAG Finds
Italy leads Europe in digital sustainability reporting tools for SMEs, according to EFRAG’s second mapping of VSME platforms. The ecosystem...


RLUSD Launch in Japan Amid XRP Price Decline and Uncertain Outlook
Ripple and SBI launched the RLUSD stablecoin in Japan after JFSA approval, signaling strong progress in tokenization. However, XRP fell...


Youth Cannabis Use in Colorado Is Falling — But the Full Story Is More Complex
The 2026 Colorado survey shows teen cannabis use fell to 10 percent in 2025, down from 21 percent in 2015....
 |
|
 |  |
 |
|
-

 Crowdfunding1 week ago
Ithaca: Climate Road Trip RPG on Climate Resistance
-

 Fintech6 days ago
PayPal’s Slowdown: From Fintech Leader to Low-Growth Dividend Stock
-

 Impact Investing2 weeks ago
Edison Accelerates Renewable Growth and ESG Impact in 2025
-

 Africa2 days ago
Morocco’s Growth Holds at 4.6% as Agriculture Offsets Economic Pressures