Markets
Upcoming elections in France may decide the fate of Europe, U.S. debt to pass $20 trillion
Anti-globalization, anti-immigrant parties are leading in France (Marine Le Pen) and Netherlands (Geert Wilders). In Germany, Angela Merkel’s party could be in trouble but more from the left rather than the right as is the case in France and Netherlands.

Former Fed Chairman Alan Greenspan touted gold as a primary global currency. Greenspan warned that the Eurozone is not working and with upcoming elections in France, Netherlands, and Germany things could be turned upside down.
Japan and China and others have been shedding US debt even as there was a bump upward in December 2016. It seems that fewer countries are willing to buy US debt. Why would they, given the chaotic political climate, growing deficits (the US deficit should soon pass $20 trillion and, as we have noted, there is the upcoming debt ceiling battle). If the sell-off continues and even deepens it could impact the US’s ability to finance itself, as it has been highly dependent on foreign Treasury purchases. There remains Trump’s infrastructure plan including the “Great Wall,” tax cuts, increased defense spending, and the potential for trade wars—which are all anticipated to increase the debt. But political uncertainty abounds. Why buy US bonds? There are, however, no signs of capital flight which is something many other countries have experienced. But could it happen? Capital flight from the US would be unprecedented. And where would it go? Canada, Japan, and Switzerland might be recipients. That might suggest that the Canadian Dollar, the Japanese Yen, and the Swiss Franc could do well. We’ll have a peek at those currencies later.
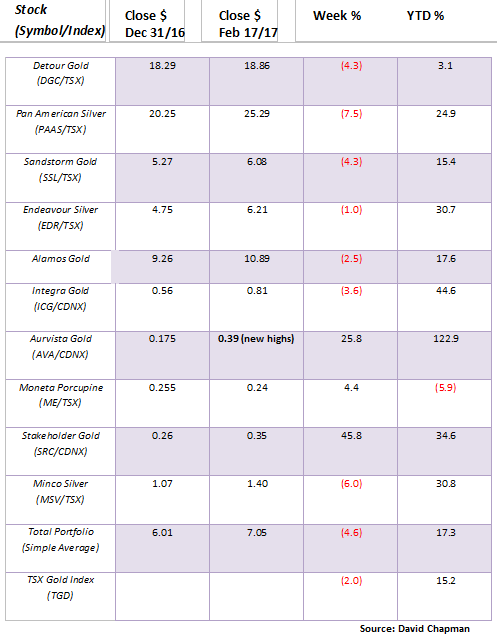
Model Portfolio
It wasn’t a great week for our model portfolio as it lost (simple average) 4.6%. Pan American Silver (PAAS) reported an error in its earnings release and the result was a loss on the week of 7.5%. But two exceptions saved the week. Junior penny gold mining stocks Aurvista Gold (AVA) and Stakeholder Gold (SRC) leaped 25.8% and 45.8% respectively on the week. Aurvista is now up 122.9% in 2017. A star performer.
© David Chapman
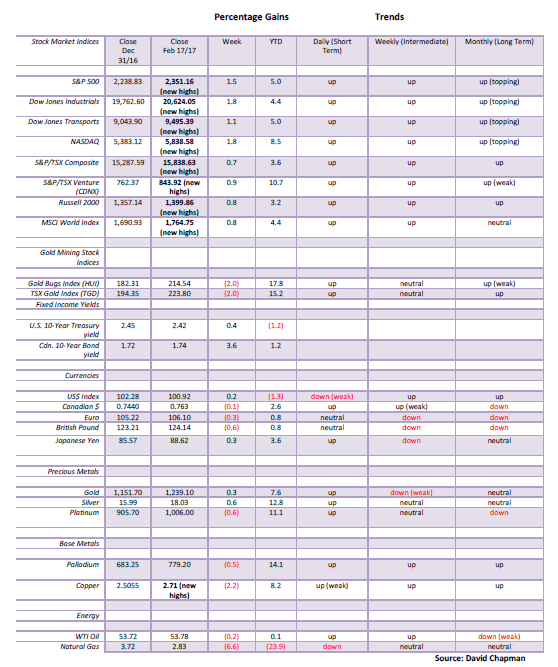
MARKETS AND TRENDS
© David Chapman
Note: for an explanation of the trends, see the glossary at the end of this article Note: New highs refer to new 52-week highs.
Note: New highs refer to new 52-week highs.
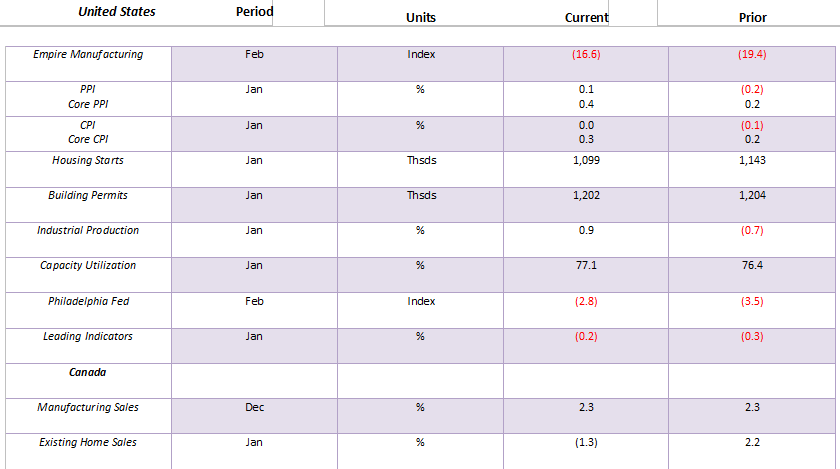
Key Economic Numbers Week February 6-10, 2017
(Source)
(Source: www.shadowstats.com, www.data.bls.gov, www.statcan.gc.ca, www.tdeconomics.com)
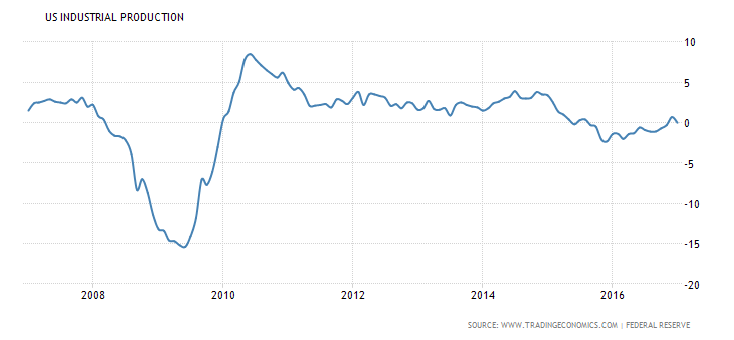
US industrial production was flat year over year in January following an upwardly revised 0.7% increase in December. Before that, however, US industrial production had been consistently in negative territory since 2015. So better numbers have to be viewed positively. And, of course, that weighs on the FOMC as they debate whether to hike interest rates in March 2017.
(Source)
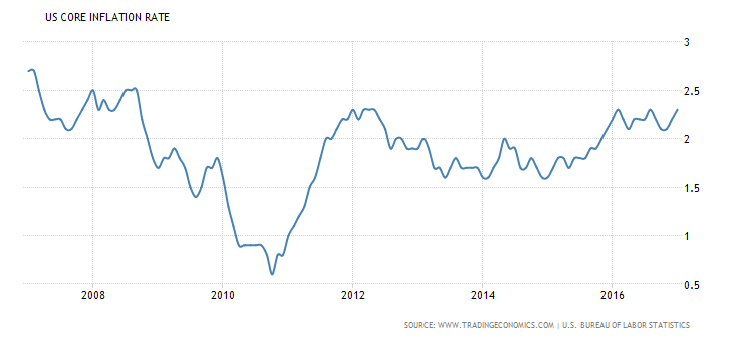
The Fed follows the core inflation rate (shown above) and more specifically the Core PCE (Personal Consumption Expenditures) to determine whether to hike interest rates. The core inflation rate jumped to 2.3% year over year in January. The core PCE rate came in at 1.7% year over year, a level that remains below the Fed’s 2% target rate. Still, at 0.5% to 0.75%, the Fed rate sits well below not only the core inflation rate but below the core PCE rate as well. No wonder the FOMC would like to normalize rates. Current rates remain negative to core inflation and core PCE.
(Source)
Up, up, and away. The stock market just keeps chugging higher. While Trump’s approval rating is only 35%, the business community sees him as golden so the market chugs higher. Indeed, everybody reached new all-time highs this past week. While the Dow Jones Industrials (DJI) was up 1.8%, the Dow Jones Transportations (DJT) gained 1.1%, the S&P 500 1.5%, the NASDAQ up 1.8% and the small cap Russell 2000 jumped 0.8%. Canada joined the party as the S&P TSX Composite was up 0.7% and the TSX Venture Exchange (CDNX) gained 0.9% and is now up 10.7% on the year.
International indices were also positive this past week with the London FTSE gaining 0.6%, the Shanghai Index (SSEC) up by 0.3%, the Paris CAC 40 up by 0.8%, and the German DAX was up by 0.8%. The only loser was the Tokyo Nikkei Dow off 0.7%.
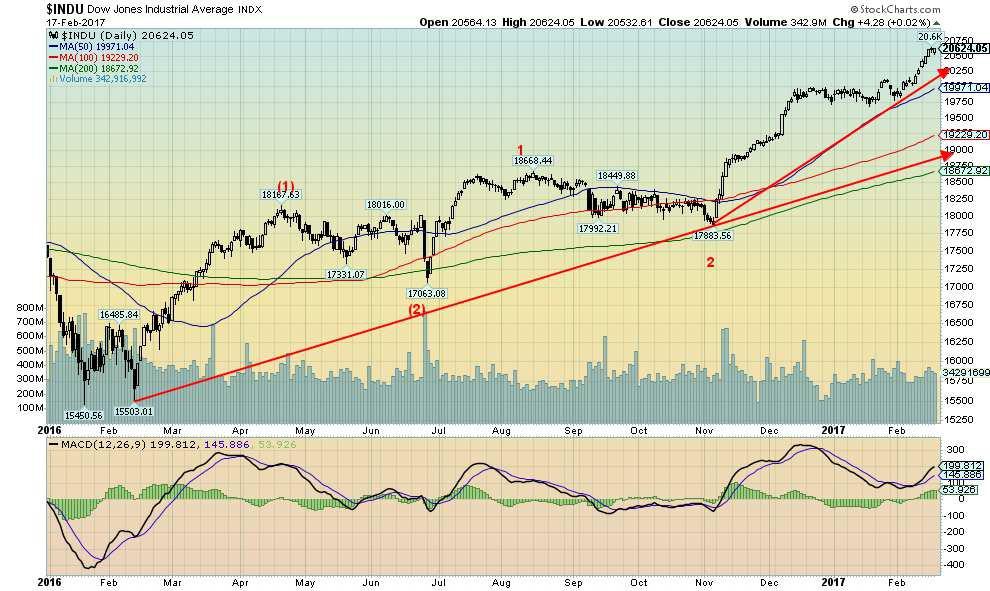
Since the major low in 2009, we have seen what we believe is four distinct waves to the upside. Wave 1 topped in May 2011 while Wave 2 bottomed in October 2011. Wave 3 carried through to the top in May 2015 with Wave 4 bottoming in February 2016. We are currently working on Wave 5, which should be the final wave. From the bottom, in February 2016 wave 1 took us to a top in April 2016 with wave 2 the Brexit low in June 2016. Since then we see two distinct waves up with an August 2016 top and a November 2016 bottom. We are now working on wave 3 to the upside. To come are wave 4 and 5. It is possible the top in December was wave 3 with the low in January wave 4. In that case, we are already on wave 5 which would complete Wave 3 of a higher degree. Following a corrective wave, we could see one more run to new highs that takes us into summer 2017. The current up wave may not as yet be complete with potential targets up to 21,500. Following a correction, we could see the DJI rise as high as 23,000.
We believe a correction should start soon as the most recent sentiment index was at 91% bulls. That is higher than any recent peaks seen over the past year. That, coupled with the fact that so many other indicators are flashing warning signs as well, points to a correction occurring soon. However, we won’t be surprised if this rally continues into March.
(Source)
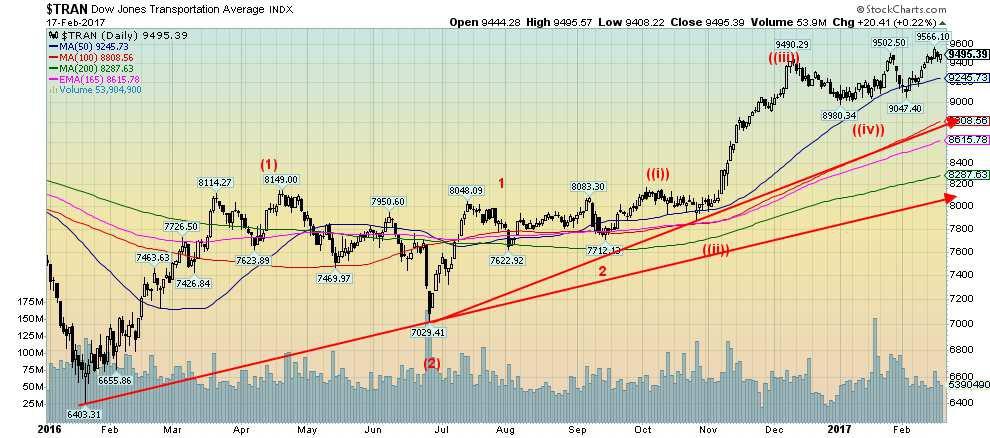
The structure of the Dow Jones Transportations (DJT) is similar to the DJI. The DJI is up 49% from the 2016 lows while the DJI is only up 33%. The DJT made new highs this past week, but barely. The structure seems to suggest that the DJT is already in its 5th wave. A confirmation would come only on a break under 9,000. For the DJI it needs to currently first break under 19,700 to suggest that a top might be in.
Note there are no divergences between the DJI and the DJT. Usually, at major tops and bottoms divergences between the DJI and the DJT develop in that the indices do not confirm each other. With both the DJI and the DJT as well as the S&P 500 and the NASDAQ continuing to make new all-time highs, no divergences have developed.
(Source)
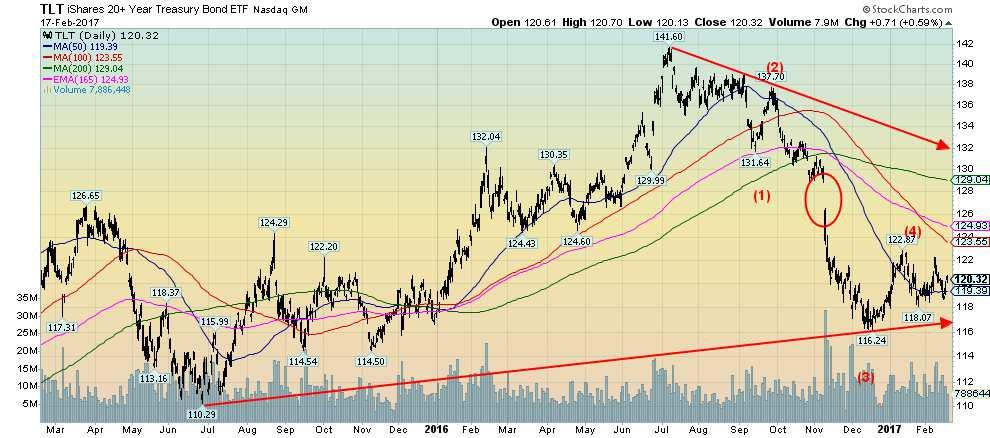
Unless I miss my guess the iShares 20+ year Treasury Bond ETF (TLT) has one more downside wave to complete the decline from the July 2016 top (yields move inversely to prices). Potential targets are for a decline to 109/110. Looking at it the other way, the 10-year US Treasury note could rise to 2.85% to 3.00%. No matter how we look at it the bond market is still in the throes of a decline (price, rise in yields) that should complete a six-year cycle low. Technically the six-year cycle low should not bottom until 2019 given the last one made its bottom in 2013. The six-year cycle has been fairly good since the major bond low in seen in 1981. Subsequent significant lows were seen in 1987, 1994, 2000, 2007, and, of course, 2013. But the range can be five to eight years. So it is possible the low could occur next year in 2018. Nonetheless our expectations are that bond prices have further to go to the downside (yields higher) and it could spend the rest of 2017 before a low is seen. The six-year cycle can break down into two cycles of three years or three cycles of two years. Given there was a low seen in 2015 two years from the 2013 low it is possible that this is just the second two-year cycle and it will bottom this year in 2017. That would set up a rebound into 2018 and then another plunge to the downside into 2019 for the six-year cycle low.
(Source)
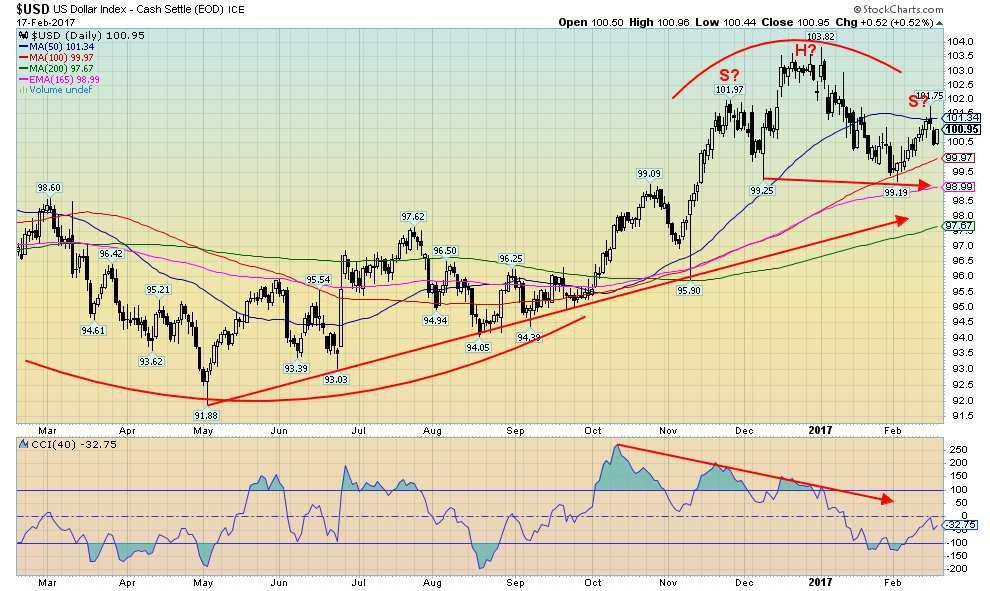
Nothing much has changed with currencies over the past week. Movement seems to come at a snail’s pace. The US$ Index was up a small 0.2% while the Euro was off 0.3%. The Euro makes up some 57% of the US$ Index. The British Pound fell 0.6% while the Cdn$ was off a small 0.1%. The Japanese Yen was the winner on the week gaining a feeble 0.3%. Nothing much has changed for the US$ Index. The US$ Index remains above our breakdown zone of 99. Once under 99 potential targets are down to 94/95. The US$ Index still appears as if it could be making a head and shoulders top pattern. The pattern breaks if the US$ Index were to take out 102 to the upside. Long-time targets of 106-108 remain outstanding, but then an argument could be made that the US$ Index topped out at 103.82 a level which appears to be have been at least a minimum target.
(Source)
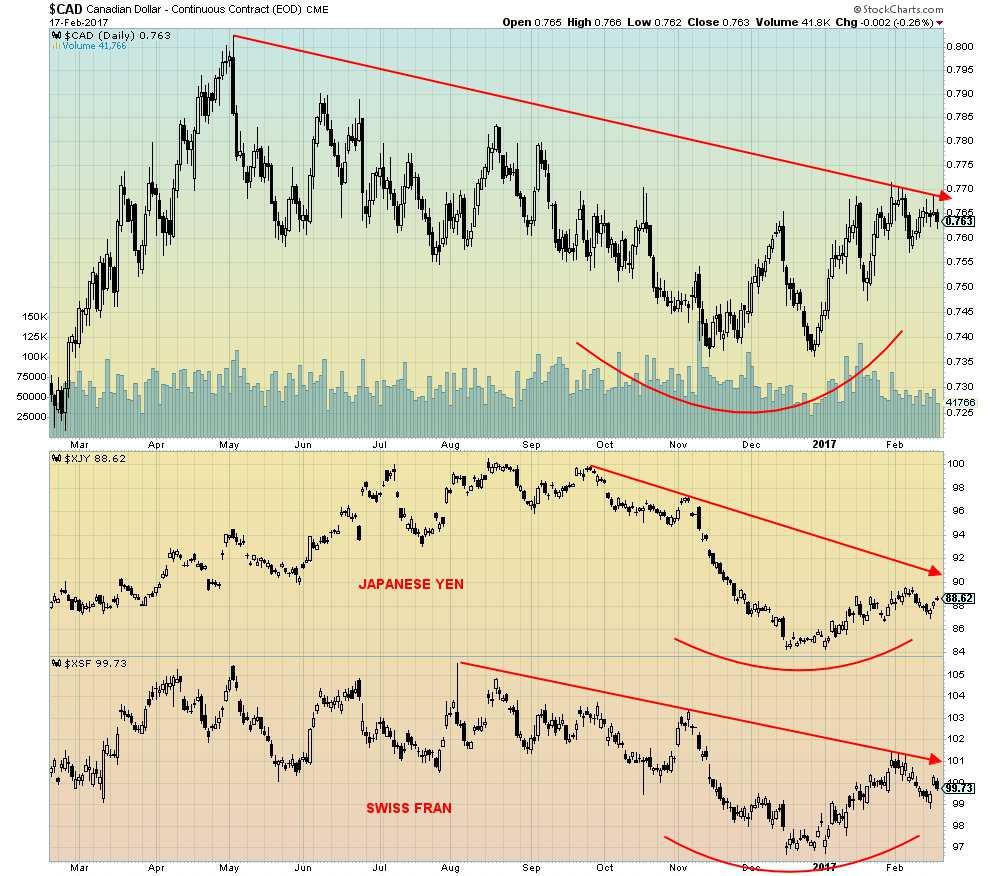
We noted earlier that currencies that could benefit from a flight of capital out of the US could be the Cdn$, the Japanese Yen, and the Swiss Franc. The three of them are represented above. While all three are off their recent bottoms there is nothing definitive here to say that they will advance higher. The Cdn$, in particular, is well of out its lows of early 2016 near 69. The Cdn$ made one strong advance out of the low hitting a high just over 80 before pulling back. Since this wave held above the 69 low with a low of 73.61 odds actually favor that it was secondary low and we are now in the throes of a potential strong advance. Once the Cdn$ breaks above 80 again targets could easily be up to 90.
Similarly, the Japanese Yen made its low at 79.50 back in mid-2015. What followed was a strong advance to 100.46, then the pullback to a recent low of 84.20. It is possible that the Japanese Yen is following a similar pattern to the Cdn$ and once it breaks above 100 again targets could take it to 116. Finally, the Swiss Franc made its low at 96.91 in November 2015. Once again a strong advance followed to 105.50, then a pullback again to a possible double bottom at 96.67 in December 2016. Another advance appears to be underway, but the Swiss Franc needs to take out 103 to suggest that a stronger advance is underway.
Nonetheless, we like all three currencies so it might be a good time to sell US$ and buy Swiss, Yen and the Cdn$. Leave the Euro alone, as the EU remains too susceptible to a breakup. If the Euro were to break up and the countries return to their old currencies the German Mark would be the strongest as it was before the birth of the Euro. Note as well that the Euro along with the British Pound are considerably weaker than the Cdn$, the Swiss Franc, and the Yen. While the latter three appear to be on a nascent rise, the Euro, along with the British Pound, had made new lows and look weaker.
(Source)
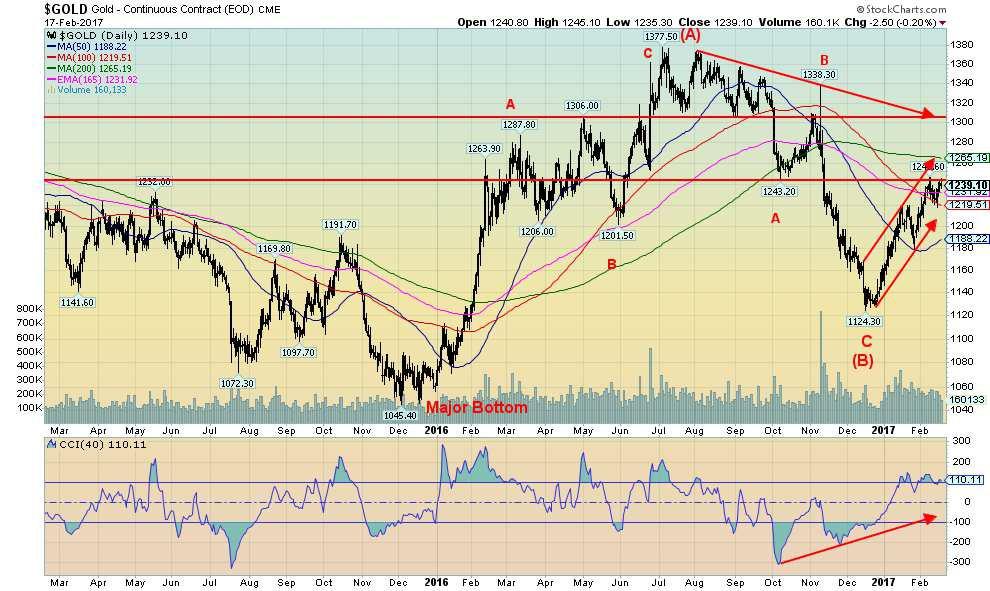
Gold prices are challenging resistance at $1,240 along with further resistance up to the 200-day MA near $1,265. The recent pullback saw support come in around $1,220. Below that there is strong support down to around $1,190. Our expectation here is that gold prices are embarking on a C wave to the upside that should take gold prices to $1,500 area as a minimum and possibly all the way back to the highs of 2011 at $1,900. Sentiment is middling here and indicators are not overbought with considerable room to move higher. Fundamentals are aligning as well with the threat of trade wars, currency wars, and political instability.
It is interesting that when former Fed Chairman Alan Greenspan recently spoke, he touted gold as a primary global currency. Greenspan warned that the Eurozone is not working and with upcoming elections in France, Netherlands, and Germany things could be turned upside down. Anti-globalization, anti-immigrant parties are leading in France (Marine Le Pen) and Netherlands (Geert Wilders). In Germany, Angela Merkel’s party could be in trouble but more from the left rather than the right as is the case in France and Netherlands. Britain is locked into Brexit and the fight continues there with former PM Tony Blair touting a new referendum to overturn the Brexit. Greece is rearing its ugly head again with threats of default and leaving the Euro. Bank runs have started. The Italian banking system remains a mess, threatening the entire Eurozone banking system. None of this can go on.
Greenspan believes that the differences between the strong northern countries and the weaker southern countries are too great. The ECB has been the lender of last resort and its balance sheet is becoming bloated with bad debt from the southern countries. The ECB may have said it will do whatever it takes to preserve the Euro, but it is threatening its own life as a result. Greenspan has noted an uptick in buying of gold in the Eurozone. Greenspan views the buying of gold as insurance. Gold has no liability and is non-correlated to traditional assets such as stocks and bonds.
Gold remains nervous about the Fed hiking interest rates and every time Janet Yellen suggests that the Fed will hike gold falls as the US$ strengthens.But as we noted, while the Euro and the British Pound are not doing well against the US$ the Japanese Yen, the Cdn$ and the Swiss Franc have seen improvement. They appear as safe haven countries against political instability in the EU, Britain, and the US.
Gold has resistance up to $1,265, but above that level, a run to $1,300 should get underway. Further resistance should then be seen up to $1,320 but above that, a challenge to the July 2016 highs of $1,377 will commence. Gold often tops into PDAC seen in the first week of March. Ideally, we would like to see gold challenging $1,300 at that time. Our outlook for gold remains quite positive despite any temporary setbacks.
(Source)
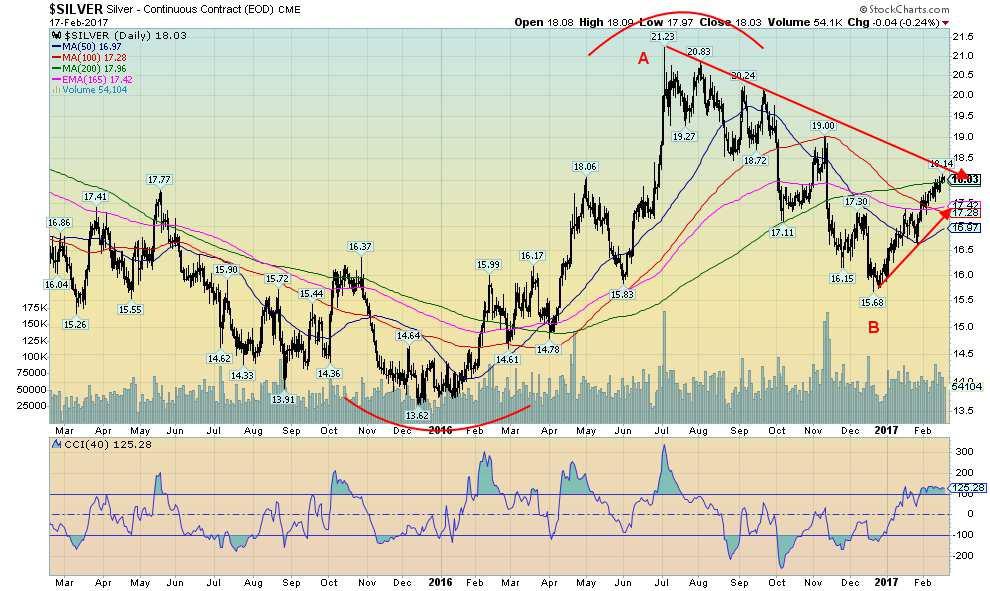
Silver, unlike gold, has closed over its 200 day MA this past week with a close at $18.03. Silver should now start to march up towards $19 as the next target. Ultimately, we believe silver has targets up to $26/$27 and possibly higher. Good support is seen down to $17.50 and below that down to $17. As long as silver remains above $17 the silver bull should move higher. Currently, if there is a further pullback the zone down to $17 should hold. The gold/silver ratio is currently at 68.72 and appears to be targeted lower down to around 55. We continue to see silver outperforming gold going forward.
(Source)
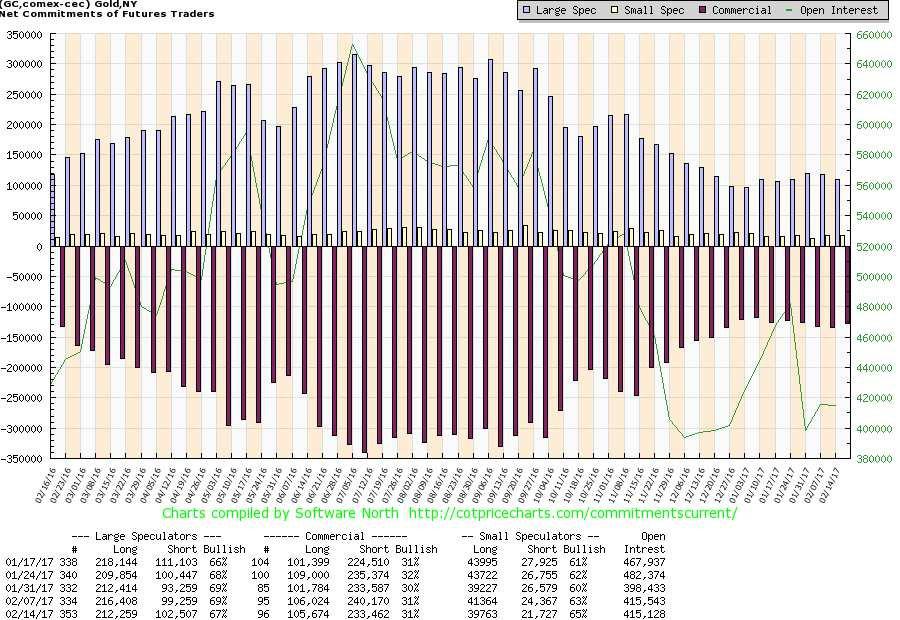
The commercial COT for gold remained steady at 31% this past week even as short open interest fell roughly 7,000 contracts. Long open interest was down only about 500 contracts. The large speculators (hedge funds, managed futures, etc.) still have not gotten involved in a big way as their COT actually fell this past week to 67% from 69%. Long open interest was off about 4,000 contracts while short open interest rose roughly 3,000 contracts. The bearish position of the large speculators COT, coupled with a mildly bullish position of the commercials, suggests to us that gold prices should move higher, not lower.
(Source)
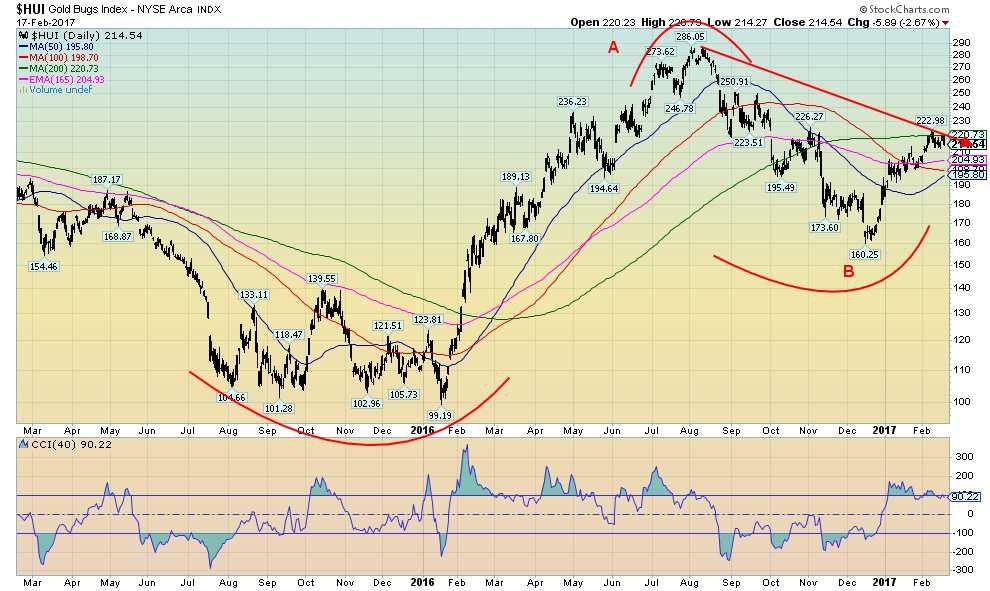
Like gold and silver, the gold stocks represented here by the Gold Bugs Index (HUI) continue to move higher and are tracing out again what appears to be an ABC type pattern. Following a four-year decline from the top in 2011 to the bottom in late 2015 and early 2016, the gold stocks along with gold and silver are embarking on a what appears to be a large corrective wave to the upside. The decline appeared to unfold in a five-wave down pattern. That suggests to us once this corrective rally is finished, a rally should occur that should take the better part of two years at least, and then there will be another sharp down move to complete the pattern. The A wave out took us to 286 a move of some 187 points. The C wave has the potential to take us to at least to the 460 area. If the wave is really powerful we could see a move to 650 and the highs of 2011.
The world’s largest company is Apple (AAPL/NASDAQ) with a market cap of $712 billion. Barrick Gold (ABX) is the largest gold mining company by market cap at $23.5 billion a mere fraction of Apple. All the gold mining companies in the world would be hard pressed to exceed $175 billion in market cap.
Sentiment, as measured by the Gold Miners Bullish Percent Index at 60.7, is nowhere near the highs of 100 seen last July at the top. This is about middle range, suggesting that the gold stocks have considerable room to move higher from here. Other indicators are also suggesting that gold stocks have considerable room to move higher.
The HUI has good support down to 195. Above 230 the HUI could quickly run up to 250 resistance.
(Source)
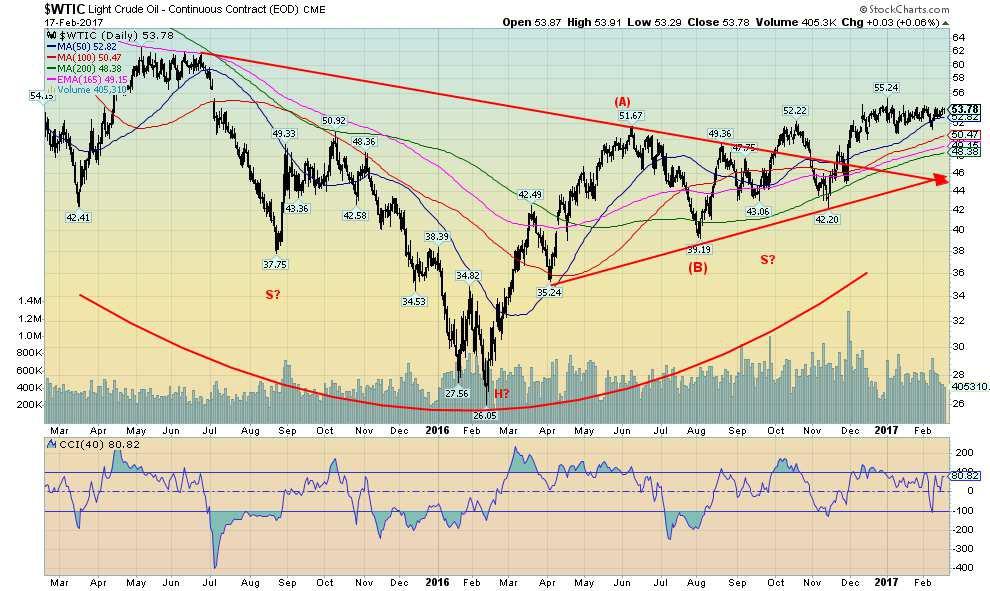
Since breaking out of what appeared to be a large head and shoulders bottom WTI oil has meandered rather than just “taking off.” This is not typical of what appeared to be a bottom H&S pattern. Strong volume never appeared. This suggests to us that when WTI oil embarked on a rally out of the $26.05 low seen in February 2016 it is a corrective rally rather than the start of a new major bull market. The result, we labeled the first wave out to $51.67 as the A wave and the B wave bottomed in August at $39.19. We are currently working on a C wave which could still move higher.
So what is going wrong here? By the time OPEC announced production cuts in December 2016, WTI oil had already rallied well off the $26.05 low. There was an initial pop and then some non-OPEC countries joined the cut later in the month and into January 2017. As we often note for gold we see that the commercial COT was already starting to move into a less bullish position while the large speculators COT (hedge funds, managed futures, etc.) had become quite long with 80% bulls. In other words, the speculative trade in oil was already long. The smart money (commercials) were already beginning to lighten their load and sell into rallies.
In other words, this rally has no “beef.” We see that in the lower volume as well. The H&S pattern looked good but it is going to go nowhere. By the time OPEC announced their cuts WTI oil had already priced it in. It was not quite the old adage “buy on rumor” (OPEC will cut production), “sell on news” (OPEC cut production). But it was close. As well as prices rose US production was rising as well. With Trump in charge, he wants to open the entire country to fracking and other methods to get oil out and cut down on imported oil. WTI oil is probably as a result limited from here. Oil prices might reach into the mid $60s once this current consolidation is complete but that is about it, we believe. Below oil prices break down under $46.
GLOSSARY
Trends
Daily – Short-term trend (For swing traders)
Weekly – Intermediate-term trend (For long-term trend followers)
Monthly – Long-term secular trend (For long-term trend followers)
Up – The trend is up.
Down – The trend is down
Neutral – Indicators are mostly neutral. A trend change might be in the offing.
Weak – The trend is still up or down but it is weakening. It is also a sign that the trend might change.
Topping – Indicators are suggesting that while the trend remains up there are considerable signs that suggest that the market is topping.
Bottoming – Indicators are suggesting that while the trend is down there are considerable signs that suggest that the market is bottoming.
—
DISCLAIMER: This article expresses my own ideas and opinions. Any information I have shared are from sources that I believe to be reliable and accurate. I did not receive any financial compensation in writing this post, nor do I own any shares in any company I’ve mentioned. I encourage any reader to do their own diligent research first before making any investment decisions.


Bitcoin Stalls Near $60K as Strategy Moves, ETFs Outflow, and EU MiCA Rules Take Effect
Bitcoin hovers near $60,000 with ETF outflows, while Strategy boosts reserves, sells BTC, and raises dividends to reassure investors. Ethereum...


Cannabis Dominates Global Drug Use: Trends, Risks, and Shifting Markets
Cannabis remains the world’s most widely used illicit drug, with 256 million users in 2024, surpassing all others combined. Growth...


Italy Approves First Hydrogen-Powered Train for National Rail Network
ANSFISA has approved Italy’s first hydrogen-powered train, the Alstom HMU214, for use on the Brescia–Iseo–Edolo line. Capable of 140 km/h,...


Cotton Market Weakness Persists Despite Brief Rebound
Cotton prices fell to new lows last week before a modest rebound. USDA data shows crop conditions remain worse than...


Eli Lilly Hits $1 Trillion Valuation Amid Strong Bullish Momentum
Eli Lilly stock hit a record high, surpassing $1 trillion market value after strong product demand. Shares surged over 7%,...
 |
|
 |  |
 |
|
-

 Fintech1 week ago
Mollie Expands Across EEA With €350M Investment to Strengthen European Payments Network
-

 Cannabis2 weeks ago
Europe’s Cannabis Shift: Rising Use, and New Risks
-

 Crowdfunding5 days ago
AI Venture Builder Launches €600K Crowdfunding Round to Scale Secure AI Solutions
-

 Impact Investing2 weeks ago
AI Adoption in Italian Retail Stalls Despite Strong Experimentation
You must be logged in to post a comment Login