Featured
Updates on Stock Markets, Bonds, USDX, Gold, and Oil
Markets have hit support/resistance points with the stock markets (S&P 500), gold and gold stocks at resistance and USDX at/near support. Some divergences with both the DJI and silver ahead of the other major indices and gold respectively. This week is the BofC rate meeting (Dec 7) and next week is the FOMC (Dec 13-14). So those meetings may provide some clarity and direction. In both cases a 50 bp rate is expected.

If one wants to get into gloom and doom when it comes to where the world is headed, then one need to look no further than to Dr. Doom’s (or is it Dr. Gloom’s) latest book: MegaThreats: Ten Dangerous Trends That Imperil Our Future, And How to Survive Them, by Nouriel Roubini (2022). Yes, these are our two most famous contemporary Cassandras—Marc Faber, author of the Gloom, Boom, and Doom Report, and Nouriel Roubini, professor of economics at the Stern School of Business, New York University. Okay, some claim it’s not Roubini, but that instead, it’s Peter Schiff, CEO of Euro Pacific Capital. Maybe it’s really a three-headed monster aka Cerberus or Ghidorah. Nonetheless, all three predicted the housing crash, the financial meltdown, and the debt explosion that almost brought down the financial system in 2008. Should we also add Michael Burry of The Big Short fame who is calling for a multi-year U.S. recession? Burry became a legend in predicting and profiting from the collapse of the subprime mortgage market between 2007–2010. A book and film followed.
So, what disaster is Roubini bringing us this time? Roubini, in addition to his turn as a professor of economics, also held senior positions at the White House Council of Economic Advisers, Treasury Department, International Monetary Fund (IMF), Federal Reserve, World Bank, and Bank of Israel, in addition to the professorship at NYU and before that Yale. As pundit William Bernstein wrote, Roubini is writing that we are not just facing the Four Horsemen of the Apocalypse, but instead, we are staring at ten deadly threats: global debt spirals, widespread demographic decay, a worldwide addiction to the monetary heroin of central-bank-driven low-interest rates, a combination of inflation and low growth (stagflation) that will make the 1970s look like a robust economy, the eclipse of the dollar by the yuan, Smoot-Hawley-level vaporization of world trade, the attack of the AI robots, Chinese world domination, and roasting of the planet from climate change that will trigger a wave of deadly pandemics.
Bernstein downplays it in a piece we spotted at Advisor Perspectives (www.advisorperspectives.com). No argument that the world has faced great perils in the past, including deadly wars and devastating plagues that killed millions. But at no time in the past were there 8 billion people on the planet nor were their nuclear weapons, that we are aware of. Well, the dinosaurs weren’t so lucky. Nor were hosts of ancient civilizations that no longer exist like the Mayans of the Yucatan and down into Central America, or the Khmer Empire of Cambodia. Besides, many might be curious to know two civilizations that existed in the present-day U.S. also disappeared: the Anasazi, or ancient Puebla as well as the Cahokia, sometimes called the Mound people or Mississippians. The Anasazi disappeared around 1300 AD but survive through the Hopi and Zuni people in the Southwestern U.S. The Cahokia, who dominated near present-day St. Louis, disappeared around the 15th century. A common theme in the demise of all of these civilizations was environmental degradation along with climate change that caused severe droughts and famine.
Without getting into detail, studies have shown that empires and civilizations last anywhere from 250 to 350 years. Some civilizations lasted over 1,000 years. Great civilizations are not murdered—instead, they take their own lives. That was the conclusion of historian Arnold Toynbee in his 12-volume opus A Study of History. Toynbee studied the rise and fall of 28 different civilizations. Another historian, John B. Sparks, mapped the ebb and flow of global power going back to 2000 B.C. His visualization can be found at Visual Capitalist (https://www.visualcapitalist.com/histomap/). Given the American empire is now about 250 years old, one wonders whether they too will meet the fate of previous empires. We have little doubt that previous powerful civilizations thought they would last forever. Should today be any different?
What causes empires and civilizations to fall? Well, not surprising most fall from within. It was said of the Roman Empire that it fell because of overexpansion, external and internal wars, declining leadership, and most noteworthy, climatic change and environmental degradation. While collapse can take years, sometimes it comes very fast. Past Greatness provides no immunity from collapse. Civilizations rise and fall.
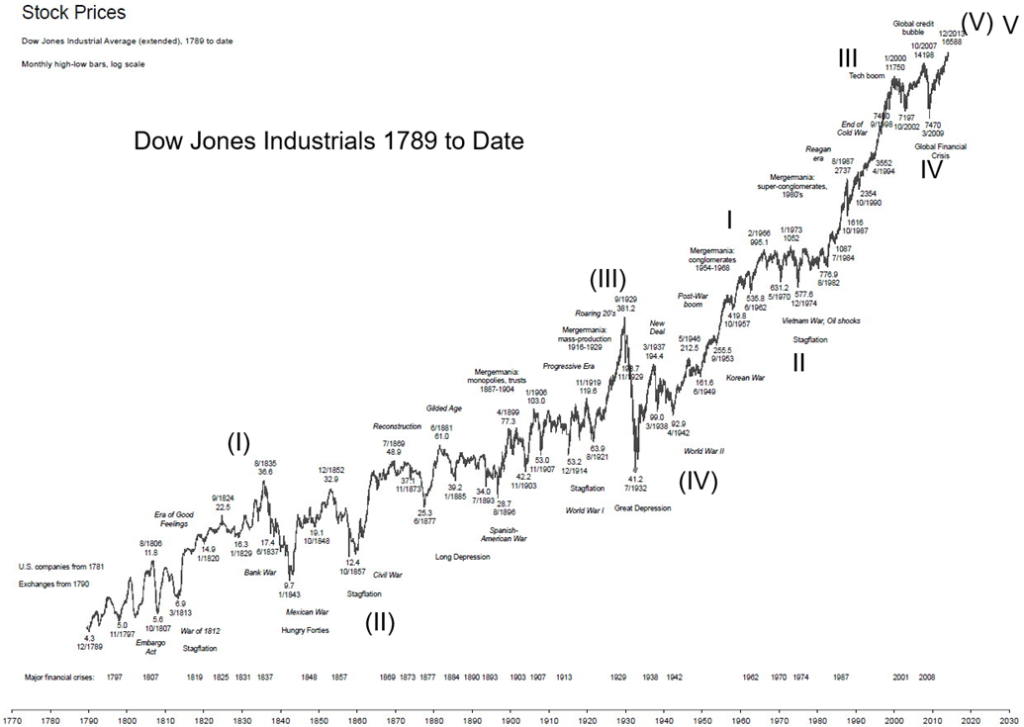
Our intention here is not to predict the downfall of Western civilization. However, Roubini’s MegaThreats do trigger thoughts, whether one wishes to agree with them or not. While we haven’t read the book, the outline had us thinking as to where we are in the bigger scheme of things. One way we looked at it was to take a chart of the Dow Jones Industrials (DJI) and its predecessors going back to the beginning of the U.S. The chart below of the DJI from 1789 to the present (well, almost the present as it hasn’t been updated for the past decade) shows we may be in the process of completing what in Elliott Wave terms is called the “Grand Supercycle.”
The “Grand Supercycle” is the longest wave in, as described by the Elliott Wave principle originally formulated by Ralph Nelson Elliott. Elliott studies were updated by A.J. Frost and P.R. Prechter. Prechter was behind Elliott Wave International (www.elliottwave.com). Long Elliott waves are also sometimes compared to Kondratiev waves whose cycles are 50–60 years. We covered Kondratiev waves earlier.
We applied Elliott waves to the chart of the DJI from 1789 to the present. What we note is it is very possible that we are in the process of completing a “Grand Supercycle” up. Beginning in 1789, we see the first Supercycle wave completing in 1835. What followed was the stock market crash of 1837 and the depression of the 1840s known as the Hungry Forties. The final low of Supercycle wave 2 ended in 1857 before the onset of the U.S. Civil War. That also was the beginning of Supercycle wave 3. That wave topped in 1929 followed by the Great Depression and World War II. That formed Supercycle wave 4. Supercycle wave 5 got underway, we believe, in 1949 with the end of the war and the beginning of the Cold War.
Supercycle wave 5 has unfolded up, we believe, with Cycle wave 1 topping in 1966 followed by Cycle wave 2 bottoming in 1982. Cycle wave 3 topped in 2000 with Cycle wave 4 bottoming in 2009 with the Great Recession. The only question unanswered was, was the top in January 2022 the end of Cycle wave 5? If so, it could also be the end of Supercycle wave 5 and the end of the Grand Supercycle that started in 1789. A long period of recessions and more may well be underway and the DJI could ultimately go lower than it was at the low of March 2009.
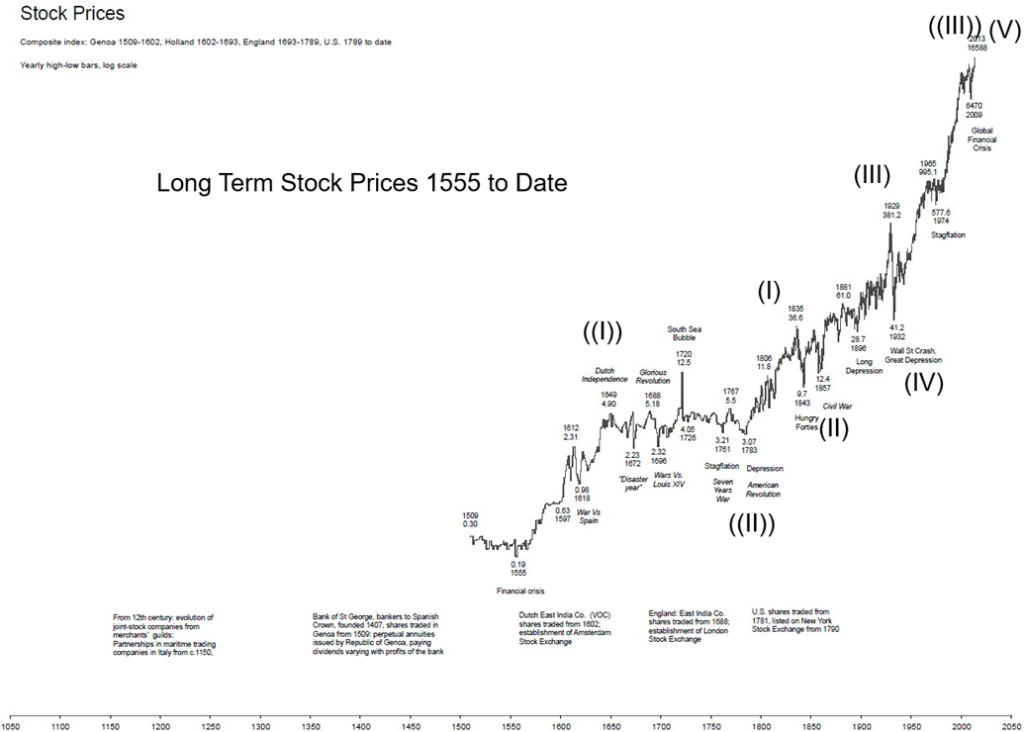
The longest stock chart we have is the one below that starts around 1500. Applying Elliott wave to that chart, we labeled the period 1555 to 1649 or maybe it should be 1720 as Grand Supercycle 1. Grand Supercycle 2 would bottom in 1783 which would coincide with our chart above. If that interpretation is correct, then we are completing Grand Supercycle 3 with Grand Supercycle 4 to come. We may be in the early stages.
How does this fit with Roubini’s MegaThreats? Debt spirals—global debt is estimated in excess of $300 trillion, more than double where it was during the financial crisis of 2008 and the Great Recession. Economic
Collapse is also about debt collapse. History is replete with debt defaults and collapse. Western governments financed their way out of the Great Recession by printing money and issuing trillions of new debt. Led by Japan with a public debt-to-GDP ratio of 290%, all the Western nations are up to their eyeballs in debt. And it’s not just governments. Corporations and consumers joined the debt parade as well and many are overextended. Given a period of rising interest rates, it remains a matter of when, not if a debt crisis could unfold. Add in overextended emerging market debt where numerous sovereign entities are on the verge of default or already in default, and we may have the makings of the mother of all debt crises.
The Western nations are an aging society. Europe and Japan lead the way, but North American countries are not far behind. What that could translate into is a lengthy period of slow growth, stagnation, and stagflation. We have come off a period of ultra-low interest rates where governments of all stripes in the Western nations kept interest rates artificially low and pumped trillions of dollars into the economy (QE) to prevent a collapse. With interest rates rising, the bills are coming due and governments and central banks’ ability to bail out the financial system once again has been severely compromised.
The world is dividing into two warring camps. with the West led by the U.S., the EU, Japan, South Korea, U.K., Australia/New Zealand, and Canada, and the other side led by Russia and China, with North Korea and Iran tagging along. Many other countries, including some such as Pakistan who have nuclear weapons, are leaning towards joining China and Russia to oppose the domination of U.S. global hegemony. When these countries see how Russia was booted from the global institutions such as the global payments system SWIFT, they see their own vulnerability in the U.S. domination of global institutions such as the IMF and the World Bank.
China has been creating alternatives and they are also working on an alternative global payment system to SWIFT, along with their own version of the World Bank and the IMF. All of this is a threat to global domination by the U.S. and the U.S. dollar as the world’s reserve currency. Reserve currencies do not last forever as we have previously shown. Nor will the U.S. dollar. But the changeover is a very dangerous period where the risk of global war now with nuclear weapons is at its highest. Dangerous trade wars and sanctions add to the deterioration of the global economy and a threat to world peace.
The rise of AI and robots threatens to displace millions of workers, creating huge, unequal, two-tiered societies. The dystopian world of the Hunger Games and Blade Runner is not so much science fiction but a potential reality. Previous civilizations collapsed as much from within as they did with wars with other nations. Finally, the world is on life support when it comes to the impact of environmental degradation, extinction of species, and the negative impacts of global warming. Many previous civilizations collapsed, partially as a result of environmental degradation, droughts, and more. However, in the past, the problems were usually contained in one large region, such as the Mayans in Mexico and Central America. Today the issues are global, requiring global solutions. The entire world is at risk.
Yet we remain, for the most part, unprepared for or in denial of what may be coming. But being aware of the possibilities arms us with the knowledge of what may lie ahead and helps us prepare for it.
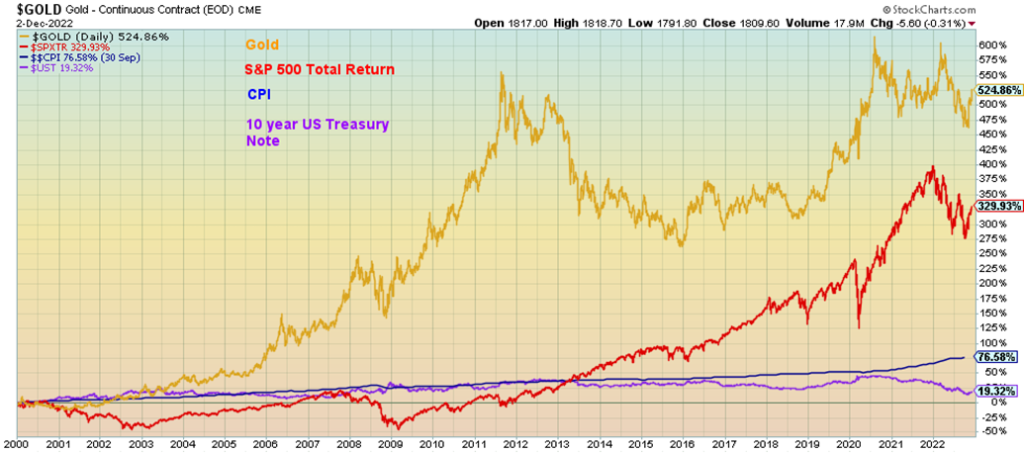
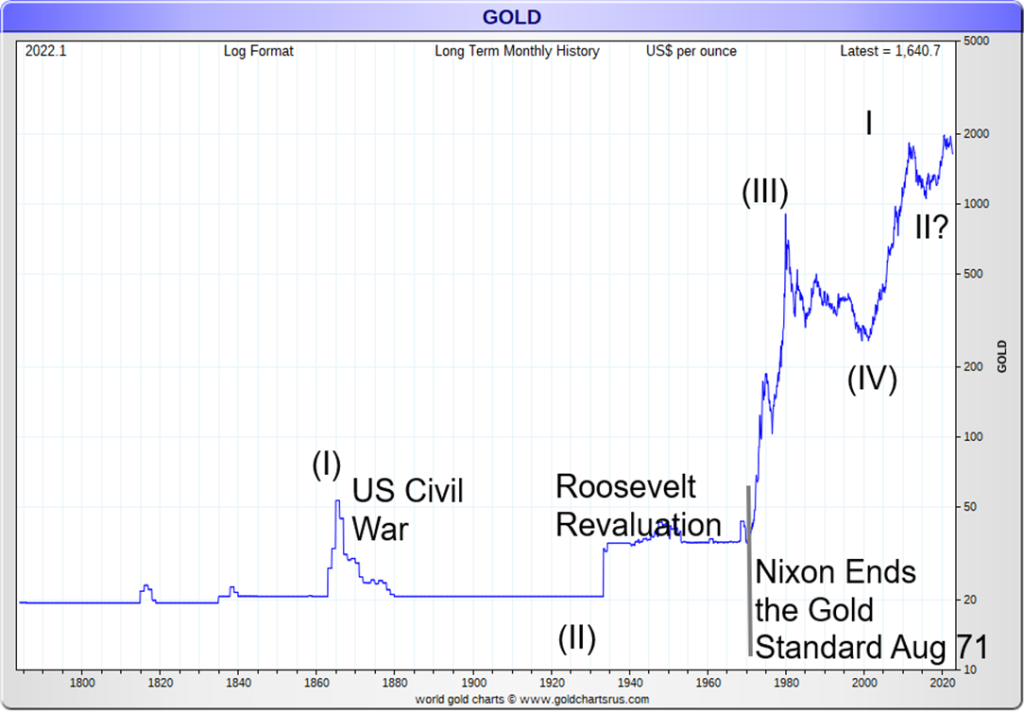
We looked at one more long-term chart to apply Elliott waves to—gold. Below is a chart of gold dating from 1720. Gold has been money for over 3,000 years. Gold has no liability, it cannot be destroyed, it doesn’t corrode or tarnish, it is scarce, it is difficult to extract, and all the gold ever mined remains above ground today. The total amount of gold above ground (estimated at over 200,000 metric tonnes) far exceeds the known reserves (estimated at 50,000 metric tonnes). Yet gold is considered by some to be a barbarous relic of another time. Most see it as just jewelry. But if that is the case, why do central banks still hold gold today? And why are central banks still adding to their gold reserves in record amounts in 2022? Also, why is gold being purchased for investment purposes? Gold is a proven long-term store of wealth and value. Since the world was taken off the gold standard in August 1971, gold has outperformed stocks and bonds. Gold is negatively correlated to both stocks and bonds.
Our long-term chart of gold below suggests that we may be in Supercycle wave 3 to the upside. If that is correct, it has the potential to be a very powerful wave. We may have completed Cycle wave 2 of the larger Supercycle wave 3 with the low in December 2015. If so, we are still in the early stages of wave 3 to the upside. A little gold in your portfolio might go a long way to protecting your wealth in the event of a financial crisis.
300-Year Gold 1720–2022
US Job Numbers
Just to keep everyone on edge and guessing, the nonfarm payrolls came in higher than expected for November, up 263,000. The market had expected only around 200,000. The result saw gold and stocks fall and oil and the US$ Index (USDX) rise. Markets hate surprises, even as they bounced back later. Of course, a surprise on the downside would have seen the opposite result from gold, stocks, etc. But one of the things that make one question these numbers is that the labor force shrunk by 186,000. What? More people are employed but fewer in the labor force. The available labor force or population level as it is called rose by 173,000 while those considered not in the labor force also rose by 359,000. Sometimes it is difficult trying to reconcile these numbers when they seem to be going in opposite directions.
Going back to the pre-pandemic time in February 2020, the nonfarm payrolls are up only 1,044 thousand while the labor force is down by 102,000. Meanwhile, the total labor force or population level is up 5,080 thousand. So, labor force available or population level is up 5 million, nonfarm is up one million, but the civilian labor force fell by one hundred thousand.
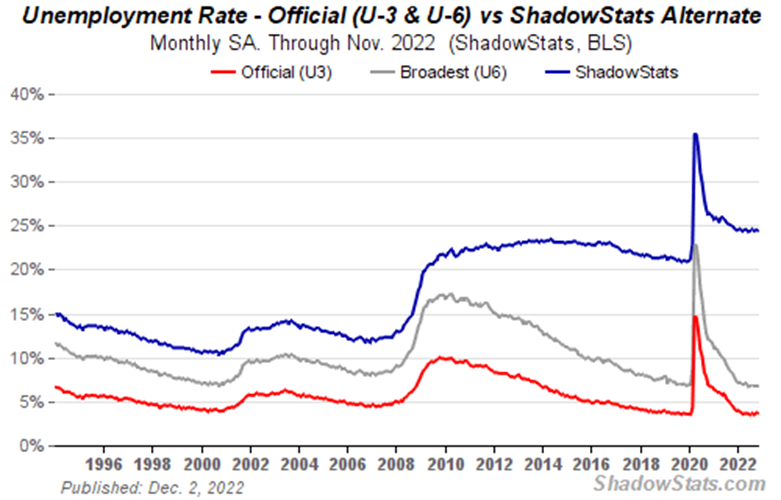
The unemployment rate U3 remained steady at 3.7% and the U6 unemployment rate, which is U3 plus persons marginally attached plus those employed part-time for economic reasons, also slipped to 6.7% from 6.8%. The Shadow Stats (www.shadowstats.com) unemployment number, which is U6 plus discouraged workers defined out of the labor force in 1994 and long-term unemployment over one year also fell to 24.4% from 24.5%. The
Shadow Stats number is higher than it was in February 2020 when it was 21.3% but U3 is roughly the same 3.5% in February 2020 and U6 was 7% in February 2020. Full-time employment was up 92,000 but part-time employment actually fell 302,000. If one can square these with the rise in nonfarm payrolls, we’re listening. The median weeks unemployed rose to 8.4 weeks from 8.1 weeks while the number unemployed 27 weeks or longer rose by 65,000. All numbers are taken from FRED Economic Data (www.stlouisfed.org).
With consumer sentiment dragging along at levels last seen during the recession of the early 1980s, one has to wonder how employment can remain so buoyant. Inflation is still a concern as the average hourly earnings month-over-month rose 0.6% when they expected a rise of only 0.3%, while year-over-year it was up 5.1% vs. an expected 4.6%. None of this is going to have the Fed backing off on hiking interest rates at the December 13–14 FOMC—it’s likely to be at least 50 bp. But will they surprise with another 75 bp hike? They could. After that, expectations are for 25 bp hikes in January and March 2023.
The labor force participation rate was 62.1, down from 62.2 and well down from February 2020 when it was 63.4. The employment-population ratio was 59.9 vs 60.0 and 61.2 back in February 2020. Fewer people participating helps lower the unemployment rate (U3).
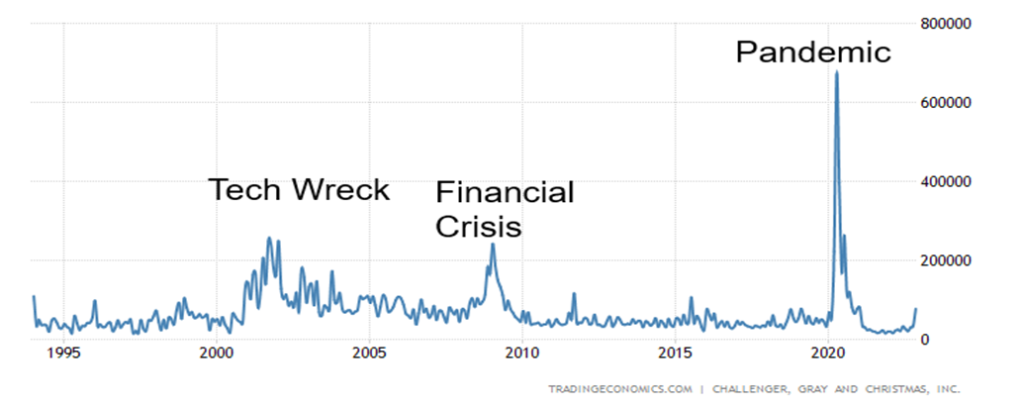
Job cuts are rising mostly in technology industries as a result of rate hikes and more. Our chart below of Challenger job cuts shows that recent rise. Some 76,835 job cuts were announced in November of which the tech sector 52,771 of them. Note the spikes at the time of the dot.com/tech wreck, the financial crisis, and the pandemic. So far, the spike is not that large. But will it rise further?
Challenger Job Cuts 1992-2022
We can’t view these numbers as encouraging and we could still see employment figures start to slide as we go into 2023. However, none of this going to deter further rate hikes.
Canadian Job Numbers
Canada Employed and Unemployed Persons
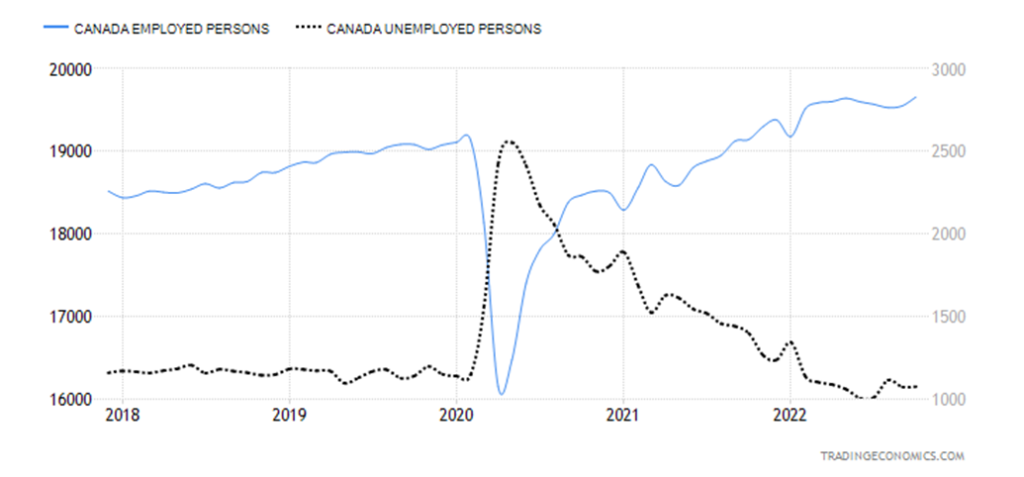
Not to be left out, Canada also reported an employment surprise as the number of jobs created in November rose by 10,100. The market had expected a decline of 20,000 that would offset some of October’s big jump of 108,300. Full-time employment jumped by 50,700 while part-time employment fell by 40,600. Canada, it seems, is still a job machine. We long ago surpassed the levels of February 2020. The unemployment rate fell to 5.1% from 5.4%. Another pleasant surprise. The R8 unemployment rate, which is the highest Statistics Canada (www.statcan.gc.ca) reports, was at 6.4% vs. 6.2%. The R8 rate includes discouraged searchers and involuntary part-timers. Long-term unemployment for those unemployed over 27 weeks remained steady at 174,000.
The labor force participation rate was steady at 64.8. Average hourly wages climbed 5.4% year-over-year, which was down slightly from the previous 5.5% gain. Still, that was above expectations of a 4.8% gain. Inflation is running at 6.9% last.
The Stats Can report can be found here: https://www150.statcan.gc.ca/n1/daily-quotidien/221202/dq221202a-eng.htm.
Given the good numbers, none of this will deter the BofC from hiking rates at least 50bp at its next meeting on December 7.
Markets & Trends
| % Gains (Losses) Trends | ||||||||
| Close Dec 31/21 | Close Dec 2/22 | Week | YTD | Daily (Short Term) | Weekly (Intermediate) | Monthly (Long Term) | ||
| Stock Market Indices | ||||||||
| `S&P 500 | 4,766.18 | 4,071.70 | 1.1% | (14.6)% | up | neutral | neutral | |
| Dow Jones Industrials | 36,333.30 | 34,429.88 | 0.2% | (5.3)% | up | up | up | |
| Dow Jones Transport | 16,478.26 | 14,520.96 | 0.5% | (11.9)% | up | up (weak) | up (weak) | |
| NASDAQ | 15,644.97 | 11,461.50 | 2.1% | (26.7)% | up | down | down (weak) | |
| S&P/TSX Composite | 21,222.84 | 20,485.66 | 0.5% | (3.5)% | up | up (weak) | up | |
| S&P/TSX Venture (CDNX) | 939.18 | 599.20 | 4.1% | (36.2)% | up | down | down | |
| S&P 600 (small) | 1,401.71 | 1,245.36 | 1.1% | (11.2)% | up | up (weak) | up (weak) | |
| MSCI World Index | 2,354.17 | 2,027.64 | 2.4% | (13.9)% | up | up (weak) | down | |
| Bitcoin | 47,907.71 | 16,947.26 | 2.7% | (64.6)% | down | down | down | |
| Gold Mining Stock Indices | ||||||||
| Gold Bugs Index (HUI) | 258.87 | 236.87 | 4.8% | (8.5)% | up | neutral | down | |
| TSX Gold Index (TGD) | 292.16 | 282.68 | 5.0% | (3.2)% | up | neutral | down | |
| % | ||||||||
| U.S. 10-Year Treasury Bond yield | 1.52% | 3.49% | (5.4)% | 129.6% | ||||
| Cdn. 10-Year Bond CGB yield | 1.43% | 2.78% | (5.1% | 94.4% | ||||
| Recession Watch Spreads | ||||||||
| U.S. 2-year 10-year Treasury spread | 0.79% | (0.79)% (new lows) | (1.3)% | (200.0)% | ||||
| Cdn 2-year 10-year CGB spread | 0.48% | (0.98)% (new lows) | (1.0)% | (304.2)% | ||||
| Currencies | ||||||||
| US$ Index | 95.59 | 104.50 | (1.3)% | 9.3% | down | neutral | up | |
| Canadian $ | .7905 | 0.7430 | (0.6)% | (6.0)% | down | down | down | |
| Euro | 113.74 | 105.33 | 1.2% | (7.4)% | up | neutral | down | |
| Swiss Franc | 109.77 | 106.67 | 0.9% | (2.8)% | up | up | down | |
| British Pound | 135.45 | 122.79 | 1.6% | (9.4)% | up | neutral | down | |
| Japanese Yen | 86.85 | 74.45 | 3.6% | (14.3)% | up | neutral | down | |
| Precious Metals | ||||||||
| Gold | 1,828.60 | 1,809.60 | 3.2% | (1.0)% | up | neutral | neutral | |
| Silver | 23.35 | 23.25 | 8.5% | (0.4)% | up | up (weak) | neutral | |
| Platinum | 966.20 | 1,026.6 | 3.9% | 6.3% | up | up | up (weak) | |
| Base Metals | ||||||||
| Palladium | 1,912.10 | 1,901.10 | 4.4% | (0.6)% | down (weak) | down | neutral | |
| Copper | 4.46 | 3.85 | 6.1% | (13.8)% | up | down (weak) | neutral | |
| Energy | ||||||||
| WTI Oil | 75.21 | 79.98 | 4.9% | 6.3% | down | down | up | |
| Nat Gas | 3.73 | 6.28 | (14.3)% | 68.4% | neutral | neutral | up | |
New highs/lows refer to new 52-week highs/lows and, in some cases, all-time highs.
Markets continue to chug higher, but we are running into resistance. Spurred by thoughts of the Fed easing up on interest rate hikes, the S&P 500 gained another 1.1% this past week. However, the Dow Jones Industrials (DJI) was up only a feeble 0.2%. The Dow Jones Transportations (DJT) fared better, up 0.5%. The NASDAQ was best as the FAANG stocks rebounded with a gain of 2.1%. Leading the FAANGs upward was Meta up 10.8%, and Netflix gaining 12.2%, while the Chinese stocks gained because of a possible easing of COVID measures. Baidu gained 21.5% while Alibaba was up 19.3%. The S&P 400 (Mid) was up 0.6% while the S&P 600 (Small) gained 1.1%.
In Canada, the TSX Composite was up 0.5% while the TSX Venture Exchange (CDNX) gained 4.1%. The TSX Industrial sub-index made 52-week highs up 1.8%, while Health Care (THC) was the big winner up 13.3%. Still, five of the sub-indices were down on the week, led by Income Trusts (TCM), off 3.1%. In the EU, the London FTSE gained 0.9%, the Paris CAC 40 was up 0.4%, but the German DAX was off a small 0.1%. In Asia, China’s Shanghai Index (SSEC) was up 1.8% but the Tokyo Nikkei Dow (TKN) faltered, down 1.8%. The MSCI World Index gained 2.4%.
Bitcoin bounced back a bit, up 2.7% and Sam Bankman-Fried of FTX fame told the world he didn’t commit fraud. Hmmm.
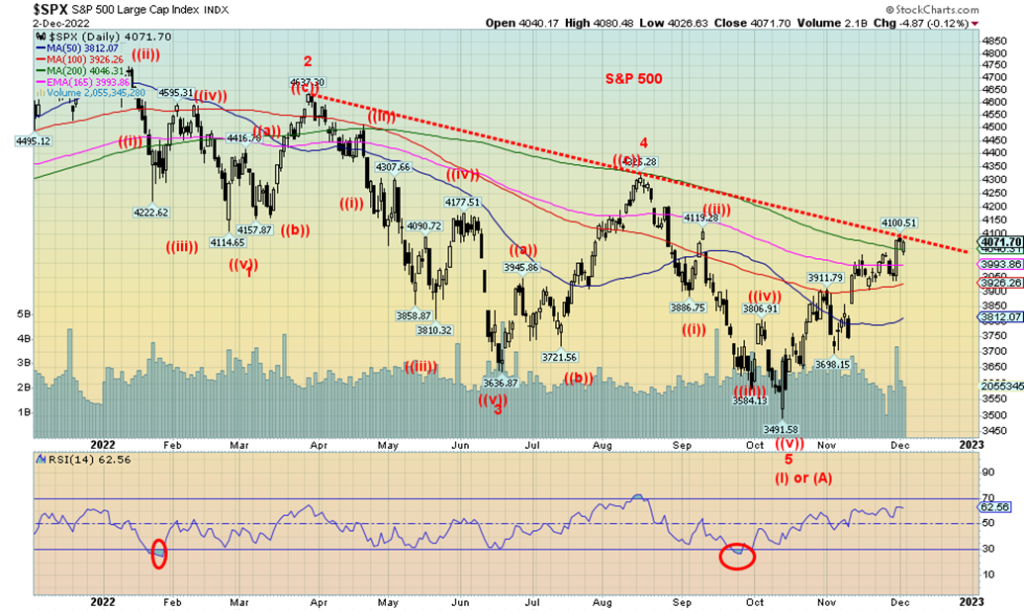
The biggest thing we notice for the major indices this past week is that we are seeing some possible divergences. The DJI has clearly broken out of its downtrend from the January high. But the S&P 500 has not, and it is also bouncing up against its 200-day MA. The DJI is now 6% above its 200-day MA. The DJT is about where the S&P 500 is at trendline resistance and its 200-day MA while the NASDAQ is 5% short of its 200-day MA and the downtrend line from its high. Will the three catch up to the DJI or is this a divergence that is signaling a possible top in the market? We can’t tell yet, but we suspect at least a temporary top. Markets may trade sideways to down awaiting the Fed on December 13–14.
The danger zone for the S&P 500 is for it to fall back under 3,900. If we hold above that level, we are intact to move higher. A break is not a killer, but it could set up a possible decline to 3,800. Under 3,800 the market becomes more concerning. Real danger doesn’t come in until under 3,700 and new lows are highly probable under 3,600. Otherwise, the rally is alive if the S&P 500 breaks above 4,200 with further gains seen above 4,300. If this is an A wave up, then we could be hitting at least a temporary top. Elliott Wave International (www.elliottwave.com) believes this wave is the C wave up. The only way to dispel all of this and keep things alive is for new highs to occur above 4,300.
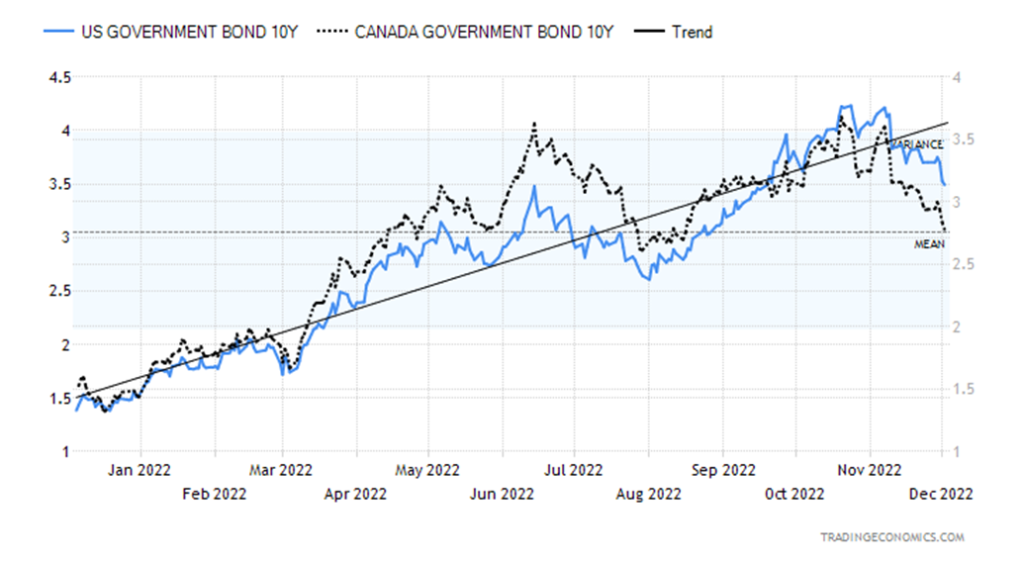
Bond prices are falling! In the U.S., the 10-year U.S. treasury note fell to 3.49% this past week, down from 3.69%. In Canada, the 10-year Government of Canada bond (CGB) dropped to 2.78% from 2.93%. Are we headed for lower yields (higher prices as prices move inversely to yields)? We’d like to think so as fears of a recession continue to set in. Our recession spreads are at levels we’ve not seen since the early 1980s. At that time there was a steep recession from 1980 to 1982 that lingered until 1985. The 2–10 U.S. spread is down to negative 79 bp while the Canadian 2–10 spread has fallen to negative 98 bp. The 3m–10y spread in the U.S. is down (or is up to negative 82 bp) while in Canada the same spread is at negative 131 bp. All are 52-week lows. The 1982 recession was steep with GDP falling 2.7% and unemployment rising to 10.8%. That remained the steepest until the Great Recession of 2009 and the short-lived but steep pandemic recession of 2020. Consumer confidence is at multi-year lows again, closer to what was seen during the early 1980s recession and even below the period of the Great Recession and the pandemic recession. Yet perversely, jobs keep getting filled. But for how much longer? A drop through 3.40% for the U.S. 10-year could send yields down to the next major support zone near 3.10%. Lower yields would be positive for gold.
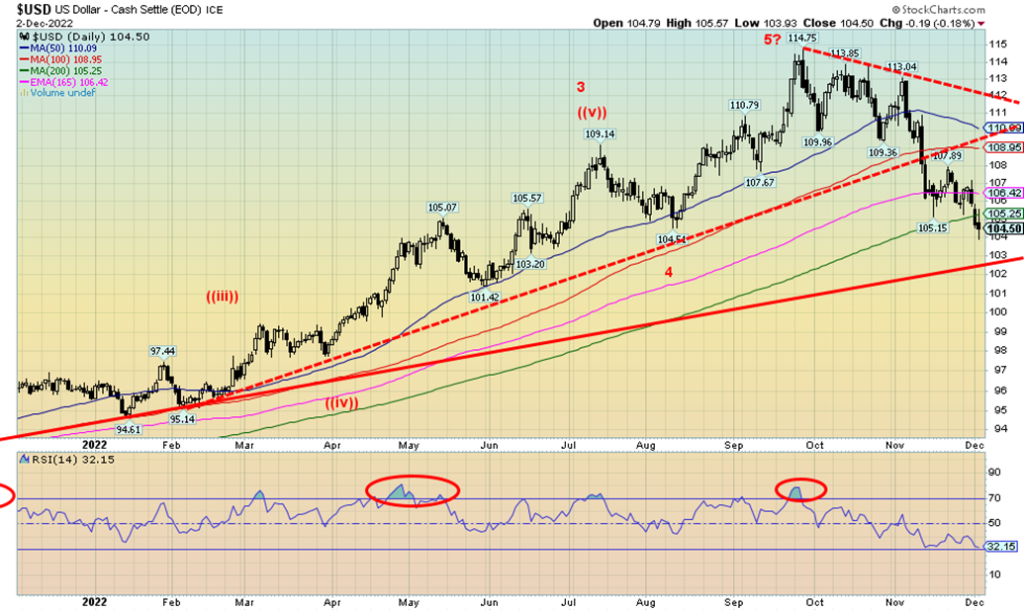
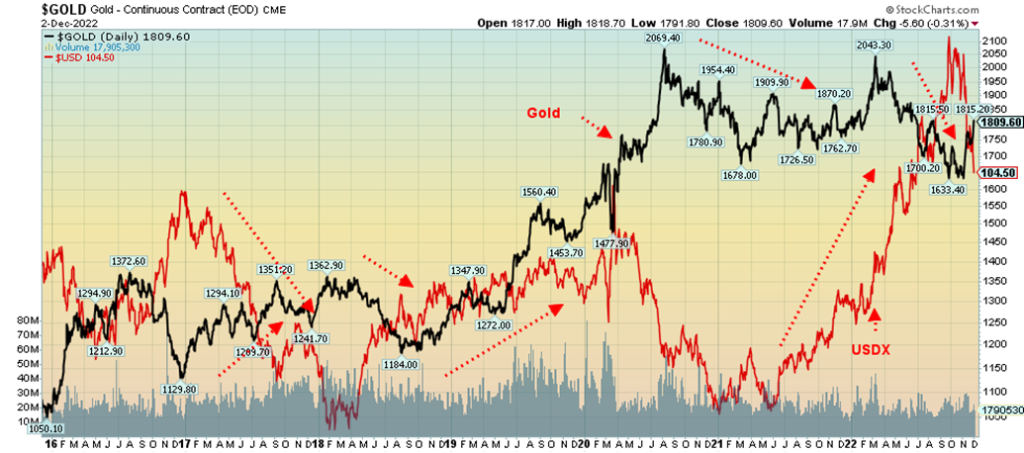
The US$ Index (USDX) has fallen to a crucial support zone near 104/105 with the close this week at 104.50. Major support can be seen below at 103. The result is that we could see a rebound rally for USDX at any time down to 103. With an RSI down to 32, the USDX could soon enter oversold territory under 30. So, we are now cautious on USDX going forward as we know how USDX, and gold tend to move inversely to each other. My colleague Mike Ballanger noted that this week, so here is the chart.
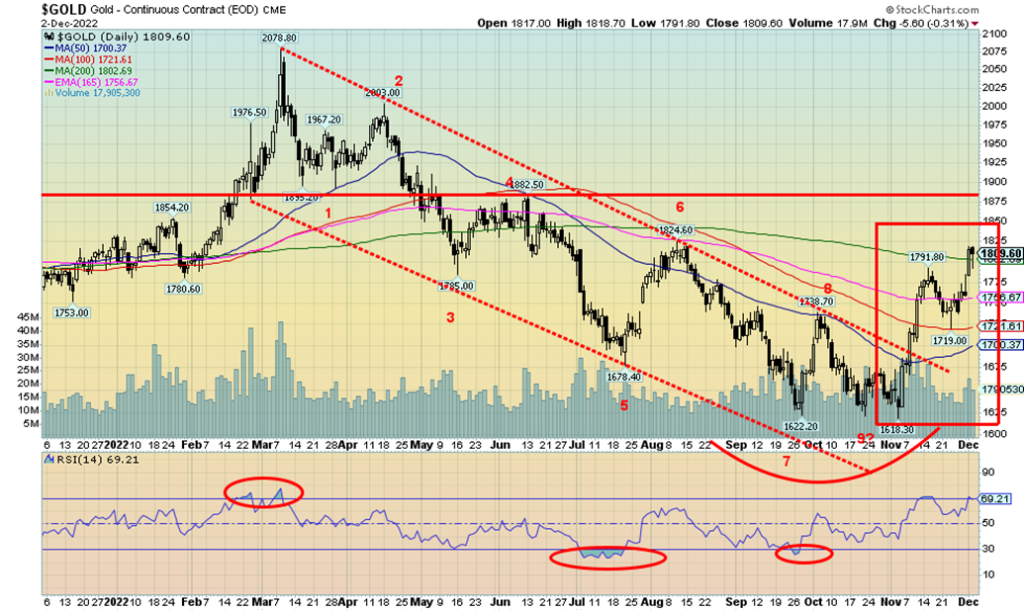
Gold, and particularly silver enjoyed a strong up week, following hints from Powell and the Fed that they may soon ease up on rate hikes. Gold jumped 3.2% on the week while silver enjoyed a stellar week, up 8.5%. Platinum was up 3.9%. The near precious metals also jumped with palladium up 4.4% and copper gaining 6.1%. The gold stocks also enjoyed a good week with the Gold Bugs Index (HUI) gaining 4.8% and the TSX Gold Index (TGD) up 5.0%. All in all, a good week.
But, despite the euphoria of the week, there are also cautionary signs. Gold is into the entire resistance zone of $1,800/$1,875 and at the 200-day MA. Silver has jumped over resistance of $22.50 and is well over its 200-day MA. At this stage, gold is somewhat lagging silver. The two gold stock indices, HUI and TGD, are also testing their 200-DMA. So, in many respects we are now at a or at least in the throes of testing a make-or-break zone. Right now, we are not sure which way we could go. Our preference is that we continue up and take out the $1,875 zone, thus telling us that $1,900 and higher is up next. Support is down to $1,750. If that area holds on any pullback, we should be good. But a break could set up a test of $1,700/$1,720. If that zone were to break, then the odds begin to suggest that we could see new lows. Below $1,660 new lows are highly probable.
The Key is the US$ Index. The US$ Index has sold off, but it is at an important support zone near 104. Ideally, it breaks further but if the US$ Index were to rebound, then the odds favor gold falling. The key could be the December 13–14 FOMC. We could still sell off into that date before resuming the rally. Gold is also becoming
somewhat overextended with the RSI near 70. But that’s just a warning and doesn’t mean we are about to fall. Silver’s RSI is through 70. The gold stocks’ RSI is still below 70, indicating they could have further room to move higher.
One possible encouraging sign is we note that there hasn’t been a big rush of gold into the gold ETFs such the GLD and IAU. Normally a rise brings gold into these ETFs, but so far, while the price is rising the amount of gold held in the ETFs has not been going up. These ETFs issue or redeem shares as the price fluctuates to keep the price near NAV. It is possibly an anomaly and may correct itself going forward. But if the price goes up further, they’ll have to issue shares to keep abreast and that in turn is somewhat bullish.
We are encouraged with the rise for gold and silver, but we are not ready to declare victory until we are firmly through our resistance zone of $1,875. That silver did take out its resistance zone of $22.50 is no victory until gold confirms by also taking its zone out. As well, the gold stocks have more to go to confirm with the HUI’s key resistance at 270 (vs. current 239) and the TGD at 310 (vs. current 282). Silver has support down to $21.40, but below that silver could fall to $20. The HUI support comes in at 220 but below that it falls to 200. And finally, the TGD’s support is down to 260 but under that level the next support is down to 240.
A final piece of encouragement comes with this week’s COT report. The commercial COT (bullion companies and banks) for gold rose to 35% from 34%. It was achieved by a rise of roughly 1,000 long contracts and a fall of about 10,000 short contracts. We continue to have to view that as bullish. Not surprisingly, the large speculators’ COT (hedge funds, managed futures, etc.) fell to 68% from 69% as they shed roughly about 5,000 longs and added 1,000 shorts. The silver commercial COT was steady at 38% as they added roughly 1,000 longs but also added about 2,500 shorts. The large speculators’ silver COT rose to 61% from 60% as they shed about 2,000 longs and about 3,000 shorts.
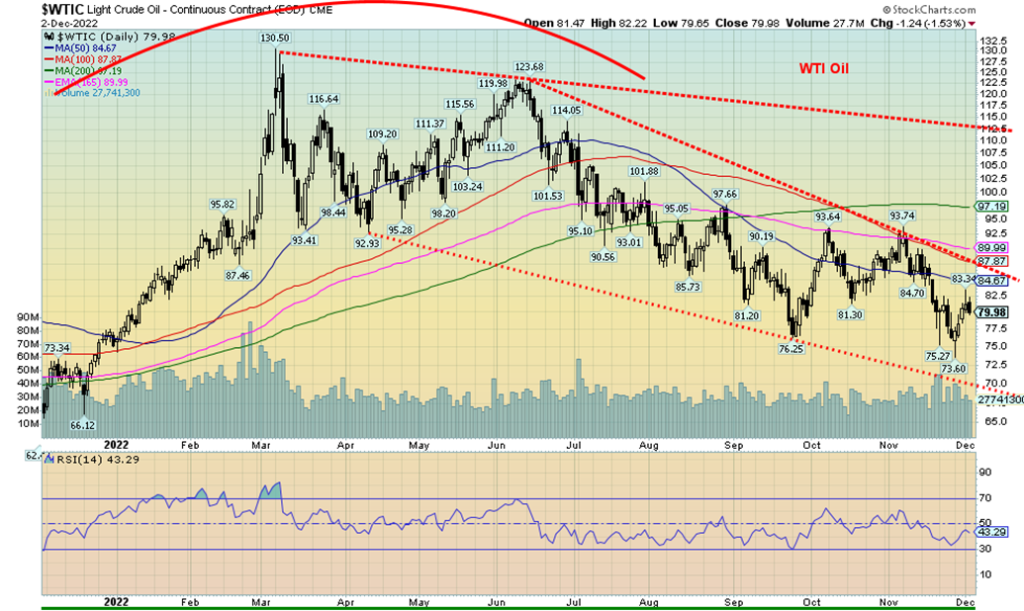
Will China’s easing of COVID controls, thanks to the multitude of protests this past week, offset the price cap on Russian oil? Actually, no one knows how the price cap is really going to work or even how it is going to be enforced. The announced price cap goes into effect on December 5. The price cap is set at $60, well below where oil closed on December 2 at $79.98. Will the price of oil fall toward that level for everyone? Russia has already declared that it will pay no heed to the cap. As well they will not sell oil to any country that is part of the cap cartel. Some countries, including Ukraine, wanted the price even lower at $30, but that could have led to a major withdrawal of Russian oil which would then have the opposite desired effect as oil prices would then soar. There are too many questions surrounding this, including enforcement. Russia is already discounting oil to China and India so in the end it may have little or no impact. OPEC have already stated it is their intention to go ahead with recently announced cuts. OPEC wants the price of oil above $80.
What we did note, as stated earlier here, is that the breakdown of the possible head and shoulders bottom pointed to oil prices to fall to around $69. That currently appears to be the bottom of a bear channel. The question is then, would oil prices fall through that level towards $60? The Saudis want the oil price over $80, so might they and OPEC respond by cutting supplies once again? This begs more questions than answers as the war in Ukraine continues with no sign of talks nor it appears any move to talk.
One thing for sure is that if the price cap results in further withdrawals of oil to help push the price back up again, then it would defeat the purpose and help push the Western economies into a recession. Somehow, they believe that this price cap will be enough to slow the sale of Russian oil without sparking price shocks. Moscow has said it will not supply oil to any participants in the price cap. They also noted that a price cap fundamentally alters the basic principles of functioning free markets. Price caps, like trade wars and sanctions, in the end, do not work, as they distort markets.
On the week, WTI oil rose 4.9% while Brent oil was up 2.2%. Natural gas prices (NG) fell 14.3% this past week, but EU NG at the Dutch Hub went in the opposite direction, up 9.0%. NG in North America fell because of milder weather. It went in the opposite direction in Europe as their supplies are being constrained because of the war in Ukraine. Given all the uncertainty, energy stocks faltered this past week with the ARCA Oil & Gas Index (XOI) off 2.6% and the TSX Energy Index (TEN) down 2.1%. Both remain up over 55% on the year.
As we move into December, we are also moving into the period where the best six months for oil and gas gets underway. While we may plunge further, we could also soon find ourselves in the vicinity of a low.
__
(Featured image by Patrick Weissenberger via Unsplash)
This article may include forward-looking statements. These forward-looking statements generally are identified by the words “believe,” “project,” “estimate,” “become,” “plan,” “will,” and similar expressions. These forward-looking statements involve known and unknown risks as well as uncertainties, including those discussed in the following cautionary statements and elsewhere in this article and on this site. Although the Company may believe that its expectations are based on reasonable assumptions, the actual results that the Company may achieve may differ materially from any forward-looking statements, which reflect the opinions of the management of the Company only as of the date hereof. Additionally, please make sure to read these important disclosures.
Copyright David Chapman
David Chapman is not a registered advisory service and is not an exempt market dealer (EMD) nor a licensed financial advisor. He does not and cannot give individualised market advice. David Chapman has worked in the financial industry for over 40 years including large financial corporations, banks, and investment dealers. The information in this newsletter is intended only for informational and educational purposes. It should not be construed as an offer, a solicitation of an offer or sale of any security. Every effort is made to provide accurate and complete information. However, we cannot guarantee that there will be no errors. We make no claims, promises or guarantees about the accuracy, completeness, or adequacy of the contents of this commentary and expressly disclaim liability for errors and omissions in the contents of this commentary. David Chapman will always use his best efforts to ensure the accuracy and timeliness of all information. The reader assumes all risk when trading in securities and David Chapman advises consulting a licensed professional financial advisor or portfolio manager such as Enriched Investing Incorporated before proceeding with any trade or idea presented in this newsletter. David Chapman may own shares in companies mentioned in this newsletter. Before making an investment, prospective investors should review each security’s offering documents which summarize the objectives, fees, expenses and associated risks. David Chapman shares his ideas and opinions for informational and educational purposes only and expects the reader to perform due diligence before considering a position in any security. That includes consulting with your own licensed professional financial advisor such as Enriched Investing Incorporated. Performance is not guaranteed, values change frequently, and past performance may not be repeated.


Ecobnb Turns Sustainable Tourism Into Measurable Impact
Ecobnb’s sustainable tourism platform generated significant environmental and social impact in 2025, avoiding 58,207 kg of CO₂ and adding 583...


Sugar Markets Balance Biofuel Demand and Global Supply
Sugar markets in New York and London were mostly unchanged as the Iran conflict renewed interest in biofuels. Drought concerns...


The $40 Trillion Trap: Disinflation Is Not Deliverance
U.S. debt has reached $40 trillion, with $24 billion weekly interest, while deficits accelerate. Despite disinflation in CPI, from cooling...


FinTech Matures as AI and Infrastructure Drive the Next Growth Phase
Fintech markets are entering a mature phase, shifting from rapid growth to consolidation, specialization, and sustainable business models. Zurich and...


Bitcoin, and Ethereum Rise, While Cardano Enters Transition
Bitcoin and Ethereum posted modest weekend gains, supported by ETF inflows. A new proposal may protect Bitcoin from quantum threats....
 |
|
 |  |
 |
|
-

 Biotech2 weeks ago
BIP Sells BIC Incubator to Innova, Refocuses on Core Innovation Areas
-
 Impact Investing12 hours ago
Ecobnb Turns Sustainable Tourism Into Measurable Impact
-

 Fintech1 week ago
Robinhood Chain Surges with Rapid Adoption and Billion-Dollar Trading Volume
-

 Cannabis2 weeks ago
Virginia’s Cannabis Journey: A Lesson in Why Legalization Requires More Than a Law