Markets
As the U.S. dollar fell, gold rose and stock markets made all-time highs
And the stock market? Well, it burst out to new all-time highs with the Dow Jones Industrials (DJI), the Dow Jones Transportations (DJT), and the S&P 500. The NASDAQ doesn’t look far behind.

The stock market yawned, and then moved to new highs! We know that is probably not what most people would have expected from the latest revelations of the ongoing saga of President Trump and his family. But that is exactly what happened as the Dow Jones Industrials (DJI) moved to new all-time highs. The revelation was the botched attempt by Donald Trump Jr., the son of President Donald Trump to get dirt on Hillary Clinton by meeting up with a woman described as “the Russian government attorney.”
But as we started out by saying, the markets yawned. Possibly Fed Chairman Janet Yellen has more sway on markets as she has recently described the US economy as “robust” and the economy is healthy enough for the Fed to proceed to raise interest rates further although not that much further, and that the Fed plans to unwind their massive bond portfolio mostly by letting maturities roll off.
If Ms. Yellen has a concern, it is the ongoing low inflation rate. But Ms. Yellen also expressed concern for rising inequality in the US and that in turn makes many Americans think that the system is rigged. As well, she has expressed concern about the unsustainable rate of borrowing (a responsibility of Congress and the Treasury as the US’s national debt stands at $19.9 trillion). Surprisingly she is not overly concerned about the high number of people “not in the labor force.” Ms. Yellen would like to keep the Fed out of politics, but politics are knocking on both the Fed’s and Ms. Yellen’s door. Ms. Yellen’s term ends in February 2018 and the whispers are that Gary Cohn, a former Goldman Sachs investment banker who currently heads Trump’s National Economic Council could be in line for the job.
The Trump administration may be digging itself deeper but the market still appears to pay more attention to what the Fed is saying. As well, troubles in Washington mean little gets done and in some respects markets like that. But, if the troubles in Washington make a turn for the worse then the markets may react negatively. At least that is what many are expecting. But then expectations often have a way of being dashed.
MARKETS AND TRENDS
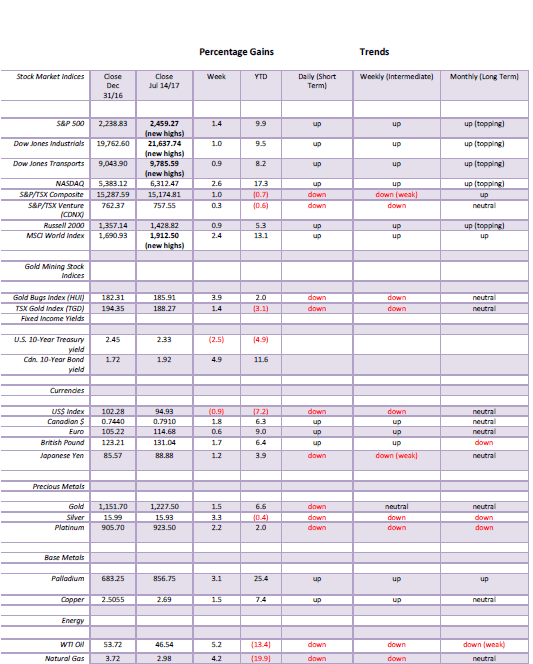
© David Chapman
Note: For an explanation of the trends, see the glossary at the end of this article.
New highs refer to new 52-week highs.
(Source)
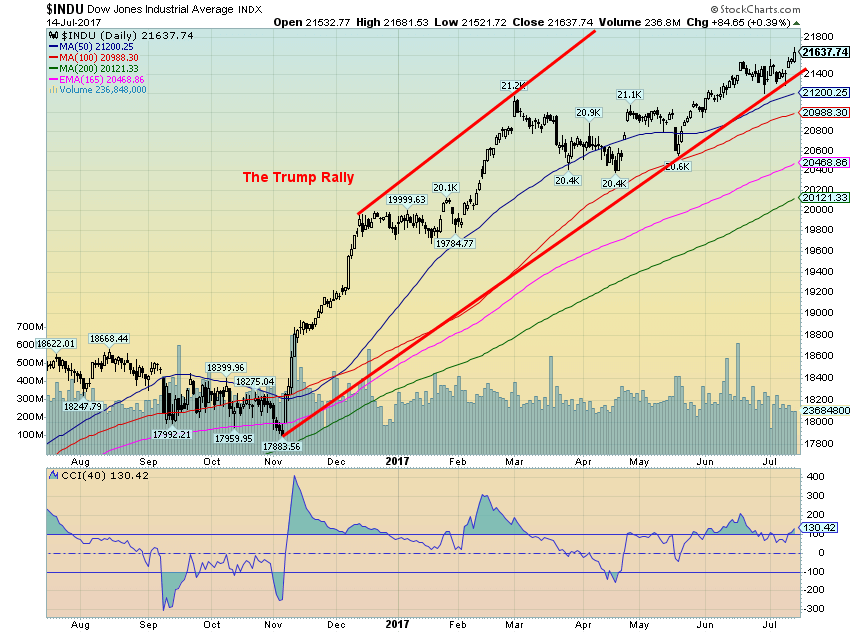
Let’s just call it the Trump rally. The rally started with the election low and it continues today. Oh, there were pauses in December and again in March/April but we are now up about 21% from the election low. Not bad. The rally has come despite the lies and the controversies that swirl around the President. It doesn’t even seem to matter that very little has actually been accomplished. As we noted, the President may be fulfilling his election promises but it’s Congress, the Senate, the Courts, even State governors, and individual states that are blocking his agenda or preventing it from moving forward. Meanwhile, battles rage on the streets of America between those who support Trump and those opposed to his agenda. Maybe the stock market likes to be surrounded by chaos.
This week brought us the revelation of the emails and the meeting between Donald Trump Jr. and his entourage with a Russian lawyer and an agent. It revealed there were meetings with the Russians despite previous constant denials by both the President and his son. Is this the smoking gun? We don’t know. But the investigation will now most likely intensify and is unlikely to go away anytime soon.
Some have likened this to the day the Watergate burglars were caught on June 18, 1972 setting in motion Watergate and leading to the filing of impeachment papers against former President Richard Nixon. Nixon finally resigned in August 1974 rather than face certain impeachment. So maybe it’s not surprising that impeachment papers were filed this week against President Trump marking the third time since 1970 that impeachment papers have been filed against a sitting President.
And the stock market? Well, it burst out to new all-time highs with the Dow Jones Industrials (DJI), the Dow Jones Transportations (DJT), and the S&P 500. The NASDAQ doesn’t look far behind. As we noted earlier after the Watergate burglars were caught the US stock market continued to rise eventually topping out in January 1973. It was the famous “Nifty Fifty” rally. So what will lead this one higher? Well, it has been the FANGs that have taken the market higher and most likely they should continue to lead the way (FANGs – Facebook, Apple, Netflix, and Google). We also suspect banks will perform well as rising interest rates are at least initially positive for banks (helps increase their net interest margin).
Cycles are also playing a role. We have noted that the August 2015/February 2016 low was most likely an example of the both the 4-year cycle low (the previous one in 2011) and the 6.5-year cycle low (the previous one in 2009). As a result, we remain in the up portion of the current 4-year and 6.5-year cycle with the next 4-year cycle low not due until 2018–2020. The next 6.5-year cycle low is due 2020–2023. We are, however, into the mid-point of the 4-year cycle and approaching the mid-point of the 6.5-year cycle. Markets can either left translate, meaning they top in the first third of the cycle, centered meaning they top out half way through or right translate, meaning they top in the latter third of the cycle. We suspect the latter is in play.
We won’t try and do the wave count which by our own admission is complex. But in the bigger picture from the 2009 low we have deduced that wave 2 down was the 2011 low and wave 4 down was the 2015/2016 low. We know we are on the fifth and final wave to the upside. It is also becoming clear that the wave up from the November election is an important one and may indeed be the third wave up that still hasn’t ended. We have noted before, after eight years of a bull market, these types of markets have a tendency to end with a bang rather than a whimper. The ride may just be starting. Fasten your seatbelts.
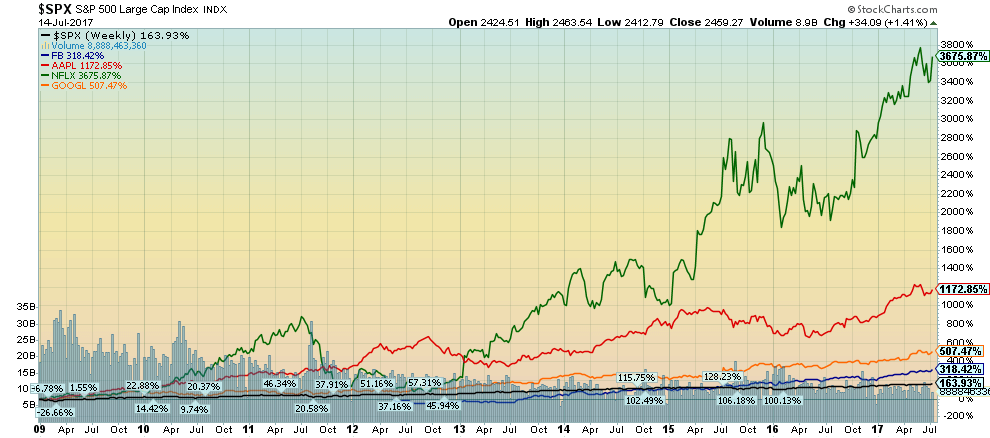
(Source)
Here they are: the FANGs or as some call them “the Generals.” Since 2009 Netflix (NFLX) has led the way with a gain of 3,675%, Apple (AAPL) is up 1,173%, Google (Alphabet) (GOOGL) has gained 507%, and Facebook (FB) is the laggard with a gain of 318%. The S&P 500 is up about 164% in the same period. For the record, gold is up only 40%. The story shifts somewhat going back to 2000. The S&P 500 is up only 67%, an unimpressive performance. But NFLX is up 13,215%, AAPL is up 4,394%, GOOGL has gained 1,702%, and FB is again the laggard, up 318%. At least gold has kept pace outperforming the S&P 500 and equalling FB with a gain of 324%. Arguably, there is little here to suggest that the FANGs are about to top. They should continue to lead the way dragging everyone else with them.
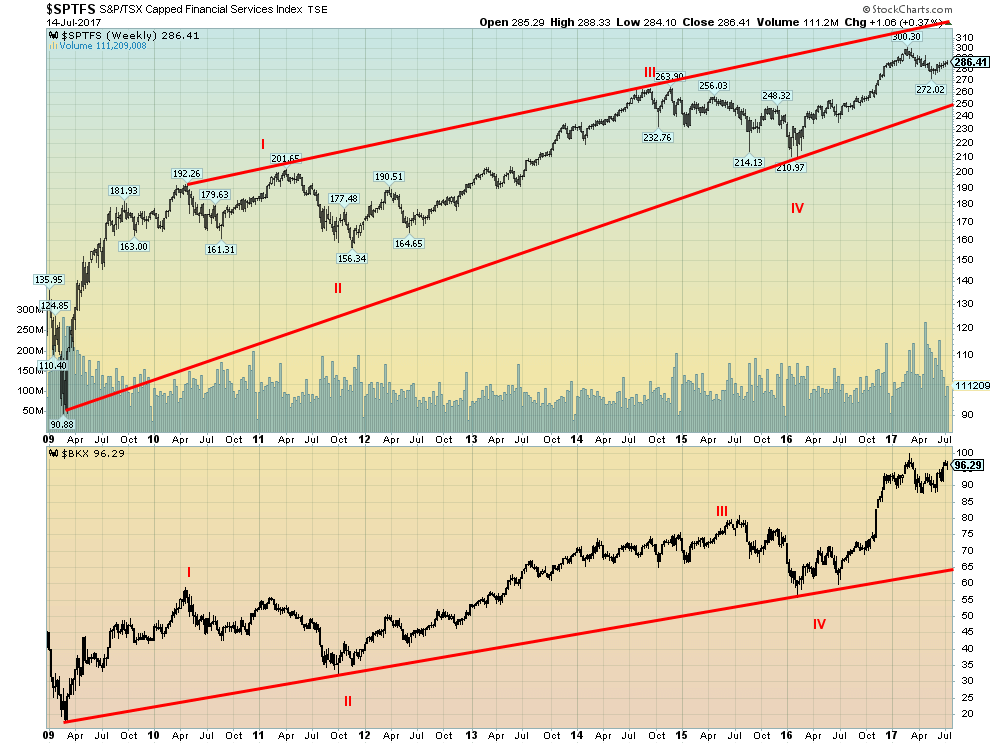
(Source)
Banks in many respects have been underperformers in the bull market that got underway in 2009. The S&P TSX Financials Index (TFS) is up only 122% since 2009 while the KBW Bank Index (BKX) is up even less gaining 113%. Since 2000, the TFS hasn’t done too badly gaining 205%, but the BKX has been a dog rising only 25%. Maybe that is not surprising given it was the banks that were behind the financial collapse of 2007–2009. Both the TFS and the BKX have completed what appear to be four waves to the upside since 2009. We are now working on wave 5.
Rising interest rates are beneficial to banks as they are able to increase their net interest margin by charging more for loans while suppressing the rates they pay to depositors (yes, they do that). With the US economy being described as robust and the Canadian economy showing signs of improving it might actually hasten the rate of borrowing. And banks, eager to lend money might once again throw caution to the wind to help increase their loan book. Increased loan activity can lead to more economic activity and a higher GDP. The age-old question has always been—how much debt is too much. Many believe we have already passed that point as the Bank of Canada has constantly shown concern over Canadians’ high debt levels.
In the US, personal debt has not gone up much since 2008, rising from $17.1 trillion in 2008 to $18.4 trillion today. Mortgage debt, which is the largest component, is virtually unchanged at $14.5 trillion. The big gain in the US has been with student loans that have doubled since 2008 rising today to $1.5 trillion. This is somewhat worrisome. Automobile debt has also jumped from just under $800 billion to over $1.1 trillion today. We are sure that with wider spreads now available to the banks they might just relax their criteria for lending a little bit against the backdrop of a robust US economy and an improving Canadian economy. That it all might once again prove to be fateful is beside the point. Enjoy it now. Bank stocks should see improvement going forward.
(Source)
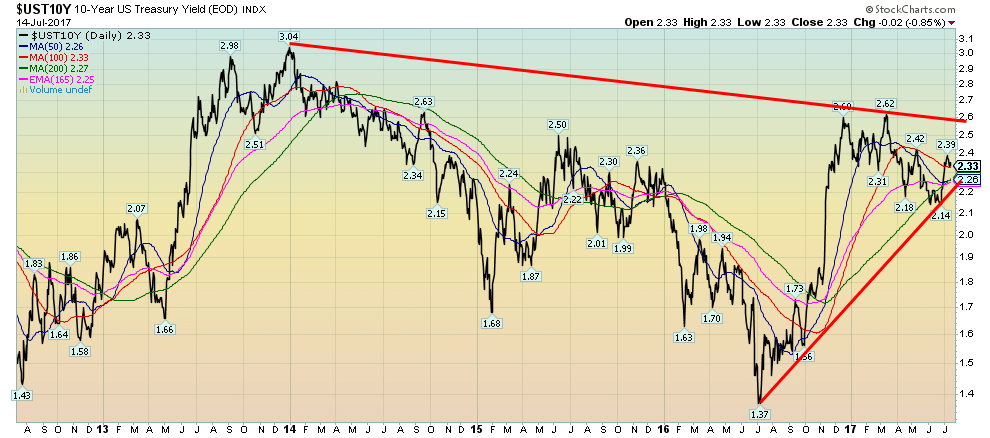
US (and Canadian) interest rates have been rising. From a low of 1.37% back in July 2016 the US ten-year Treasury note has moved up to 2.33%. This is still off the high of March 2017 at 2.62%. The recent corrective phase appears to be over and US interest rates have been rising once again. It is no surprise that rates in other countries have been rising too. As noted, the Canadian ten-year Government of Canada bond has moved from a low of 0.98%—also in July 2016—to 1.92% today. The ten-year Japanese Government bond (JGBs) was a negative 0.29% back in July 2016 but it is now positive at 0.08%. Still pretty low but at least not negative. Similarly, the ten-year German Bund hit its low also in July 2016 at a negative 0.19%. The German Bund is also no longer negative trading today around 0.60%. Improving economies bring higher interest rates. Higher interest rates are a sign that the Euro zone, North America, and Japan may not be so bad after all. Well, at least that is the theory.
(Source)
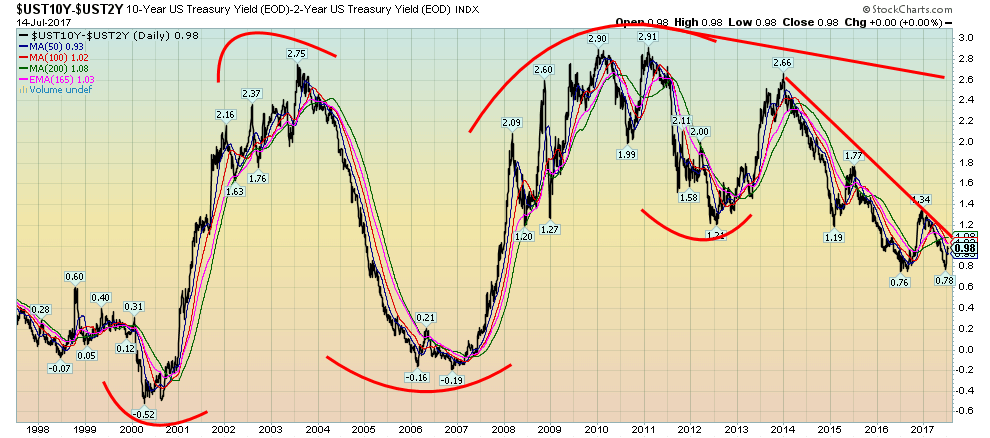
As we have noted before we like to watch the spread, especially between the two-year and the ten-year US Treasury notes. Today that spread is a positive 0.98%. If a recession were imminent the spread would most likely be negative. It hit a low of negative 0.52% back in March 2000. That was just before the so-called Dot Com crash and the subsequent recession. In November 2006 the spread was once negative at 0.19%. That was a good year before the stock market top and the subsequent financial crash of 2007–2009. Nonetheless, it was a warning sign. The yield doesn’t necessarily have to go negative but it is preferred and is usually a good sign that the stock market bubble is over and that a recession could be imminent. At today’s spread of 0.98% we appear to be nowhere near that point. But the direction is pointed that way. If the stock market does go into a blow off does the Fed tighten further to try to keep things under control?
Keep in mind that signs of trouble do abound. Even Janet Yellen expresses some concern. But most only want to hear her good news and not necessarily the bad. While the trigger for a financial collapse could occur anywhere (China and its massive loans many of which are under water is a good example) vulnerabilities lie in the US too. Puerto Rico has effectively declared bankruptcy, but other US states are also in financial difficulty. Illinois is probably the largest but others include Connecticut, Maine, and New Jersey. There are others as well including Arizona and even California. Many pension funds remain underfunded. The warning signs are there but we are not yet at the point where a collapse is imminent. If the Fed is forced to tighten further, and the spreads go negative or even just very low we will then be at that point.
(Source)
The Fed may be suggesting that the US economy is robust and that further Fed rate hikes are probable, but the US$ doesn’t seem to get it. Or maybe the US$ is a warning sign. This past week the June CPI came in flat while the core CPI (ex-food and energy) was up a measly 0.1%. Inflation? What inflation. That put the year-over-year core CPI at 1.7% vs. the Fed’s target of 2%. Retail sales were even worse. June retail sales were down 0.2%. The market expected a rise of 0.2%. Year-over-year retail sales are up 2.8%. Inflation wipes away a chunk of that growth so what remains suggests retail sales are barely, if at all, keeping up with population growth.
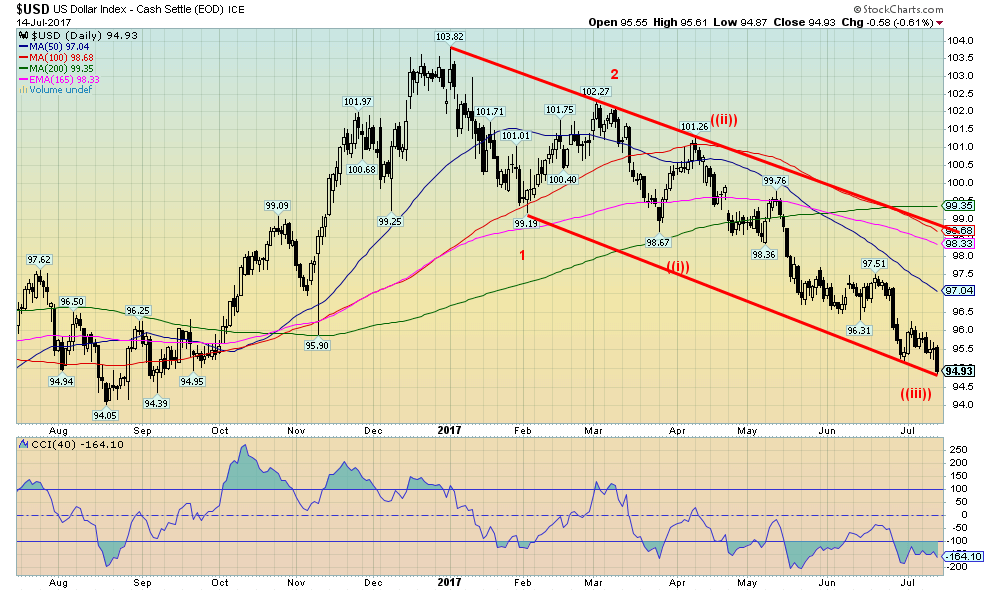
The result is the US$ Index fell hard on Friday shedding 58 points or down 0.6%. On the week the US$ Index was down 0.9% and is now down 7.2% in 2017. The sharp drop in the US$ Index on Friday helped spark gold to an $11 up day.
It appears the recent decline in the US$ Index is not yet over. We had noted that there were potential targets down to around 96 (achieved) then 94. The low this past week was at 94.87. So we are getting closer and a decline to 94/94.20 appears to be in progress. If that level should fail to hold the next target zone would be down to 91. The US$ Index appears to be down near the bottom of the bear channel so a bounce could occur this coming week. Resistance is seen up to 97 and the top of the bear channel is up at 99.
With the Trump follies sure to continue the US$ could smell trouble and continue to decline. As noted we are now expecting a decline to at least 94.
(Source)
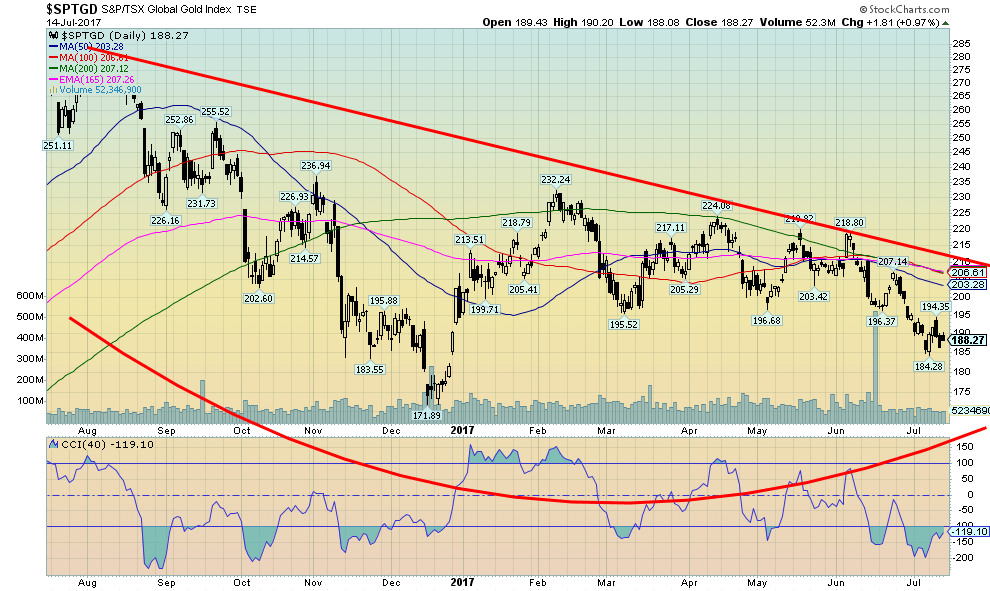
Gold responded positively to the lower than expected CPI and retail sales and subsequent sharp drop in the US$ Index by having one of its best days in weeks. Gold ended the week on an up note gaining 1.5%. Silver fared even better: up 3.3%. The gold stocks also responded positively although the gains weren’t gangbusters with Gold Bugs Index (HUI) gaining 3.9% and the TSX Gold Index (TGD) up a more modest 1.4%. After falling for basically five consecutive weeks the rebound was welcomed. The question now is, is the recent weakness for gold and the precious metals over or is there more to come to the downside.
We were buoyed when silver made a new 52-week low for the move down but gold did not. We are also buoyed by the sharply improving commercial COT (see below). Naturally, we need a confirmation of the divergence between gold and silver and in that respect we are still awaiting that confirmation. One cannot say for absolute sure that the low is in until a previous high is taken out. Gold needs to break out over and close over $1,260 to really confirm it for us although the break above $1,230 was a positive sign. However, we didn’t close over $1,230, which would have been more positive.
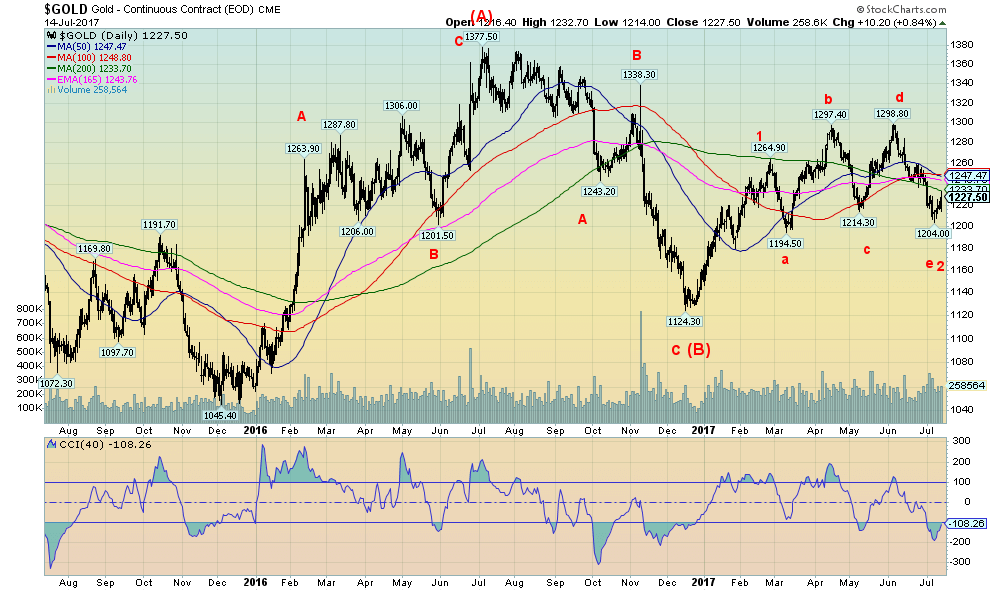
We also like the pattern that appears to have formed for gold. After rising from the December 2016 low of $1,124 to a high of $1,265 in late February gold has been through a series of sharp ups and downs. Despite the fact that gold would make new highs then fall followed by another new (small) high the pattern traced out appears to be a five-pronged reversal pattern that we labeled abcde. It is not the traditional symmetrical triangle pattern one normally sees but the pattern is interesting. Naturally, we won’t be able to confirm the pattern until we break to new highs over $1,300. But if it does then gold has the potential to rise to at least $1,400. Now wouldn’t that warm the cockles of the gold bugs as they would be able to stop kicking the dog and complaining about manipulation?
Naturally, gold has to hold the recent low at $1,204 as well. Otherwise, gold could still have further lower targets initially at $1,170/$1,180. As we have also shown in previous write-ups golds seasonals should be turning positive. For the past five years, gold has on average topped out by July/August then gone into a swoon that didn’t bottom until late in the year. This year we appear to be following the more traditional seasonals with the top in February/March followed by a swoon into March/April, another attempt to move higher into May followed by yet another swoon. The most recent top came in early June and we have been falling into a traditional period for a low into late June/July.
Confirmation would come with a move and a close over $1,260. A top then could come into September/October followed by another drop into October/November then a low and gold should then move higher into late December, January, and February. At least, that is how the patterns have generally unfolded in the past.
Finally, after making that initial bottom in December 2015 gold has been through a series of ups and downs and we believe that has helped form a broader bottom. Ultimately, this wave should carry us not only to$1,400 but also to $1,500 and possibly higher. C waves can be quite spectacular and we believe this wave should be wave 3 up of the C wave and therefore the most powerful up wave.
(Source)
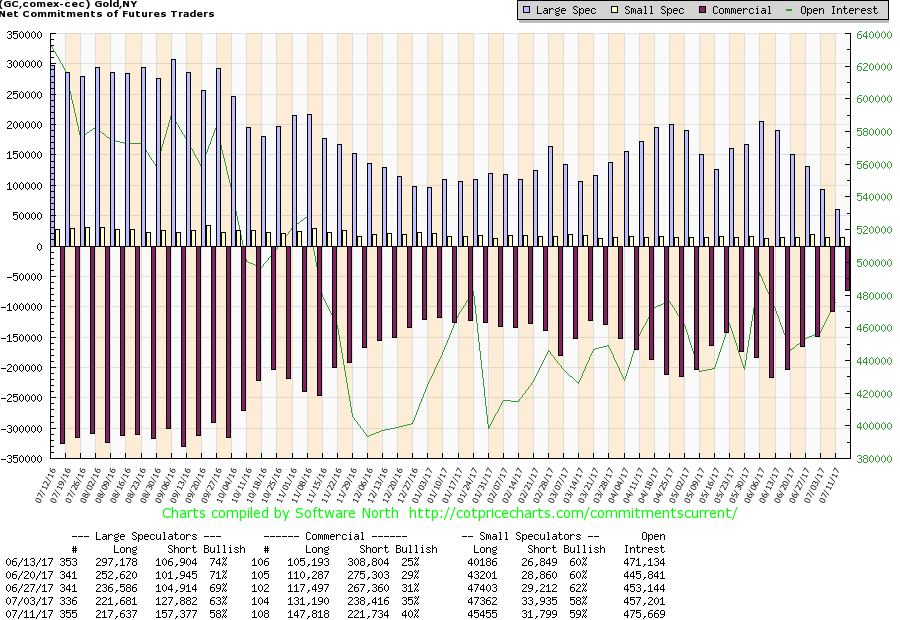
The commercial COT jumped to 40% from 35% this past week and from 25% five weeks ago. This is the best level for the commercial COT seen in the past year. It is even better than it was before the December/February up move from $1,124 to $1,265. Short open interest dropped roughly 17,000 contracts while long open interest rose about 16,000 contracts. Not surprisingly, the large speculators COT (hedge funds, managed futures, etc.) fell to 58% from 63%. Sentiment for gold had fallen to about the 12% level. While this is not rock bottom it is low and in an area where gold has in the past found bottoms. The commercial COT was quite encouraging.
(Source)
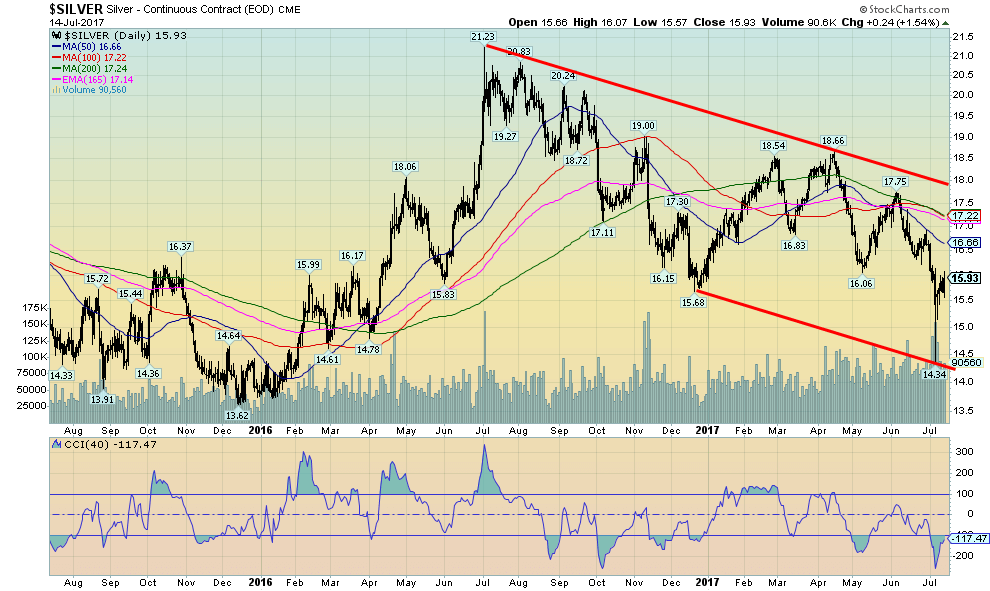
Trying to figure out the wave count on silver is… well….trying. The patterns are unfolding as if this is a corrective to the huge drop from $49.50 way back in 2011 to the low of $13.62 in December 2015. We believe that was also a very important cycle low coming as it did some 24 years after the low of 1993. That, in turn, was 22 years after a key low in 1971. Yes, not enough observations to come to any conclusions but it is interesting.
Key was the huge divergence between gold and silver at the recent low. At $14.34, silver plunged to new 52-week lows, not far above the December 2015 low of $13.62. Gold, on the other hand, was nowhere near either it’s December 2016 low of $1,124 or it’s December 2015 low of $1,045. The huge divergence needs to be confirmed. We noted where gold would confirm. For silver, a close above $17 would confirm the low of $14.34. Above $17.75, odds favor a rise to $18.66 the April high. Above $18.66 a challenge would be seen to the July 2016 high of $21.23.
Naturally, all this depends on no new lows below $14.34. A break back under the December 2016 low of $15.68 would be a concern and suggest that there remains more work to be done before a low can be confirmed. A move above $16.25 would most likely suggest that we should not fall back below $15.68.
(Source)
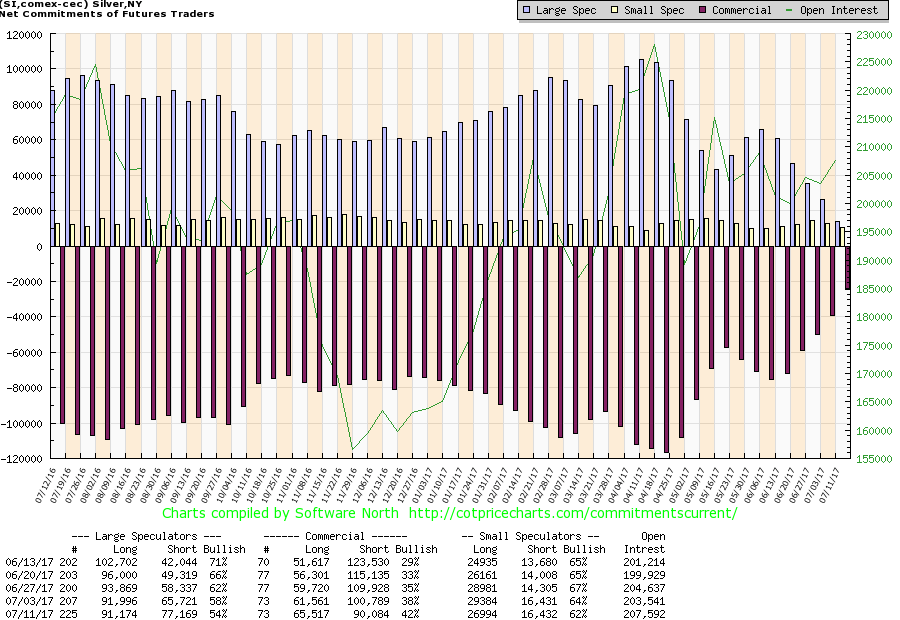
Like the gold commercial COT, the silver commercial COT improved substantially this past week jumping from 38% to 42%, the best level seen in a year. Short open interest fell roughly 10,000 contracts while long open interest rose about 4,000 contracts. The large speculators COT fell to 54% from 58%. The large speculators long open interest is at about 91,000 contracts, a level that has rarely been seen in the past at significant lows. This suggests to us that the large speculators are holding long-term positions in silver and not always worrying about the weekly movements. This is a positive development. We remain hopeful that the improvement in the commercial COT is a sign that a low has been made. As well, silver sentiment fell to around 10%, levels often associated with important lows.
(Source)
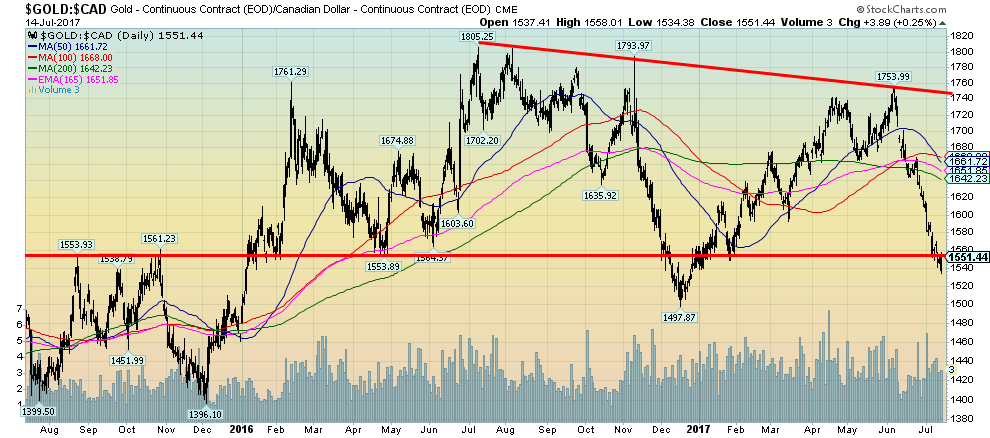
This is gold in Cdn$. Gold in Cdn$ benefitted from the sharp drop in the value of the Cdn$ vs. the US$. However, more recently with the strengthening Cdn$, it has hurt the value of gold in Cdn$. Gold in US$ bottomed in 2015 but gold in Cdn$ actually bottomed in June 2013 at $1,241. Gold in Cdn$ is currently up 25% from that low but it has been up as much as 45% at its peak in June 2016. Gold in US$ is up currently 17.4% from its December 2015 low and at its peak, in July 2016 it was up 31.8%. The weakening Cdn$ has allowed gold in Cdn$ to outperform.
The action since the peak in 2016 has been corrective in nature. It is possible that a low is now being seen as gold in Cdn$ has traced out what might be an ABC flat pattern. There is room for the current C wave to decline further and even make small new lows below $1,498. But if gold in US$ gets going here odds favor gold in Cdn$ to also rise unless of course there is complete melt-up in the value of the Cdn$ offsetting any gains that might be made in gold in US$. It has been a steep decline over the past few months since that peak at $1,754 in June 2017. Gold in Cdn$ needs to regain above $1,660 to suggest that a low is in. The low at $1,534 must also hold.
(Source)
Gold stocks as represented here by the TSX Gold Index (TGD) continue to struggle. At one point the TGD was up a bit over 19%. Now it is down 3.1%. This is quite a turn around, and frustrating. Nonetheless, we continue to view gold stocks as making a significant bottom here. Since peaking back in August 2016 the TGD appears to be forming a huge bottom pattern. The pattern holds as long as the TGD does not make new lows below 172. The downward sloping pattern forming over the past six months could be interpreted as a descending triangle. If so then the TGD could be returning to test the lows of 2015 near 115. We doubt that but it does have to be considered. Gold stocks remain exceptionally cheap relative to gold. A break above 210 would suggest a low is in and a break above the February 2017 high of 232 would absolutely confirm the low. Sentiment towards the gold stocks has become depressive and that is normally a sign that they should be purchased here and not sold. The junior mining exploration stocks found on the TSX Venture Exchange (CDNX) have held up relatively well during this most recent decline. We view that as positive. But they too are undervalued, under-owned and under-appreciated. People don’t care about junior mining companies when they can just own the FANGs. Some breakouts over previous highs would start to attract some attention.
GLOSSARY
Trends
Daily – Short-term trend (For swing traders)
Weekly – Intermediate-term trend (For long-term trend followers)
Monthly – Long-term secular trend (For long-term trend followers)
Up – The trend is up.
Down – The trend is down
Neutral – Indicators are mostly neutral. A trend change might be in the offing.
Weak – The trend is still up or down but it is weakening. It is also a sign that the trend might change.
Topping – Indicators are suggesting that while the trend remains up there are considerable signs that suggest that the market is topping.
Bottoming – Indicators are suggesting that while the trend is down there are considerable signs that suggest that the market is bottoming.
—
DISCLAIMER: This article expresses my own ideas and opinions. Any information I have shared are from sources that I believe to be reliable and accurate. I did not receive any financial compensation in writing this post, nor do I own any shares in any company I’ve mentioned. I encourage any reader to do their own diligent research first before making any investment decisions.
Featured Image by Katrina.Tuliao via Wikimedia Commons / CC BY 2.0


New Gene Therapies Transform Rare Disease Care, but Gaps Remain
Gene therapies are transforming rare disease treatment, enabling normal lives for some patients. However, only about 6% of 7,000 rare...


Temotiva Launches Crowdfunding Campaign to Advance Preventive Mental Health
Temotiva Innovación Lab has launched a crowdfunding campaign through Santander X Explorer, marking a new phase for the University of...


Fed Policy Shift Raises Concerns Over Debt and Inflation Risks
The Federal Reserve is criticized for resuming balance sheet expansion through Treasury purchases despite expectations of tighter policy under new...


AI Adoption in Italian Retail Stalls Despite Strong Experimentation
A survey on AI in Italian large-scale retail trade shows companies are increasingly adopting artificial intelligence, but only 1.4% have...


Crypto Market Stays Stable as Bitcoin and Ethereum See Mild Declines
The crypto market remained stable despite slight declines in major coins like Bitcoin and Ethereum. Bitcoin held near $64,362, while...
 |
|
 |  |
 |
|
-

 Biotech2 weeks ago
The German Biotech Industry Faces Funding Crunch Despite Market Stability
-
 Markets7 days ago
Rising Inflation, Fed Uncertainty, and Market Excess Amid War and SpaceX Mania
-

 Markets2 weeks ago
Jobs Strength Triggers Market Reversal as Inflation and Rates Take Focus
-

 Africa4 days ago
Egypt’s Net Foreign Assets Rise as External Position Continues Gradual Strengthening
You must be logged in to post a comment Login