Markets
US stock markets faced a sudden reversal last Friday
It may be that the reversal in markets on Friday was merely a punctuation mark to what was a very volatile week. Stock markets were cautious going into the Comey testimony and the UK elections while gold was rising.

While everyone was glued to their TV watching the testimony of former FBI director James Comey and the results of the UK election, stock markets in the US suddenly reversed on Friday, June 9, 2017. It wasn’t just any garden party reversal either. The reversal day was inconsistent as some markets made new all-time highs and stayed there while others made new all-time highs then reversed and closed lower.
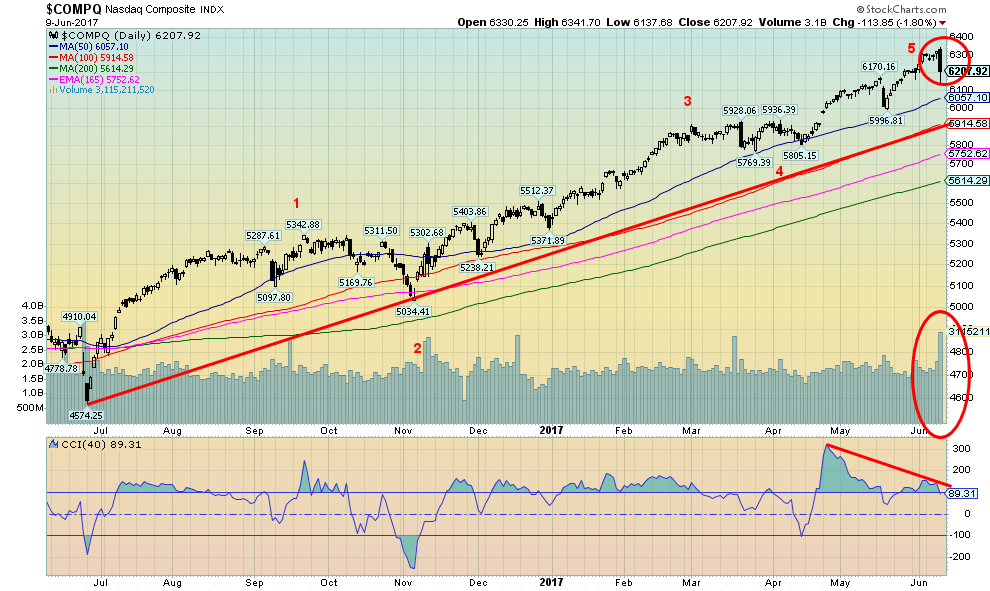
The reversal hit the technology sector. The NASDAQ made new all-time highs (again), then reversed sharply and closed 1.8% lower while the NASDAQ 100 dropped 2.4%. The S&P 500, heavily dominated by tech stocks as well, also hit a new all-time high, put in a wide-ranging outside day and closed off just under 0.1%. Exhibiting a similar pattern were the Russell 1000 and Russell 3000. On the other hand, the Dow Jones Industrials (DJI) along with the NYSE Composite and the Russell 2000 made new all-time highs and new all-time high closes as well. Other indices such as the Dow Jones Transportations (DJT), the Dow Jones Utilities (DJU), the Dow Jones Composite (DJC), and the Dow Jones REIT Index (DJR) did not make new all-time highs nor were they close.
The big five, that some call the “Generals” are Apple (AAPL), Alphabet (GOOG), Facebook (FB), Netflix (NFLX) and Microsoft (MSFT). They constitute 42% of the NASDAQ and 12.5% of the S&P 500. They were the leaders taking the stock markets to new heights. AAPL fell nearly 4%, GOOG was off 3.4%, FB down 3.3%, MSFT down 2.3% and the big loser was NFLX down 4.7%. As we have noted before, the recent rally reminded us of other famous narrow-based rallies that ended in tears such as the “Nifty Fifty” rally of 1972 and the final rally in 1987 before the October massacre.
The NASDAQ put in what is known in technical terms as a “key” reversal day. A “key” reversal day is usually defined as a stock or an index hitting a new high then reversing putting in an outside day of higher highs, lower lows than the previous day and closing below the previous day’s close. One can also have a “key” reversal week and month. The same can occur at lows. The trouble with the definition is that sometimes the “key” reversal day is not fully recognizable until well after the fact. In this case not only did the NASDAQ make new highs, the NASDAQ made new all-time highs then reversed and closed lower effectively wiping out two months of gains in a few hours. Of the “Generals”, only FB made a new all-time high. Key now is will the NASDAQ follow the signal and continue a downtrend.
It may be that the reversal in markets on Friday was merely a punctuation mark to what was a very volatile week. Stock markets were cautious going into the Comey testimony and the UK elections while gold was rising. After Comey spoke and the results of the UK election were known stock markets moved to new highs while gold reversed and sold down. The story had it that someone sold the equivalent of $4 billion worth of gold futures going into the Comey testimony.
(Source)
(Source)
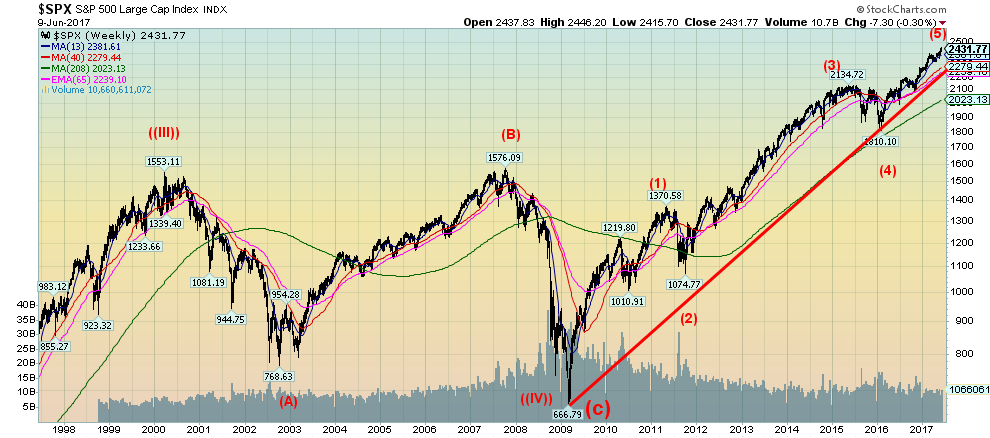
It is always good to stand back and look at the big picture. Here is the S&P 500 since the late 1990s. It is pretty clear the top in 2000 was the end of a generational bull market that got its start depending on how one wishes to count the waves—in 1932, 1942, or 1949. We have always counted from 1949 as that is when the DJI broke free of a huge symmetrical triangle that had formed from the 1929 top. What followed the 2000 top was, of course, first the high-tech/internet crash in 2000–2002 and then the financial crisis crash in 2007–2009.
The low of October 2002 came 70 years following the 1932 bottom while the 2009 low was 77 years following the 1932 low. Cycle analysts have often pointed to what appears to be a 75-year cycle in US stocks. Major lows were seen around the time of the American Revolution; the panic of 1857 triggered a steep depression into the early 1860s; then came the Great Depression and the major stock market low of 1932. So the low from the financial crash or Great Recession as it became known occurred within the acceptable range of the 75-year cycle.
Some believe there is also evidence of a 90-year cycle. That implies that there is a secondary recession or depression and most likely another stock market panic following the 75-year cycle. If that is the case then another panic and steep recession could soon follow into the 2020s. The Great Depression occurred roughly 95 years following the steep depression of the late 1830`s and early 1840`s.
The 2009 low was a significant one and the bull wave since then appears to be unfolding in Elliot five waves. Wave 2 was the 2011 EU crisis and wave 4 was the end of quantitative easing and the threat of hiking interest rates correction that bottomed in February 2016. If the current fifth (and final) wave up is correct, it could equal the first wave up that topped in May 2011. Potential targets could be from 2,500 to 2,550.
(Source)
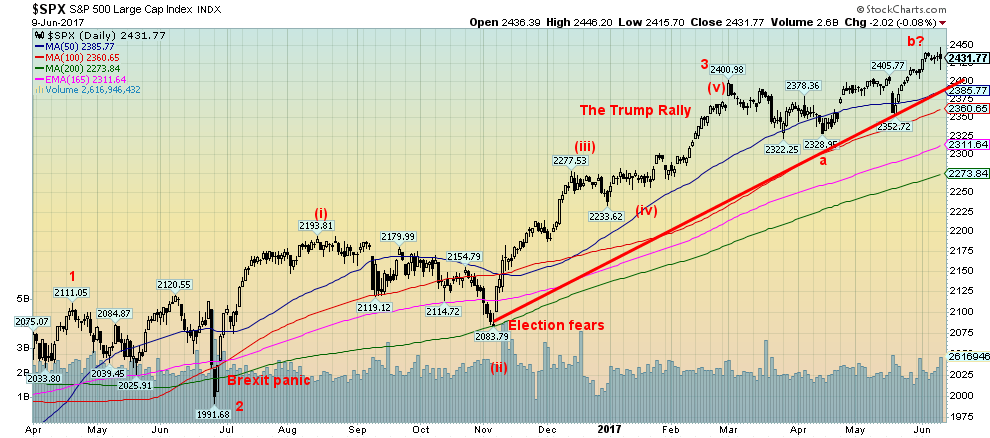
The February 2016 low was the last significant low seen on the charts. Since then we have had the Brexit panic that was short lived; a correction into the election on fears that Trump would be elected (he was); and then when he was elected we had a significant rally based on the belief that Trump was going to be great for the economy with his tax cuts, infrastructure program, program cuts, and increased defense spending. Over the past few months, considerable doubt has emerged as to whether he can implement his agenda as Congress and the courts have played havoc with his plans. Now he is becoming bogged down with the Russian investigation and the Comey affair. That hasn’t stopped the market from making new highs, but the controversies are sure to continue going forward and that, in turn, will bog down the Trump agenda.
Friday saw a wide-ranging outside day for the S&P 500 with a higher high (and new all-time high) a lower low and a lower close. A classic reversal. As we noted earlier, we don’t know whether this reversal will have any “legs” but it is noteworthy and shouldn’t be ignored. Our belief is that this is fourth wave correction and once it is complete the S&P 500 should go new all-time highs once again with the final high coming sometime this summer in either July or, more likely, August and no later than September.
The current breakdown zone is at 2,350, but warning signs would appear under 2,385. Current market sentiment is high and at levels that normally imply at least a pullback. The put/call ratio is also at levels that suggest that there are few bears out there.
(Source)
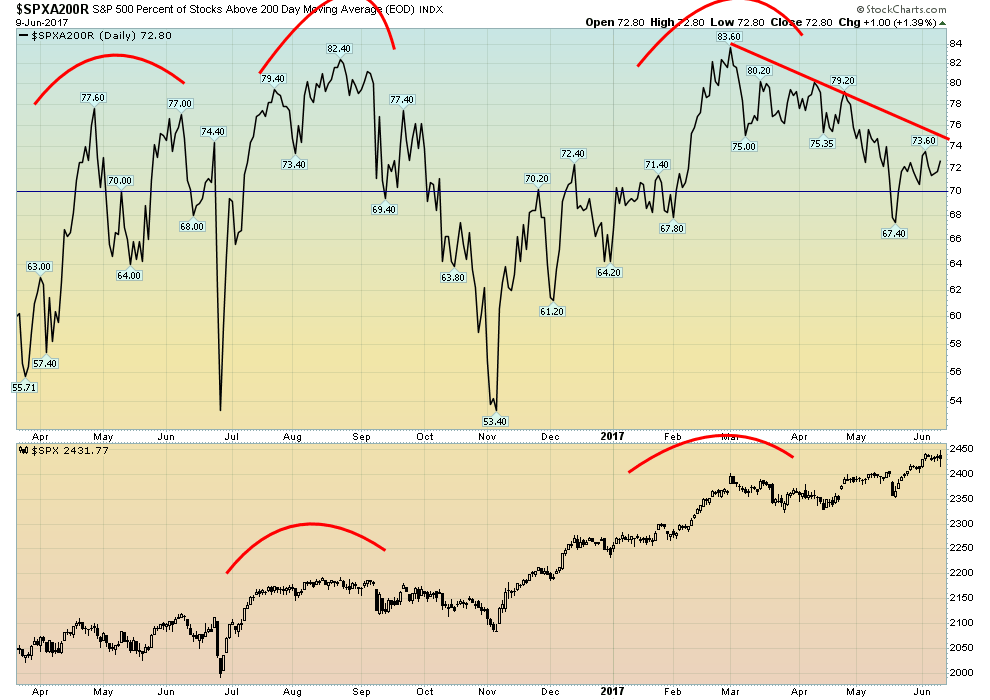
The market may be moving to all-time highs but fewer stocks are participating as this chart of the percentage of stocks trading over their 200-day MA seems to show. As we have noted that market rise appears to have been led by the “Generals”—Facebook, Apple, Alphabet, Netflix, and Microsoft. After that, it is pretty thin. Those five stocks make up 12.5% of the S&P 500 and an incredible 42% of the NASDAQ.
(Source)
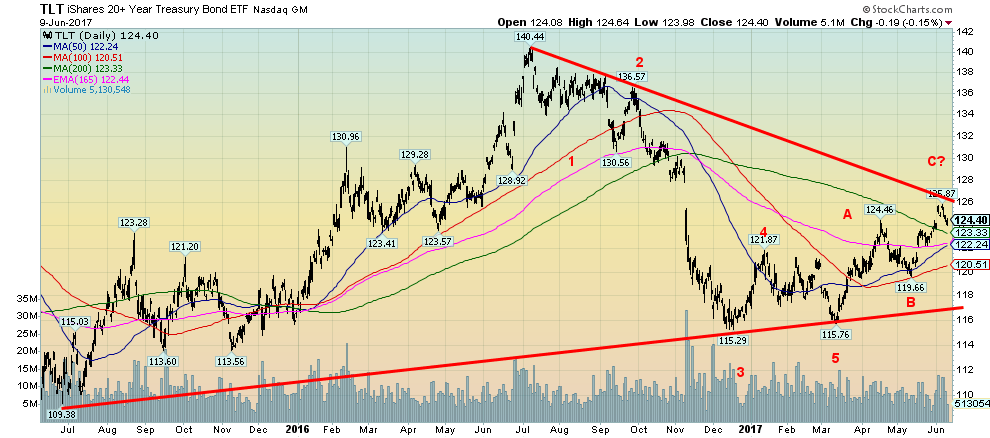
Bonds continue what we believe is an upward correction. We appeared to come close to that downtrend line from the July 2016 but didn’t break above it. Now we have pulled back slightly once again. There appears to be considerable support for the TLT down to 120.50 with major support way down near 117. Still one has to wonder whether we have seen the end of the corrective rally that got underway in March 2017. A firm break above 126 would suggest higher prices ahead with the next major resistance near 130.
(Source)
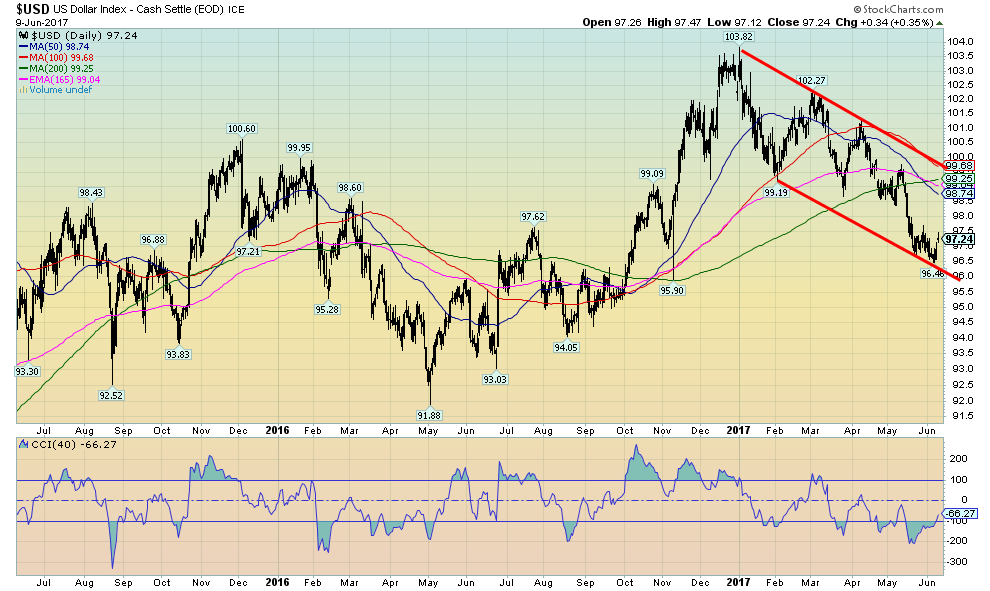
The US$ Index has completed a rather interesting Fibonacci 61.8% retracement of the move from the May 2016 low of 91.88 to the January 2017 high of 103.82. That works if this is merely a correction of that wave. But if the January 2017 high was a significant high counting from the major low of May 2011 then this should merely be a pause zone. Still, sentiment towards the US$ is bearish these days including headlines seemingly indicating that no one wants US$.
(Source)
As we noted earlier, apparently someone sold $4 billion worth of gold futures as the Comey testimony was about to get underway. This has brought forward all of the usual ranting about gold price manipulation, and, that technical analysis is useless in a manipulated market. The feeling was that the Comey testimony would not result in a constitutional crisis. We would be hard pressed to believe why it would, at least in the initial stages. This is most likely going to be a long, dragged out affair, not one that hinges solely on the testimony of Comey.
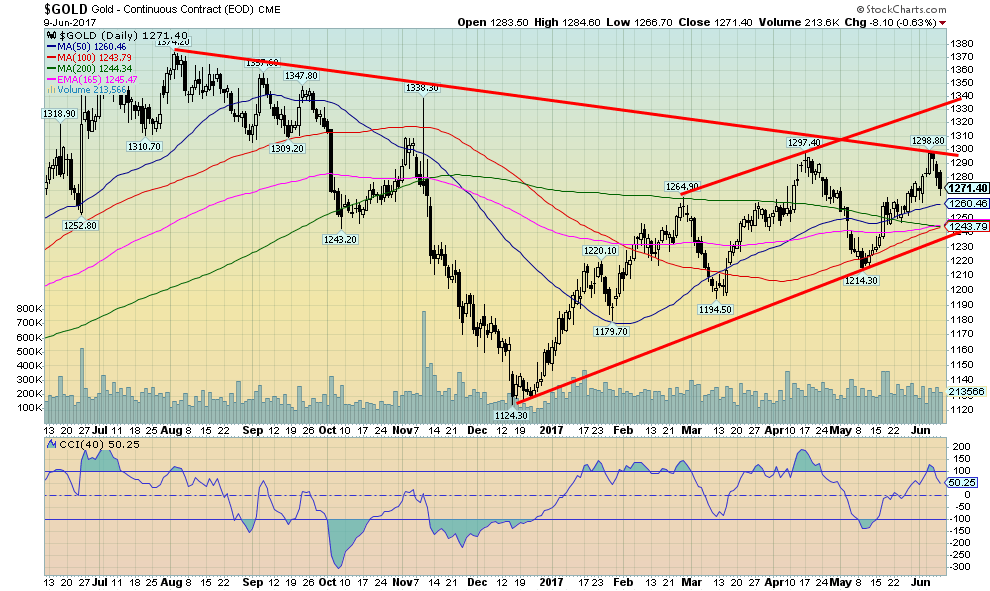
There is considerable support for gold down to $1,240 with interim support at $1,260. We could also be making what might be called a running correction. Following the high at $1,265 in February gold pulled back to about $1,195. Following that, a new higher high was seen followed by a higher low. Now we have made another slightly higher high and our expectation here is that we could well make a higher low again. Key obviously is that we remain above $1,214 the low of May 2017.
Gold’s seasonals have in the past seen important lows in the May to July period. The last few years have seen highs instead and then weakness the rest of the year. Could this year change that and we instead see a low in the May-July period followed by a strong the rest of the year? With the US economy showing signs of weakening and the investigation into Trump sure to intensify, coupled with continued geopolitical tensions and considerable growing violent clashes in the US between Trump and Alt-right supporters and leftist, anti-fascist and environmental groups, things are sure to get worse, not better. That, in turn, should be positive for gold.
(Source)
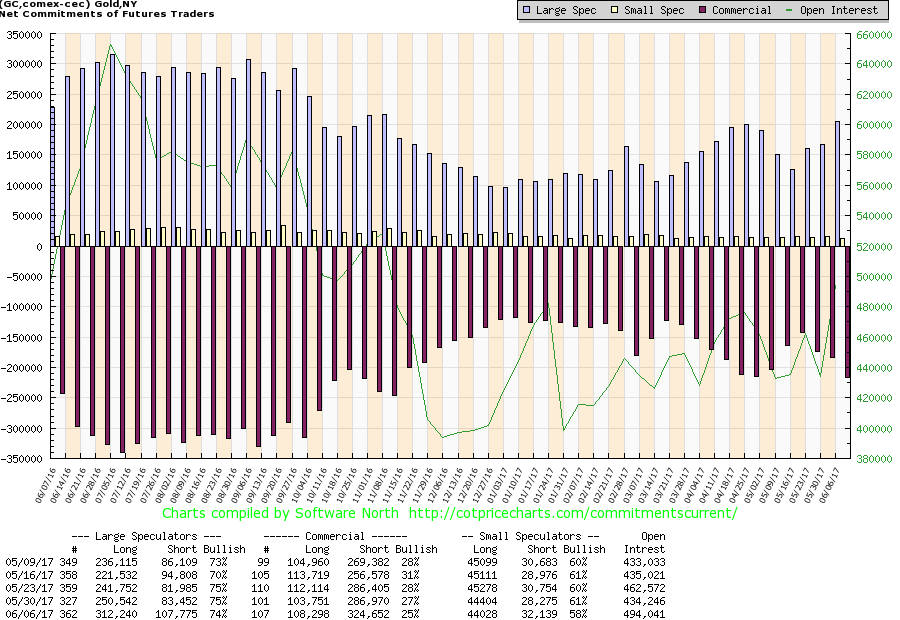
It probably is no surprise that before the recent drop in gold prices the commercial COT had fallen back. This past week the commercial COT fell to 25% from 27% bulls the previous week and 31% only four weeks ago. On the other side, the large speculators COT was fairly steady at 74%, down slightly from 75% the previous week. The large speculators COT never did get to levels that one would consider super bullish. What was noteworthy with the large speculators COT was long open interest leaped roughly 62,000 contracts even as the short open position was only up about 25,000 contracts. Yet the COT went down not up. The commercial COT saw a rise of roughly 5,000 contracts on the long side but a big roughly 38,000-contract jump on the short side. The commercial COT fell but it didn’t put the commercials in a super bearish position. This may not be as bearish as it looks right now. We are looking for $1,240 to hold on the pullback but more importantly, we would not want to see a breakdown under $1,214 the May low.
(Source)
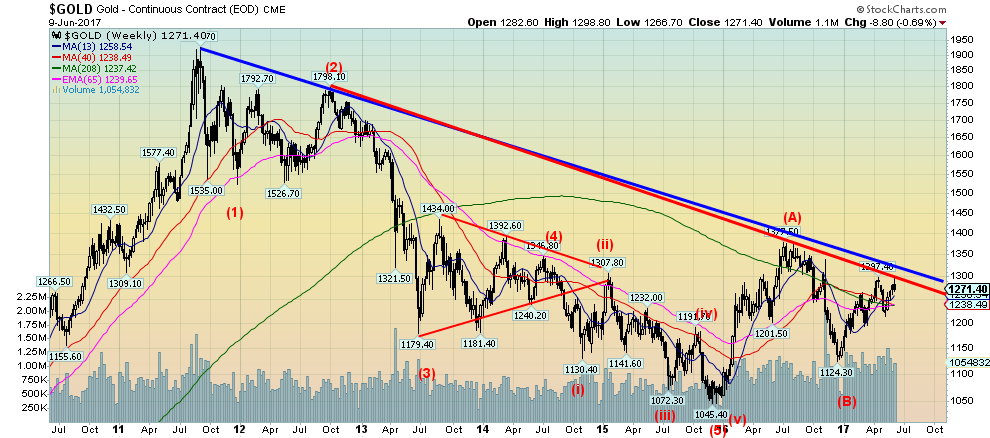
Our longer-term chart of gold shows the long correction that occurred from September 2011 to what might be the major low in December 2015. Consider that from 2001 to 2011 gold had seen an incredible rise from about $250 to the high over $1,900. So a 10-year bull market followed by a four-year bear is not especially unusual. We had been looking for a major cycle low to occur somewhere between the 4th quarter of 2015 and the 1st quarter of 2018. The low may well have been the one in December 2015 at $1,045. We have never confirmed the low, as we have always believed we needed to regain the breakdown zone around $1,500 to $1,525 to get that confirmation.
The chart also shows that from the 2011 high gold fell in a series of five waves. The wave count could well have an alternative count of a big ABC. No matter; what has since developed is either the start of a very significant correction to the September 2011 to December 2015 bear or the start of a new major bull up-leg. Overall volume has been improving along with the bull move. We have also heard quite a bit that the recent high for gold broke a six-year downtrend. Well, maybe it did, but we would feel a whole lot better if gold made a significant close over $1,300 to confirm.
Nonetheless, we find the overall pattern developing for gold to be quite positive. We believe we are in the early throes of a more significant upside move. No matter whether this is merely a corrective to the September 2011 to December 2015 decline or the start of a new bull up-leg gold could carry back to the $1,900 level and higher. If this is a more shallow correction than we should start to falter considerably around $1,500.
(Source)
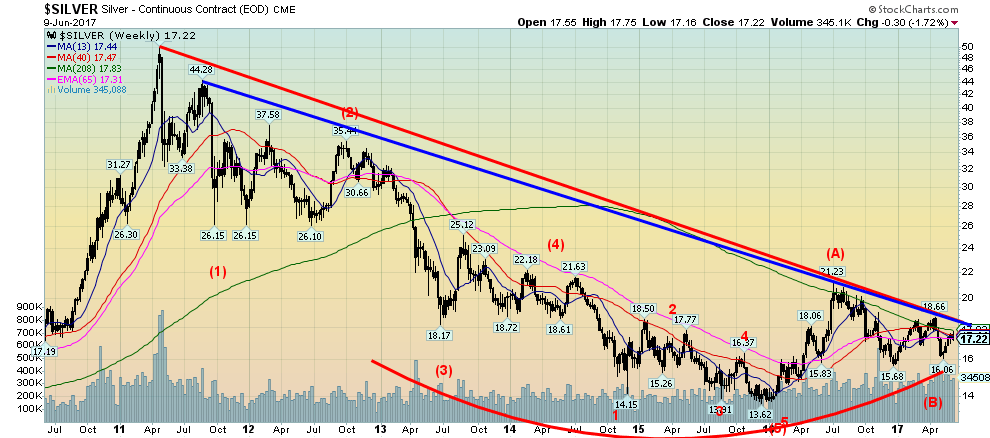
If we are positive on gold we are even more positive on silver. Silver appears to be making a significant rounded bottom pattern. The breakout point is not that far away at $18.50 although to be safe a rise back above $20 would be quite positive and confirm lows. In the interim, we have considerable support for silver down to $15.75 to $16.25. Silver is highly unlikely to fall below that level on any pullback. The rounding pattern projects up to at least $30 once it breaks out over $18.50. Note how the four-year MA appears to be acting as a stiff resistance level. The four-year MA is currently at $17.80. Silver poked its head above the average at the high of July 2016 at $21.83. But that has been it for the four years since the major breakdown in 2013. That also explains why it would be important to break that level and break above the long down trendline. It could certainly set silver on a bullish course.
(Source)
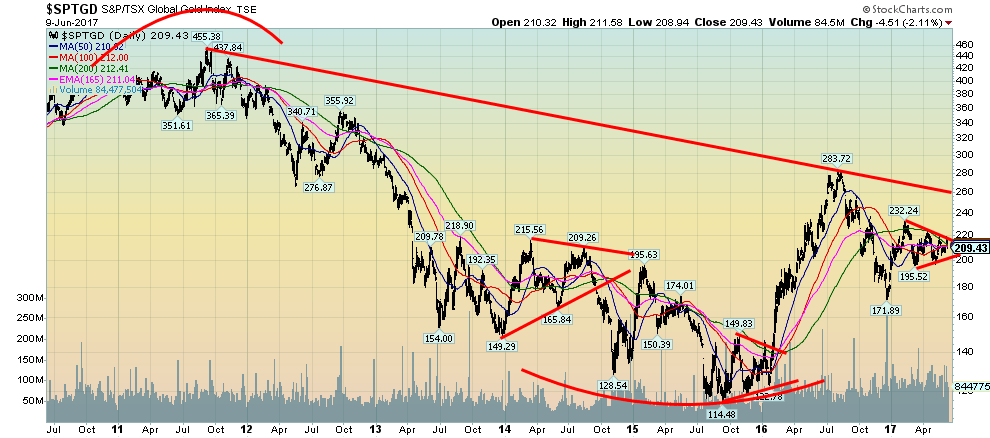
Gold stocks remain incredibly cheap at these levels. We have consistently noted the high gold HUI ratio. That high ratio would favor owning the gold stocks over bullion as in the next up move the gold stocks should outperform. This past week saw the gold indices up (Gold Bugs Index (HUI) and TSX Gold Index (TGD)) even as gold and silver put in a down week. The TGD appears to be forming what we believe is a bullish symmetrical triangle. If there is a problem with symmetrical triangles it is that they can be both bullish and bearish. One has to watch which way it breaks. The expectation here is that the breakout should be to the upside. The breakout should occur above 220 while the breakdown appears to be under 200. That is a narrowing range. A breakout to the upside should take us to 255 to 260 and what appears to be a major downtrend line from the 2011 top. Above 260, the TGD could enter a more significant bull market. A break under 200 would suggest that more corrective action is needed. Odds appear to be low that we would see new lows.
—
DISCLAIMER: This article expresses my own ideas and opinions. Any information I have shared are from sources that I believe to be reliable and accurate. I did not receive any financial compensation in writing this post, nor do I own any shares in any company I’ve mentioned. I encourage any reader to do their own diligent research first before making any investment decisions.


Abivax Shares Surge as New Trial Data Eases Safety Concerns Over Ulcerative Colitis Drug
Abivax shares surged nearly 36% after positive updated trial results for its ulcerative colitis drug obefazimod reassured investors following earlier...


El Dorado Raises $9M to Expand Cross-Border Fintech Platform
El Dorado, a Latin American fintech improving cross-border financial services, raised a $9 million Series A led by Paradigm with...


Bitcoin Stalls Near $60K as Strategy Moves, ETFs Outflow, and EU MiCA Rules Take Effect
Bitcoin hovers near $60,000 with ETF outflows, while Strategy boosts reserves, sells BTC, and raises dividends to reassure investors. Ethereum...


Cannabis Dominates Global Drug Use: Trends, Risks, and Shifting Markets
Cannabis remains the world’s most widely used illicit drug, with 256 million users in 2024, surpassing all others combined. Growth...


Italy Approves First Hydrogen-Powered Train for National Rail Network
ANSFISA has approved Italy’s first hydrogen-powered train, the Alstom HMU214, for use on the Brescia–Iseo–Edolo line. Capable of 140 km/h,...
 |
|
 |  |
 |
|
-

 Crowdfunding2 weeks ago
Temotiva Launches Crowdfunding Campaign to Advance Preventive Mental Health
-
 Fintech1 hour ago
El Dorado Raises $9M to Expand Cross-Border Fintech Platform
-

 Crypto7 days ago
Bitcoin Holds Steady as Microtransactions Surge and ETF Inflows Continue
-

 Biotech2 weeks ago
AseBio 2025 Report Highlights Growth and Future Potential of Spanish Biotechnology
You must be logged in to post a comment Login