Featured
U.S. trade war with China creates tension over stock market
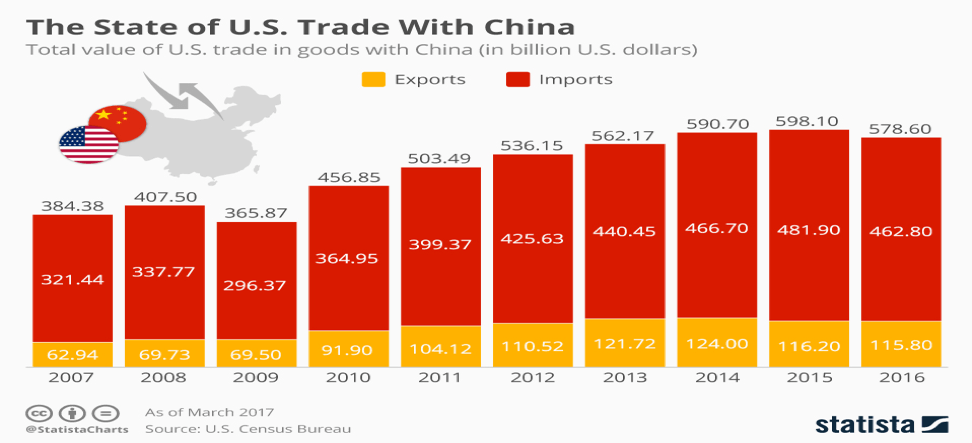
The U.S. is imposing tariffs on about $60 billion Chinese imports, which prompted China to retaliate with its own tariffs on US products.

Maybe it is slightly creepy that an ad for a product you visited keeps popping up on websites you visit. But then data mining and creating profiles on your likes is something, it seems, that the web was built for. Yes, “Big Brother” has been watching you, and one hopes it has all been benign — nothing more than tailoring ads to pique your interest. But now it has taken another turn and suddenly what seemed benign has begun to turn dark and ominous. Maybe it was always so.
It seems that Cambridge Analytica, a data analysis firm hired to support President Trump’s 2016 election campaign, collected private data on 50 million Facebook users without permission. Yes, 50 million. That’s a lot of users. But then a whistleblower stepped forward. Christopher Wylie, a Cambridge associate and a Canadian from British Columbia, came forward to tell what was really going on. As he noted, “We exploited Facebook to harvest millions of people’s profiles. And built models to exploit what we knew about them and target their inner demons. That was the basis the company was built on.”
Is it straight talk? Or is he covering his own ass? Whatever the intent, it was deadly for Facebook (FB-NYSE). Seems it all went even further as it was reported that Cambridge Analytica also had contact with the U.S. State Department. And we learned that Canada’s Liberal Party also had a contract with Christopher Wylie. Although it appears the Liberals did not proceed with the work, they were soon guilty by association.
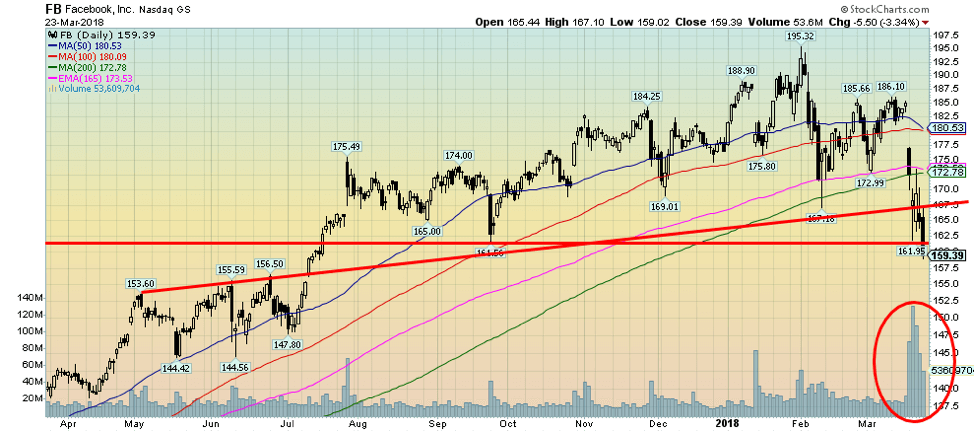
The scenario is all very Orwellian. As for Facebook, well, investors bailed. Poof! — in a flash, $60 billion wiped out. Facebook gapped down from what appears now as a two-month topping pattern. A high of $195.32 was hit on Feb. 1, 2018. That pretty well coincided with the top in the stock market. After testing down to the 200-day MA, Facebook recovered and made a lower high at $186.10 on Mar. 12, 2018. Four days later a big gap down and very quickly Facebook was trading below the 200-day MA, down roughly 14.5 percent from its all-time high. Facebook now appears poised to break down under major bull support. If that’s correct, then the bull market for Facebook would be over.
Maybe all of this was meant to be. When Facebook went public in 2012, one of the big questions was: How was it going to make money? Well, ads of course. But while ads were good, what was even better was information about everyone on Facebook. Facebook can follow your likes, your views, and your hashtags. And for someone that information is quite useful for both benign and dark reasons.
© David Chapman
Basically, the same can be said for every other social media website. Twitter (TWTR-NYSE) and SNAP (SNAP-NYSE) come immediately to mind, but there are a host of others too. Both were hit hard following the drop in Facebook. And it extends beyond social media websites to where you buy things (Amazon (AMZN-NASDAQ), Apple (AAPL-NASDAQ)), where you surf (Google (GOOG-NASDAQ), and, where you watch movies (Netflix (NFLX-NASDAQ)). Collectively they are known as the FAANGs. The FAANGs plus a host of other social media along with home shopping, surfing, and other social media websites have their eyes on you. You are being watched, followed, categorized, and tracked. If companies can do this, then governments can too.
But none of this registers or even matters to most of the public or investors, it seems. Since March 2009 it has been the FAANGs that have led the market up. Netflix up 5,713%, Apple up 1,348%, Amazon up 2,208%, Facebook gaining 317%, and dragging up the rear Google (okay, it’s real name now is Alphabet but who’s going to remember that) up 83%. Together they have helped the S&P 500 gain 252% in the same period. But could the same group of stocks also lead the market down?
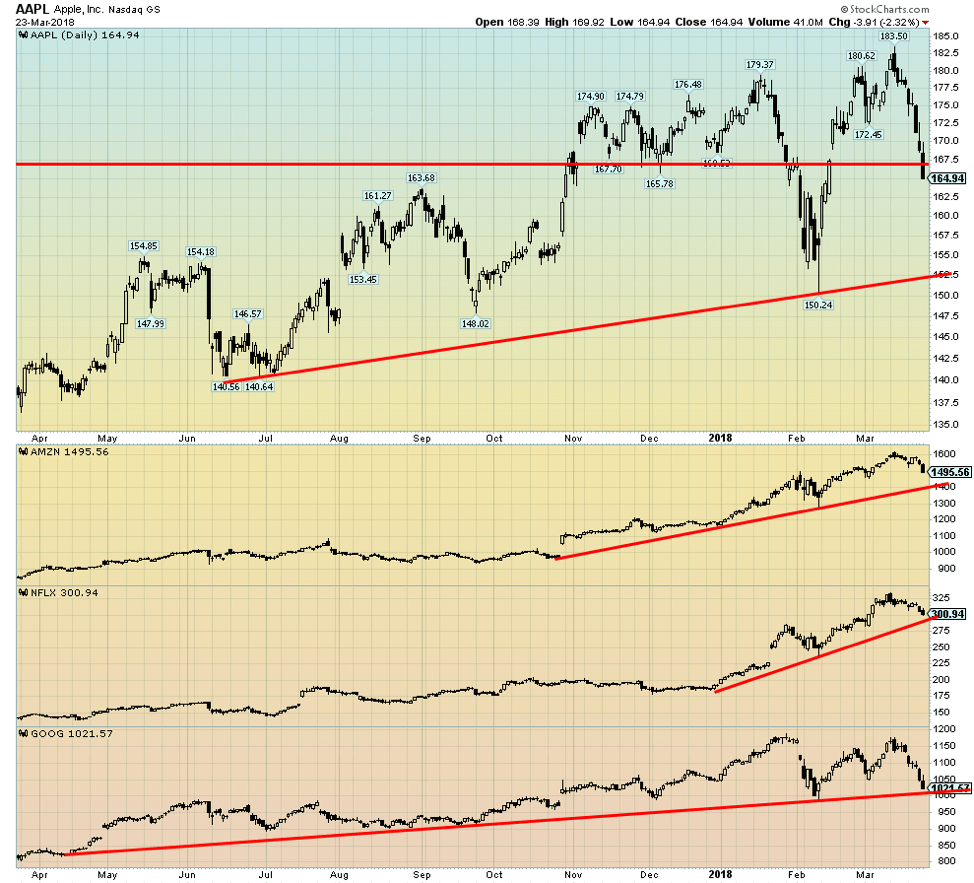
Even in the past year, the FAANGs have maintained their leadership. Again, with the S&P 500 up 10%, Facebook is actually the laggard up about 14%. Apple is up 19%, Amazon up about 77%, Netflix continues to be the star up 112%, and Google is up 25%. But over the past few weeks, they all have made tops. From their all-time highs Apple has fallen 10.0%, Amazon is down just 7.5%, Netflix is off just about 10.0%, and Google is down 14.0%. As for the S&P 500, it is off 10.0%.
Is this enough to raise eyebrows and concerns? Facebook is now barely clinging to a major support line near $160. Apple appears to be breaking some major support near $167. The remaining FAANGs and even the S&P 500 are still in uptrends but all are threatening to break bull trend lines. The FAANGs have been the darling of portfolio managers. If they didn’t own the FAANGs we are sure they might have some explaining to do. But what are they going to do if the FAANGs start leading the market down?
Put all of this against the backdrop of continued trade fears and the Mueller investigation (and Stormy Daniels) circling the White House and it potentially could prove to be a critical moment for the entire bull market that has been in place since 2009.
© David Chapman
Trade wars
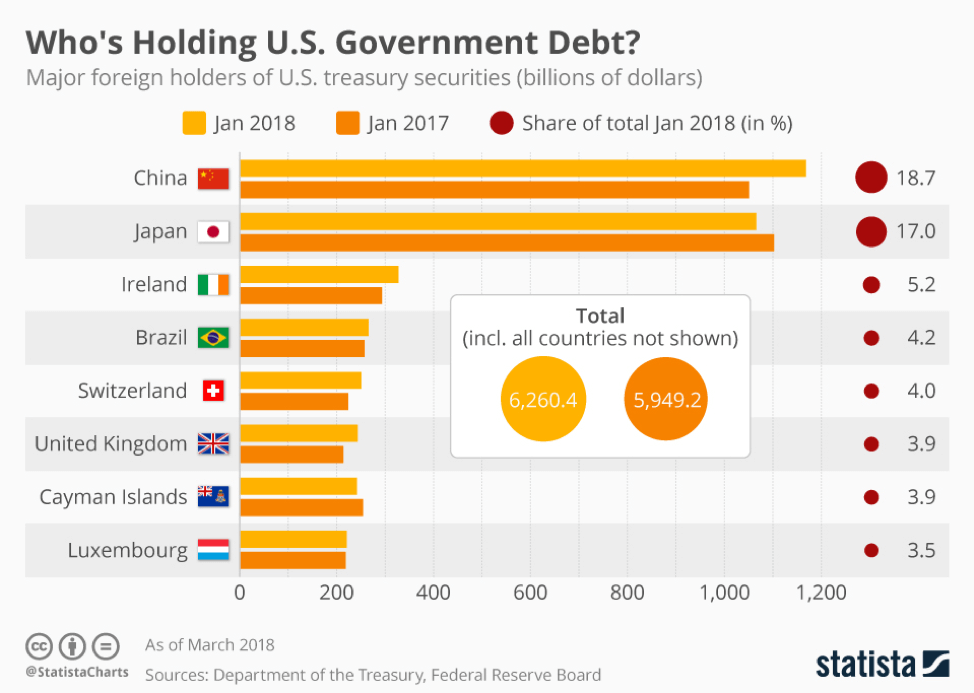
The U.S. and China had what was a “quid pro quo.” In other words, a favor or an advantage granted or expected for something in return. China manufactured goods and shipped them to the U.S. for the consumer and others to buy. That created a large trade deficit in China’s favor. In return, China financed the U.S. debt. The U.S. trade deficit with China is estimated to be $380.5 billion annually. In return, China buys the U.S’s debt. As of January 2018, China holds $1,168 billion of U.S. Treasury securities, the largest foreign holder of U.S. debt.
The U.S. under President Trump is, however, focused on the trade deficit and that the Chinese are taking advantage of the U.S. The U.S. is planning to impose 25% tariffs on roughly $60 billion of Chinese imports. China quickly retaliated announcing that it was planning tariffs of on 128 products or about $3 billion of goods imported from the U.S. Trade wars—tit-for-tat tariffs. Nobody wins. Everybody loses. If China retaliates, the U.S. retaliates back. And so on. Except at some point, the biggest loser may actually be the U.S. Soon other countries are embroiled in the dispute as countries take sides. Others could get hit in the cross-fire — Canada, for example.
Central banks (ECB, BOE, Fed) have all warned about the dangers to global growth as a result of trade wars. Trade wars contributed significantly to the Great Depression particularly after the passage of the Smoot-Hawley Tariff Act that placed tariffs on 20,000 imports in June 1930. The impact of trade tariffs will mean the prices of products rise, putting pressure on consumer and producer prices. In other words, potentially inflationary. Which in turn could spark the Fed to hike interest rates more aggressively even as other countries worry about the effects on growth and hold off hiking interest rates. The US$ fell but both gold and oil rose. Even in trade wars, there are beneficiaries.
© David Chapman
While the impact on global trade and growth may, initially at least, be limited the impact on stock markets was immediate. Stock markets “freaked.” The Dow Jones Industrials (DJI) fell over 700 points on Mar. 22, 2018, when it was learned the tariffs would be imposed. It followed the next day with another 400 points plus drop. The Tokyo Nikkei Dow (TKN) followed by falling over 900 points. The Shanghai Stock Exchange (SSEC) dropped over 3%. Even if there are no immediate signs of slowing of global growth trade wars would have a negative impact down the road. In the U.S. the ones most likely to be impacted by trade wars would ironically quite possibly be those who voted for Trump. And that hardly seems to be a “quid pro quo.”
The week that was
It seems the ink is barely dry on the comings and goings in the White House when yet another one hits the headlines. People will need a program to tell the players. Out: National Security Advisor H.R. McMaster. In: National Security Advisor John Bolton. Bolton follows quickly on the heels of a new Secretary of State John Pompano and a new Chief Economic Advisor Larry Kudlow. Rumored next out the door: Chief of Staff John Kelly to be replaced by President Donald Trump acting as his own Chief of Staff. A White House in constant turmoil and seeming chaos. A revolving door that never stops spinning.
Bolton is a controversial pick given his hawkish views on regime change and bombing of North Korea and Iran. Bolton was formerly the U.S. Ambassador to the U.N. under former President George W. Bush. His tenure was short-lived as he failed to be confirmed by the Senate. As National Security Advisor he doesn’t have to be confirmed by the Senate. Bolton was well known for his call to invade Iraq and overthrow Saddam Hussein and has called for the military overthrow of Syria’s Bashar al Assad, North Korea’s Kim Jong-Un, and the Supreme Leaders of Iran. He also believes that Russia must be met with a strong deterrence. Bolton has also made saber-rattling remarks about China.
The appointment of Bolton could cause markets to become even more jittery. Bolton’s appointment has set off alarms about saber-rattling against other countries. Markets are already nervous about trade wars and currency wars. Adding geo-political concerns just heightens the tension.
But the revolving door in the White House didn’t stop with Bolton, who incidentally is the third National Security Advisor in a little over a year. President Donald Trump’s lead lawyer in the special counsel’s Russia investigation resigned as well shaking up Trump’s legal team even as Trump intensifies his attacks on the inquiry which he calls a “witch hunt.” John Dowd was known as a voice of reason on Trump’s legal team. In his place having just joined the team was Joseph diGenova a lawyer who has accused the FBI of being involved in a brazen plot to “exonerate” Hillary Clinton in the email investigation and “frame” Trump in the Russian investigation. Again, a moderate replaced by a hardliner.
Despite not getting what he wanted on immigration, DACA, and the “Mexican Wall,” Trump did sign the $1.3 trillion spending bill rather than vetoing it as he originally threatened. Thus, a shutdown of the U.S. government was averted. The can has been pushed down the road. Included in the bill was a huge bump in the budget for the military.
Finally, Trump’s legal problems with women he is alleged to have had affairs with deepened. First, we had Stormy Daniels (real name Stephanie Clifford), the former porn star whose interview will be aired on CBS on March 25, 2018. Now comes as well Summer Zervos a former Apprentice TV star alleging molestation and has sued Trump for defamation. Then comes Karen McDougal, a former Playboy model alleging an affair with Trump and like Daniels has sued to undo a confidentiality agreement.
During the Presidential campaign in 2016 Trump was accused by more than a dozen women of molestation. He has denied them all. The defamation lawsuit brought by Summer Zervos, the former Apprentice contestant raised the prospect that Trump may have to testify in court. A Manhattan court rejected a claim by the Trump team that he was immune from being sued just because of his position as President of the United States. The judge said that “no one is above the law.”
Former Playboy Model Karen McDougal alleges an affair with Trump, ironically around the same time as he has been alleged to have had an affair with Stormy Daniels—all the while married to Melania who had just had a child. McDougal like Daniels is trying to wriggle her way out of six-figure hush money agreements. McDougal like Daniels has done an interview with Anderson Cooper of CNN.
Finally, the week ended with some of the biggest demonstrations since the Vietnam War in the late 1960s and early 1970s. Thousands took to the streets in cities across the U.S. and even in other countries calling for tighter gun laws and sending a message to the NRA and its supporters that they should “Stand for us or beware. The voters are coming.”.
While the period roughly from 1966 to 1973 is remembered as a tumultuous period of Vietnam War protests and race riots it was also a tumultuous period for the stock market given it topped out in 1966 and it was followed by up-and-down plunges before making a final top in 1973 leading to the 45% collapse in 1974 against the backdrop of Watergate. Protests, chaos, and scandals in the White House are not exactly a period when investors are going to feel “fuzzy warm” about investing in the stock market.
The revolving door at the White House, trade wars, tech woes, protests, the ongoing Mueller investigation, and the trials of Trump’s peccadillos. All of this makes for a toxic, chaotic environment. No wonder the stock markets are nervous.
Bitcoin watch!
© David Chapman
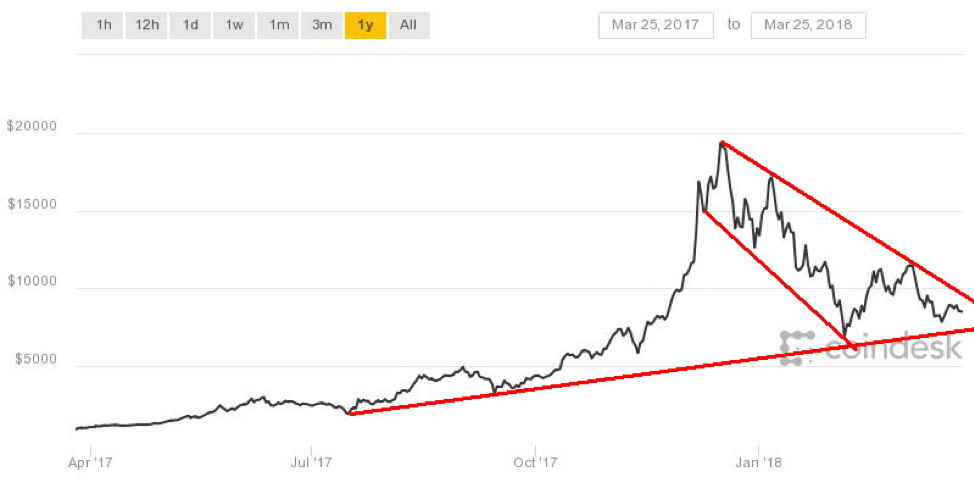
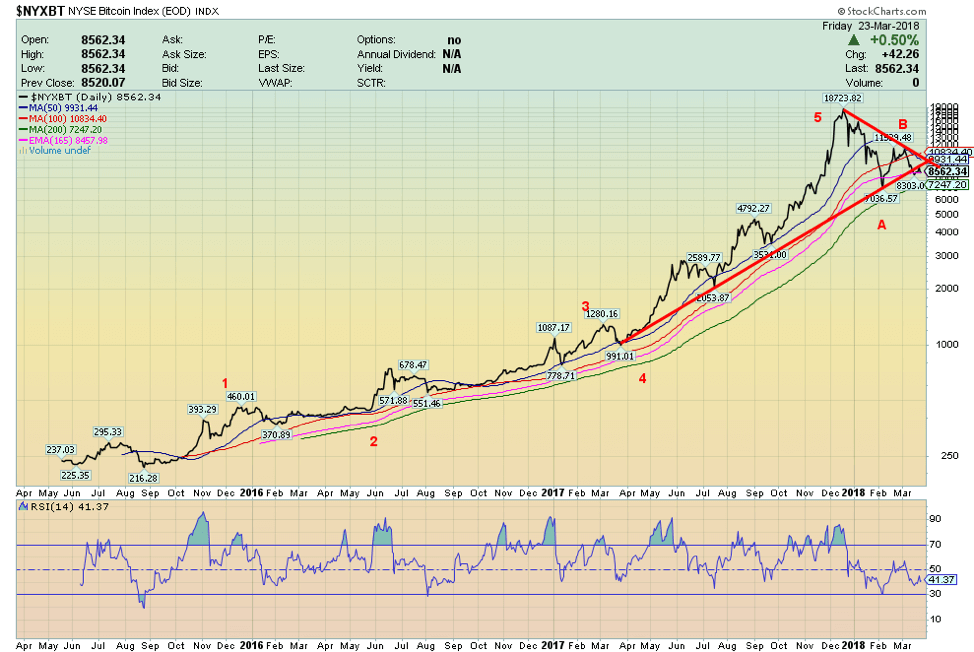
Bitcoin continues to trade in a range caught between $8,000 on the downside and $9,000 on the upside. This past week Bitcoin made an attempt to break back over $9,000. So far that has failed and Bitcoin appears to be headed for another test of $8,000. Earlier in the month and in late February Bitcoin had attempted to break over $10,000 and even got as high as $11,500 but the rally was not sustainable. Bitcoin seems poised to break back down under $8,000 and that implies another test of $7,000.
Not all cryptocurrencies are headed downward as some have made jumps this past week. Of top-ranked cryptos, with a market cap of $1 billion or higher, we note that the big gainer is a crypto by the name of ICON, up roughly 70% this past week. Out of well over 1,500 cryptocurrencies listed at Cryptocurrency Market Capitalizations, only 24 have a market cap of $1 billion or higher. Based on current prices, Bitcoin remains the largest with a market cap of about $146 billion. That is well down from its peak of about $324 billion.
Other big winners in the large-cap cryptos were EOS up 34%, TRON up 25%, and Qtum up about 21%. ICON is being hailed as the next big thing. The developers from South Korea see it as not just a coin like Bitcoin but as a connector that will effectively link the world and allow multiple governances to interact and transact with one another. Currently, there are about 387 million ICON coins outstanding and ICON has a market cap of roughly $1.5 billion. Unlike Bitcoin, it is not mineable.
But there are those who continue to hail Bitcoin as the next big thing. Jack Dorsey, CEO of Twitter believes Bitcoin will eventually supplant the US$ as the world’s currency. He believes the world and the internet will have one currency—Bitcoin. We are sure the world’s central banks will have something to say about that.
© David Chapman
We discovered that there is a Bitcoin Index listed as NYSE Bitcoin Index. This chart differs from the one at Coindesk in that it is end-of-day only. The Coindesk chart is constantly updating 24/7. This chart is plotted based on the closing price of Bitcoin at 4 p.m. New York time. It only covers Monday to Friday. The picture it presents is very similar to the one presented at Coindesk. Bitcoin appears to have completed five waves up topping in December 2017. The correction since then has traded down to the 200-day MA but thus far it is holding above it. This suggests that the bull market is still intact. Another breakdown under $8,000 and especially under $7,000 would, however, send Bitcoin into a full-fledged bear market. Not that it already wasn`t given that it is down 40% in 2018 alone and down about 55% from its December high. Technically significant damage has been done and it is not likely to be undone despite many Bitcoin bulls still suggesting it is only a matter of time before Bitcoin returns to the highs and moves above $20,000.
Markets and trends
© David Chapman
© David Chapman
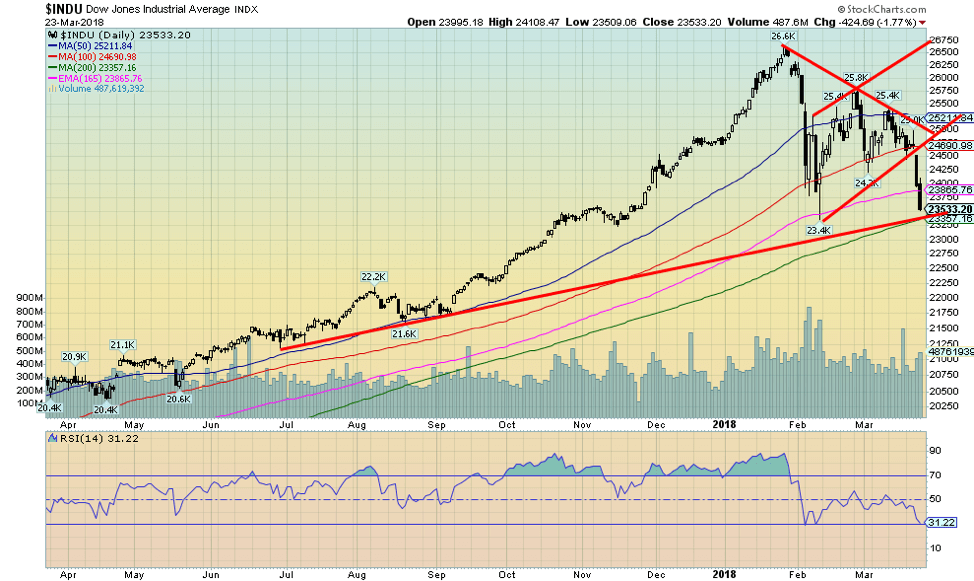
Over 1,100 points in the space of two days. That is what Trump’s trade wars brought. Oh yes, there was also the chaos in the White House with more turnover and the daily scandal sheet on Trump and his extra-marital affairs. Buried in there somewhere was the Fed hiking interest rates by 25 bp on Wednesday to 1.50%-1.75%. But that was widely expected so it was really a non-event. The stock market initially reacted positively to the Fed hike before giving up all of the gains later in the day. Following the initial trade wars plunge in early February the market appeared to be trying to recover. The Dow Jones Industrials (DJI) instead formed what appears as a bear flag. The flag formation has the potential to see the DJI fall to 22,160. That would break our support point at 23,250 and the low of February 9, 2018. It would also break the 200-day MA (currently at 23,357). It could also signal the end of the bull market that has been in place since March 2009. The market defines a bear market as a least a 20% drop from a high. That would not occur until the market fell to 21,290. That’s not that far from our potential 22,160 target.
Sentiment has fallen rapidly and the RSI is approaching 30, a level that would suggest the market is oversold and potentially due for a rebound. The 200-day MA could prove to be formidable as portfolio managers may wish to defend the level. Since March 2009, there have been only two significant corrections first in 2011 and then in 2015/2016. Those two corrections were both less than 20% at 16.8% and 14.5% respectively. One could say a more serious correction is overdue. In 2000 the DJI initially plunged almost 18% from its January 2000 top. The bottom was in March 2000 and over the next six months, the DJI attempted to regain those highs. Twice it came close but it ultimately failed and in 2001 the bottom fell out of the market.
In July 2007 the market topped, followed by a drop of only 10.7%. The market recovered and slight new highs were seen in October 2007. Then the bottom fell out in 2008. The market has now fallen to crucial levels. If it is to recover and at least make an attempt at regaining the January 2018 highs something needs to start soon. Timing-wise it appears early for the market’s bottom to fall out as we see that happening more into 2019 and 2020. But trade wars and chaos in the White House are not helping matters.
© David Chapman
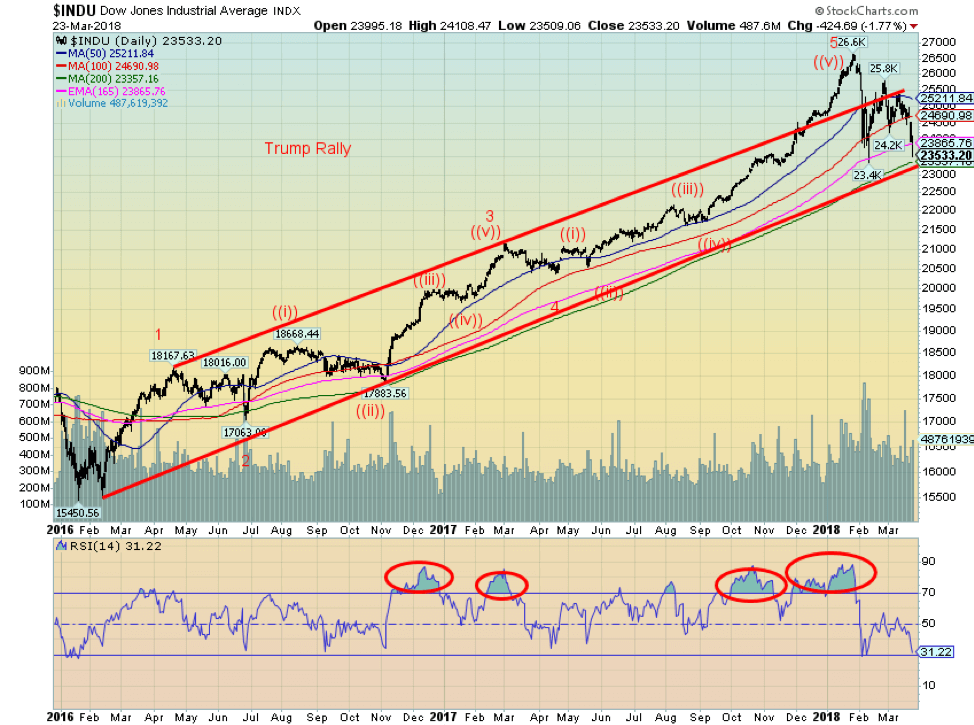
Here once again is the market from that now important February 2016 low. We believe that was the bottom of wave 4 in the bull market that began in March 2009. According to Elliott Wave International their wave count suggests the fifth wave top was in January 2018. If the market were to break down 20% from that high they would be proven correct. But even from a 20% decline a corrective wave would develop that could in theory take the DJI back towards its January 2018 high. But first we would need to find a bottom for the current decline. As noted the bear flag suggests a potential target of 22,160 and a 20% correction off the January 2018 top is at 21,190. The early part of this coming week will be crucial in determining whether the mini-panic that started on March 22, 2018 continues or that Friday proves to the climax. We suspect Friday was not the climax and we could once again see a sharp drop into the early part of this coming week. At that point an important low may be at hand. Note that volume has not been as high on this drop as it was earlier in February. That’s not unusual on the secondary decline and another reason we could be soon near a selling climax for this move down.
© David Chapman
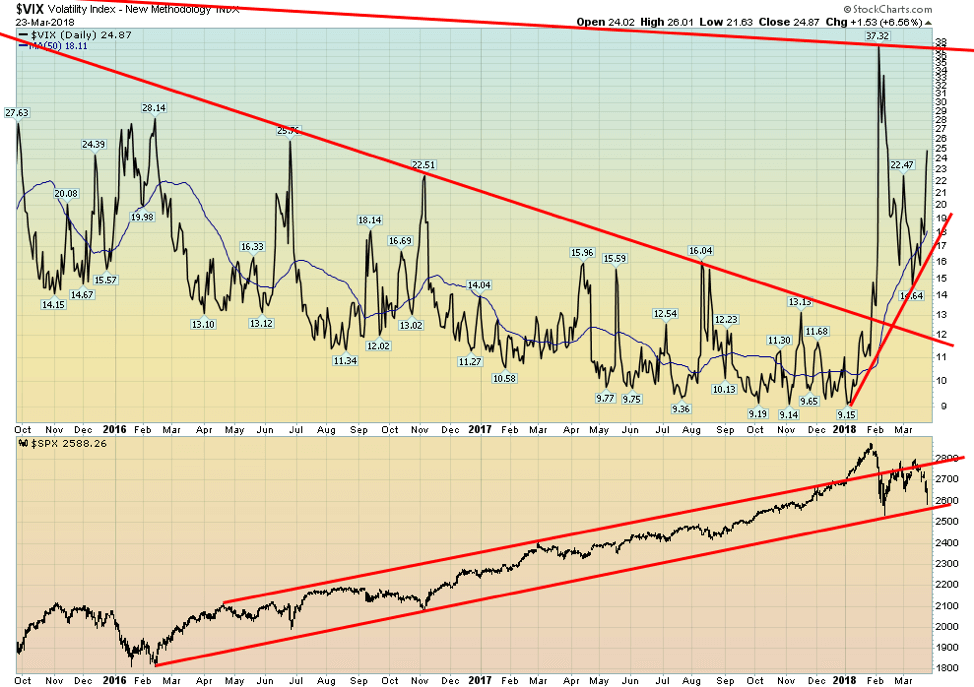
It is no surprise that volatility, as measured by the VIX volatility index, has soared. Following months of a VIX at or near record lows under 10, we had warned that volatility could suddenly turn and soar. And soar it did to a high of 37.2 on the plunge in early February. That is actually a bit less than what was seen in August 2015 when it hit 40.7. And it is well off the 67.2 seen in November 2008 following the crash that occurred with the collapse of Lehman Brothers. Typically, however, following a recovery and then another plunge to probably new lows for the index the VIX does not make new highs. This divergence typically sets up the low. Note how the S&P 500 is now just above its bull trend line from the March 2009 low. If our expectations of early next week are correct then we could see a plunge through that line signaling the end of the bull market. But once a selling climax is in place we could begin a multi-month recovery.
© David Chapman
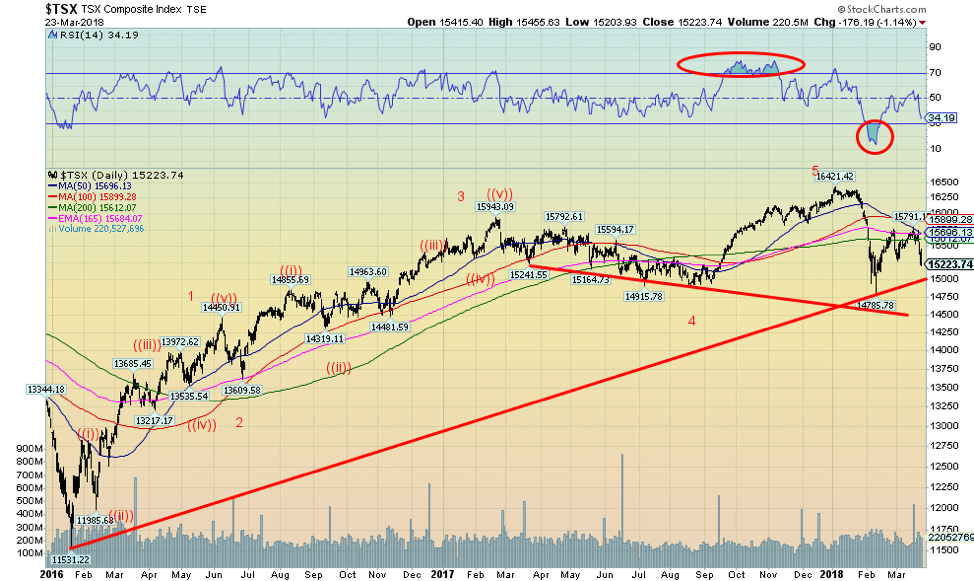
The S&P TSX Composite is largely following the U.S. markets to the downside. But the TSX Composite is supported by energy and material stocks and they were actually up on Friday even as other sectors fell. Hard hit this past week were consumer stocks, financials, industrials, telecommunications, healthcare, and technology. Holding up the market were golds, utilities, and income trusts, and to a lesser extent energy stocks. Real estate stocks were overall only off small. It is possible that the TSX Composite could hold that new uptrend line that currently is near 15,000. The TSX Composite is trading below its 200-day MA, a negative development. Overall, the TSX Composite was down just over 3% this past week. If the TSX Composite can hold the line near 15,000 then it is possible that a rebound rally could develop. A secondary level of support would not be seen until the TSX Composite fell 14,700 and 14,500. Major resistance is seen up at 15,800.
Chart of the week 1
© David Chapman
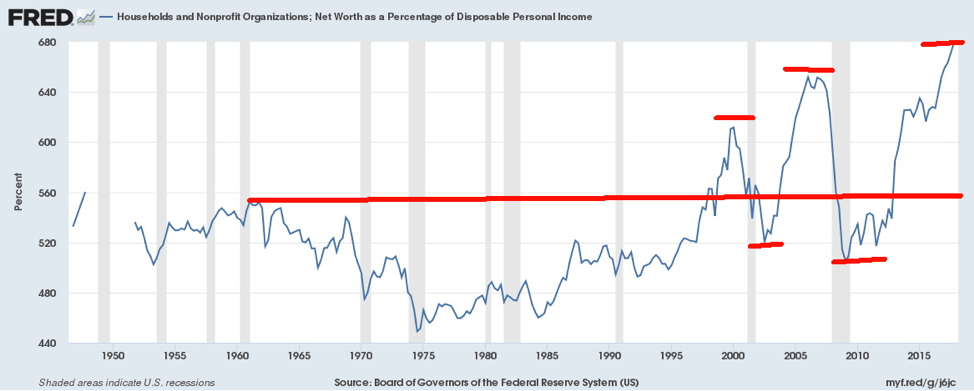
This is a rather interesting chart showing the ratio of household and non-profit organizations net worth as a percentage of disposable personal income. Throughout the 1950s the ratio never exceeded 560%. During the inflationary/recessionary 1970s and 1980s, it actually fell down to levels between 440% and 480%. It began to climb in the 1990s as the economic boom got underway. The 1990s was the decade of high technology and the internet. The 2000–2002 high tech/internet crash left them feeling a lot poorer but it really only fell back to levels seen in the 1950s. The housing boom of the 2000s restored their faith and by 2007 the ratio exceeded 640%. Incidentally, it was during that period that social networks such as Facebook came into being and the world was on the verge of becoming addicted to smartphones. The financial crisis crash of 2008 left everyone feeling poorer once again and it fell back to levels below what was seen in 2002. Then came an even bigger boom and the ratio has soared to almost 680%. We suspect that once again this ratio is at a historic high. The question is, how low will it go this time? The 1950s now seem rather quaint compared to the volatility seen today.
© David Chapman
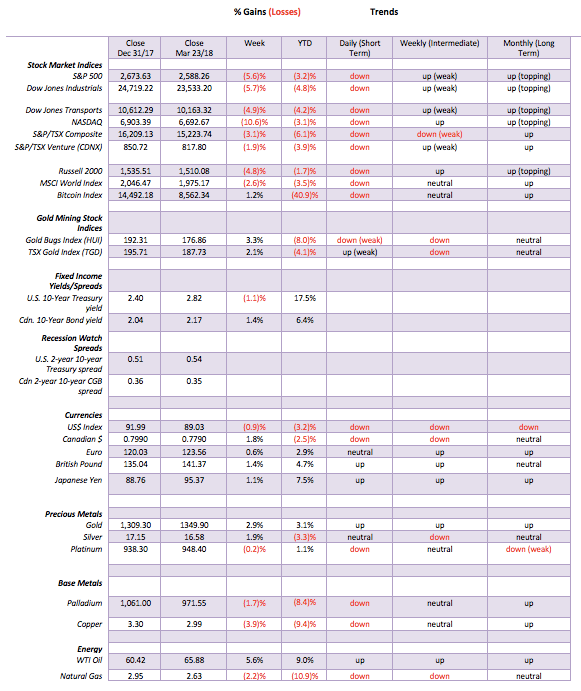
It comes as no surprise that the largest holder of U.S. debt is the Chinese with over $1.1 trillion in January 2018. Japan follows with roughly $100 billion less. In a total of $21 trillion of U.S. debt foreigners hold almost $6.3 trillion or almost 30%. After China and Japan, it falls off rather dramatically with Ireland holding the third largest at $327 billion. Seems Irish banks have a penchant for holding U.S debt as a safety measure. Same seems to go with Brazilian banks who come in at number four with about $266 billion. As we noted earlier for China it has been a quid quo pro of the U.S. buying Chinese goods and China buys U.S. debt. Except in a trade war, China buying U.S. debt could be vulnerable. The Chinese have hinted strongly before that they might stop buying U.S. debt. They might even sell some of their huge holdings. That, in turn, would put downward pressure on the US$ and could force the Fed to buy more U.S. debt even as they are trying to unload their huge portfolio. It could also put upward pressure on U.S. interest rates. The U.S. is quite dependent on others, particularly foreigners, to buy U.S. debt. Starting trade wars with the holders of this debt could prove to be dangerous.
© David Chapman
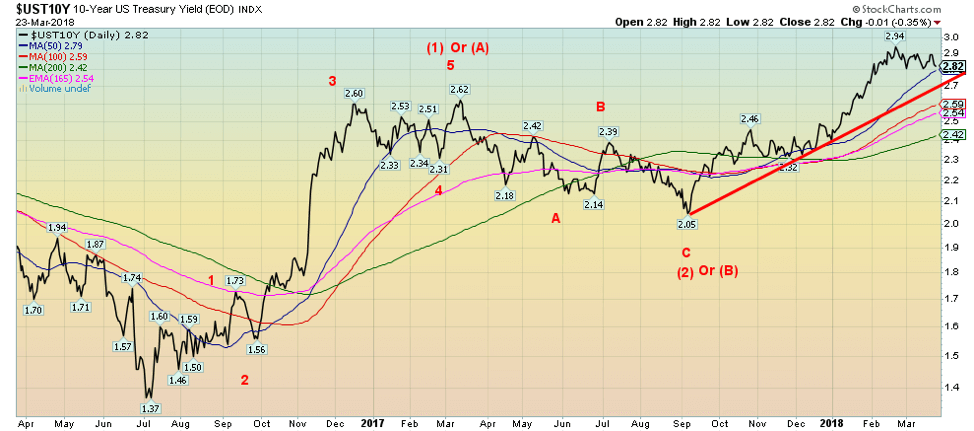
Despite the Fed hiking the key Fed rate by 25 bp as was expected this past week the U.S. bond market rallied as investors fled the plunging stock market to safety in U.S. Treasuries. The 10-year U.S. Treasury note fell to 2.82% this past week from 2.85% the previous week. We continue to have potential unfulfilled targets for the 10-year up near 3.20%. It could be that this is a fourth wave correction up from the low seen at 2.05% back in September 2017. One final wave up to our targets would fulfill a five wave up pattern.
© David Chapman
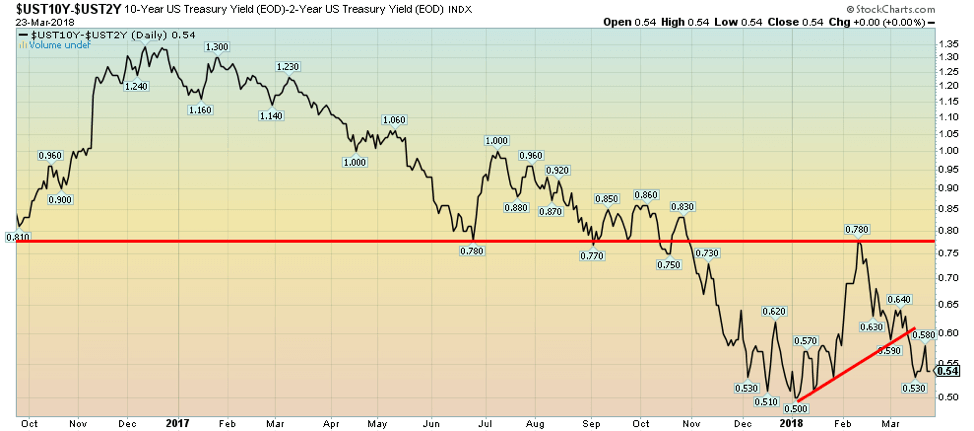
The 2–10-year Treasury yield spread was unchanged this past at 0.54%. With the Fed hiking the key Fed rate short-term yields rose. But long-term yields slipped as investors fled to U.S. bonds as the stock market plunged. While initially, the spread widened it fell back following the announcement of tariffs on China. The 2–10 spread is nowhere near recession levels that would normally see the spread negative as it was before both the 2000–2002 recession and the 2007–2009 recession. The trend, however, is to a narrowing 2–10 spread.
© David Chapman
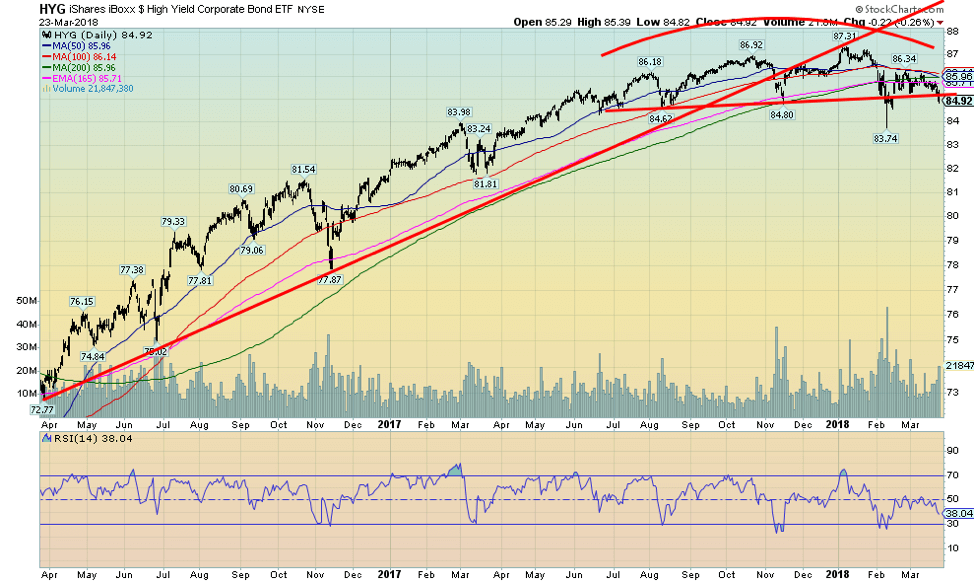
Keep an eye on the high-yield bond market. If there is a potential for blow-ups and bankruptcies it is here. This is the iShares IBoxx $ High Yield Corporate Bond ETF and it shows a market in the throes of breaking down. For months it formed what appears to be rounding top. Now it is breaking down. A decline to at least 80 could be underway. A similar pattern was seen through 2014/2015 before the market dropped 15% in early 2016.
© David Chapman
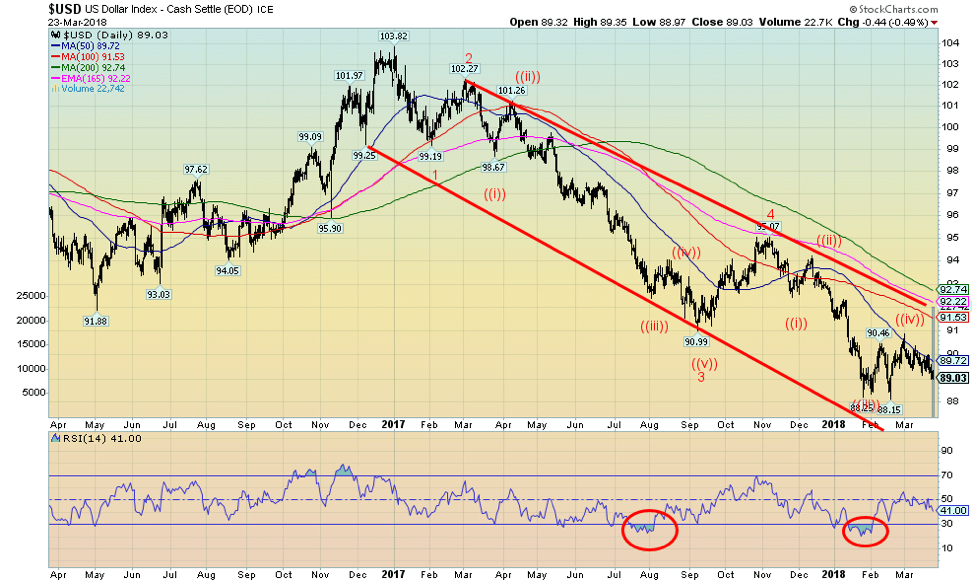
Is the US$ Index poised to break down? This past week’s background news particularly of trade wars is not particularly US$ friendly. The US$ Index fell about 1.3% this past week to 89.03, taking out some recent lows near 89.15. The Euro rose 0.5% but failed, at least for the moment, to take out comparable highs at 124.08. A small divergence with the US$ Index but it should be confirmed in the next week. The Cdn$ jumped 1.8% as Canada was exempted, at least initially, from the steel and aluminum tariffs. But they could loom again. The British Pound gained 1.4% while the Japanese Yen was up 1.1%. Many are looking at Trump’s trade wars negatively and seeing the U.S. as possibly the biggest loser. The low at 88.15 still lies ahead but once that low breaks then the US$ Index has potential targets down to 85.40. Trump, of course, could be pleased with that as it would make U.S. exports cheaper. But it is at the risk of importing inflation as imports become more expensive. Higher inflation could lead to higher interest rates which in turn could threaten high debt levels threatening a potential debt default and a subsequent stock market drop. It’s a vicious circle.
© David Chapman
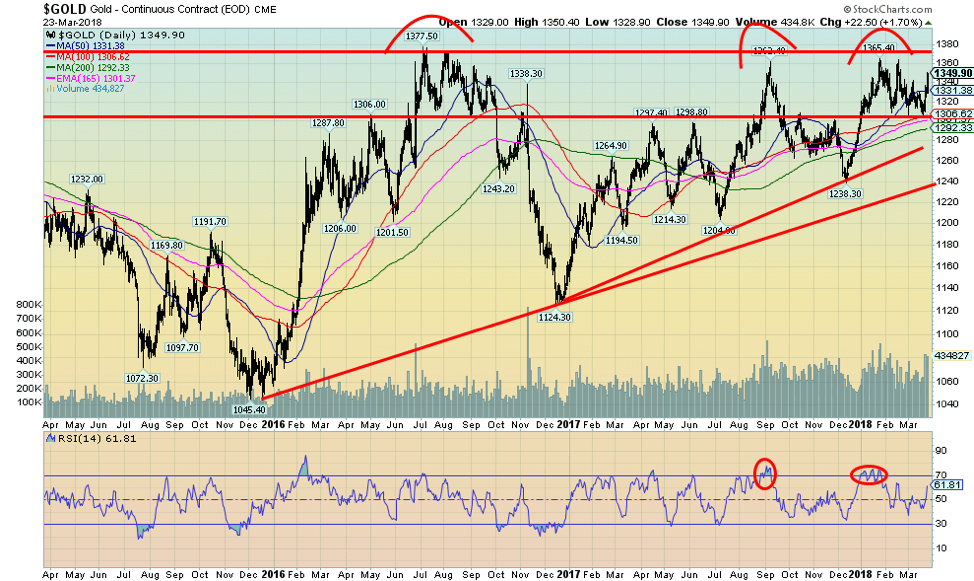
Trade wars, chaos in the White House, Trump’s peccadillos, the Mueller investigation—are they all coming together to finally move the price of gold? Gold prices jumped 2.9% this past week to close the week at $1,349.90 (futures)—one of the best weekly moves this year. Gold is now up 3.1% on the year against of the backdrop of the stock markets moving into the red. Gold is up 8% on the year. That is, of course, quoted in US$. In other currencies it is not quite as good. Gold in Cdn$ is up 4.1% over the past year, but in Euros gold is down 5.6% and it is down in British Pounds as well, off 4.6%. But in Japanese Yen it is up 1.2%. This is all a reflection of the weakness of the US$ over the past year against the backdrop of strength in the currencies relative to the US$. But if one goes back to the beginning of the current century the picture for gold is quite positive. Up 366% in US$, up 314% in Cdn$, up 279% in Euros, up 375% in Japanese Yen and up 433% in Pound Sterling. The S&P 500 on the other hand, is only up 76%. Yet according to many, gold is trash.
As we have noted in earlier commentaries, gold has tested the $1,350 to $1,375 zone three times since 2016: in July 2016 at $1,377.50, September 2017 at $1,362.40, and January 2018 at $1,365.40. This looks like formidable resistance. Gold has also been making a series of higher lows starting from what remains a very significant low in December 2015 at $1,045.40. Further significant lows were seen in December 2016 at $1,124.30, July 2017 at $1,204.90, and December 2017 at $1,238.30. Rising lows and a relatively flat top is in our opinion the classic definition of an ascending triangle.
Simple measuring techniques for an ascending triangle suggest that once the upper reaches of the triangle is broken it has the potential to rise to the height of the widest point on the triangle. A firm breakout on volume (volume is necessary) could project a gold price to about $1,710 while a minimum objective could be a rise to $1,630. From September 2011 to April 2013 gold formed what appeared to be a descending triangle, the exact opposite of the ascending triangle. The breakdown under the flattish bottom near $1,525 projected a move down to at least $1,124. We fell a bit further to $1,045. Many, however, did not recognize the descending triangle that was slowly forming (mea culpa) especially when gold made a slightly higher high in October 2012.
Naturally, all of this is dependent on gold not breaking to the downside. This past week gold rejected once again the $1,300 zone to the downside. A break under $1,290 could have swiftly taken gold down to $1,240 or even lower. Coupled with a positive commercial COT and growing negativity in the background that should favor gold we do appear poised for a potentially significant breakout. Investors would be wise to heed the warnings.
© David Chapman
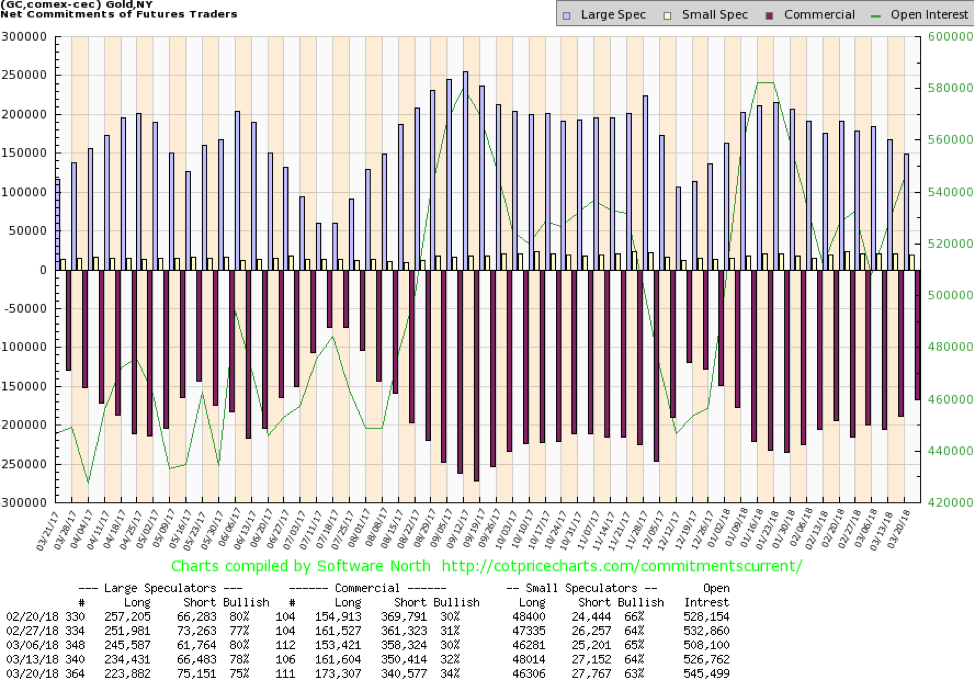
The commercial COT for gold improved to 34% from 32% this past week. While not spectacular, it is at least welcome as it shows that the commercials continue to add to long positions and cut their short positions. Long open interest jumped roughly 12,000 contracts while short open interest fell about 10,000 contracts. It was no surprise to see the large speculators COT (hedge funds, managed futures, etc.) fall to 75% from 78%. The large speculators COT added about 9,000 contracts to short open interest while cutting their long open interest by about 11,000 contracts. The COT report was tallied just before the jump in gold prices at the end of the week. Next week’s report will be as of March 27, 2018. While the commercial COT is not as bullish as it was, say, last July 2017 or even in December 2017 just before good up moves in gold prices it is nonetheless encouraging.
© David Chapman
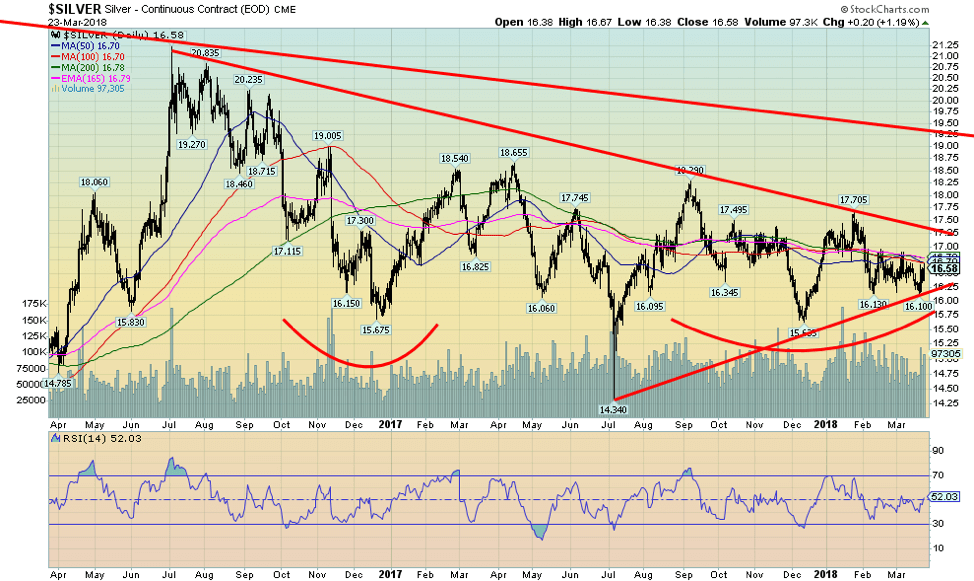
Despite the very positive COT report (see next) silver prices failed to ignite this past week. They did gain 1.9% but that lagged gold’s gain of 2.9%. Silver has considerable resistance above in the form of the converging 50, 100, and 200-day MAs that range from $16.70 to $16.80. Silver closed just below that level at $16.58. Further resistance can be seen at $17.05 and another band of resistance is at $18.00. The final band of resistance is at $19 to $19.25. So far, support seems to be holding at $16.10 to $16.15. Silver did make a small new low at $16.10, but given the quick rebound from that level, it amounted to a rejection of the zone. The formation over the past two years still appears as a somewhat awkward head and shoulders bottom pattern with the head at $14.34. The neckline of the pattern appears to be around $18. A breakout on volume could project up to at least $22.65 with an outside projection up to $23.75 once over $17.25. Naturally, all this is contingent on silver once again holding any pullback towards $16.10/$16.15. A break under that level could lead to a test of the December 2017 low of $15.64 and even the July 2017 low of $14.34. We highly doubt that scenario. As we note under the silver COT report the report overall is just too compelling to ignore.
© David Chapman
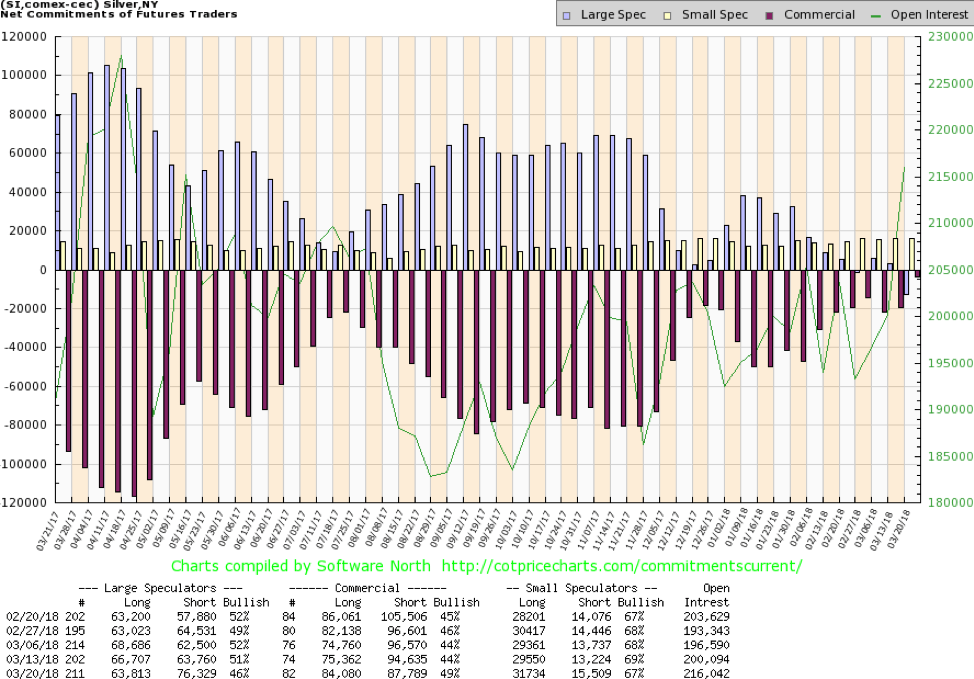
The silver commercial COT this week can only be described as a “wow.” We are not sure we have ever seen one as good as this week’s report was. The commercial COT for silver jumped to 49% from 44% this past week as long open interest jumped almost 9,000 contracts while short open interest fell about 7,000 contracts. A contract is worth 5,000 ounces of silver so a decline of about 7,000 contracts (actual was 6,846) is worth 34.23 million ounces of silver or a value at $16.50 of $564.8 million. It was said that J.P. Morgan alone offloaded about 4,000 contracts. On the other side, the large speculators continued a bearish stance as they unloaded about 3,000 contracts of long positions while adding to their short open interest by an astounding almost 13,000 contracts. The large speculators COT fell to 46% from 51% as a result. We have rarely ever seen the large speculators in a net short position. Still, they hold 63,813 long positions or the equivalent of 319.1 million ounces of silver worth about $5.65 billion. Overall, however, we call this week’s the most bullish we have ever probably seen. Now if it can only translate itself into a significant move for the price of silver. For an excellent, far more detailed report that we give on the silver COT see Ed Steer’s report, A Stunning Silver COT Report: One for the Ages. Either we will see a significant price move for silver or we are all being played for fools.
© David Chapman
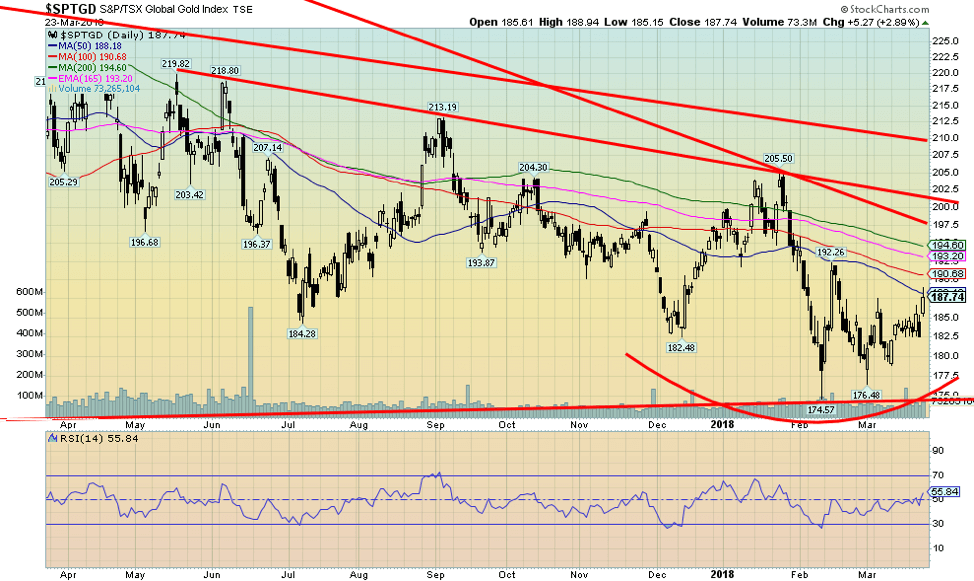
If silver prices have been frustrating the gold stocks have been even more frustrating. However, there was some light this past week as the both the Gold Bugs Index (HUI) and the TSX Gold Index (TGD) gapped higher on Friday. The HUI finished the week with a gain of 3.3% and the TGD was up 2.1%. Light at the end of the tunnel? Hopefully not a train. The pattern being formed for the TGD continues to appear as a bottoming pattern. But there is considerable resistance to chew through. The TGD closed at the 50-day MA this past week and above up to $195 is the 100 and 200-day MAs. Further resistance can be seen at 198 and 200 and finally up to 210. Only above 210 do we see a significant breakout taking place. The area between 172 and 175 appears to have offered solid support so that zone needs to hold on pullbacks. Since the low of 174.57 in February the TGD has been making higher lows. A firm breakout above 210 could see a sharp rise for the TGD up to 275.
Special chart of the week
© David Chapman
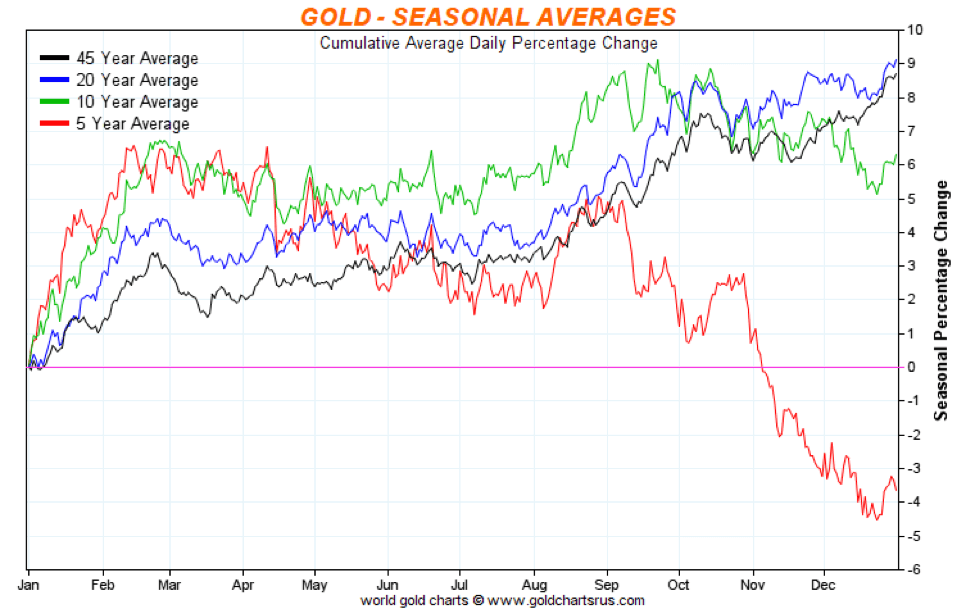
Seasonally the past five-year period has been miserable for gold especially in the September to December period. The 10-year average has been weakened by the five-year average but the 20- and 45-year average still show a positive return, generally from October to December and further into February. However, one period has consistently seen a bit of rise even if not a spectacular one. After peaking into February gold often pauses into March and even April. That has been the case this year with a top that came in a bit early in January and the recent weakness has hopefully seen a low in March. If past history proves correct we should see a positive bump for gold prices into April/May that could extend until July before another pullback gets underway. Even the five-year average of prices saw a bump from April into May before another pullback then a bump into July. Remember these are averages that can vary year to year. The key is that it follows the seasonals in direction, not necessarily in absolute price moves. This past week’s jump in gold prices could be the start of the breakout above $1,377 that has been long awaited.
—
DISCLAIMER
David Chapman is not a registered advisory service and is not an exempt market dealer (EMD). We do not and cannot give individualised market advice. The information in this newsletter is intended only for informational and educational purposes. It should not be considered a solicitation of an offer or sale of any security. The reader assumes all risk when trading in securities and David Chapman advises consulting a licensed professional financial advisor before proceeding with any trade or idea presented in this newsletter. We share our ideas and opinions for informational and educational purposes only and expect the reader to perform due diligence before considering a position in any security. That includes consulting with your own licensed professional financial advisor.


El Dorado Raises $9M to Expand Cross-Border Fintech Platform
El Dorado, a Latin American fintech improving cross-border financial services, raised a $9 million Series A led by Paradigm with...


Bitcoin Stalls Near $60K as Strategy Moves, ETFs Outflow, and EU MiCA Rules Take Effect
Bitcoin hovers near $60,000 with ETF outflows, while Strategy boosts reserves, sells BTC, and raises dividends to reassure investors. Ethereum...


Cannabis Dominates Global Drug Use: Trends, Risks, and Shifting Markets
Cannabis remains the world’s most widely used illicit drug, with 256 million users in 2024, surpassing all others combined. Growth...


Italy Approves First Hydrogen-Powered Train for National Rail Network
ANSFISA has approved Italy’s first hydrogen-powered train, the Alstom HMU214, for use on the Brescia–Iseo–Edolo line. Capable of 140 km/h,...


Cotton Market Weakness Persists Despite Brief Rebound
Cotton prices fell to new lows last week before a modest rebound. USDA data shows crop conditions remain worse than...
 |
|
 |  |
 |
|
-

 Fintech6 days ago
Talentir Secures €4M to Transform Global Payouts
-

 Cannabis2 weeks ago
WNBA Removes Cannabis From Banned Substances List in New CBA
-
 Markets1 day ago
Cotton Market Weakness Persists Despite Brief Rebound
-
 Cannabis1 week ago
Trulieve NYSE Listing Signals New Era for Global Cannabis Industry
You must be logged in to post a comment Login