Markets
US unemployment rate decreases, gold prices dropped last week
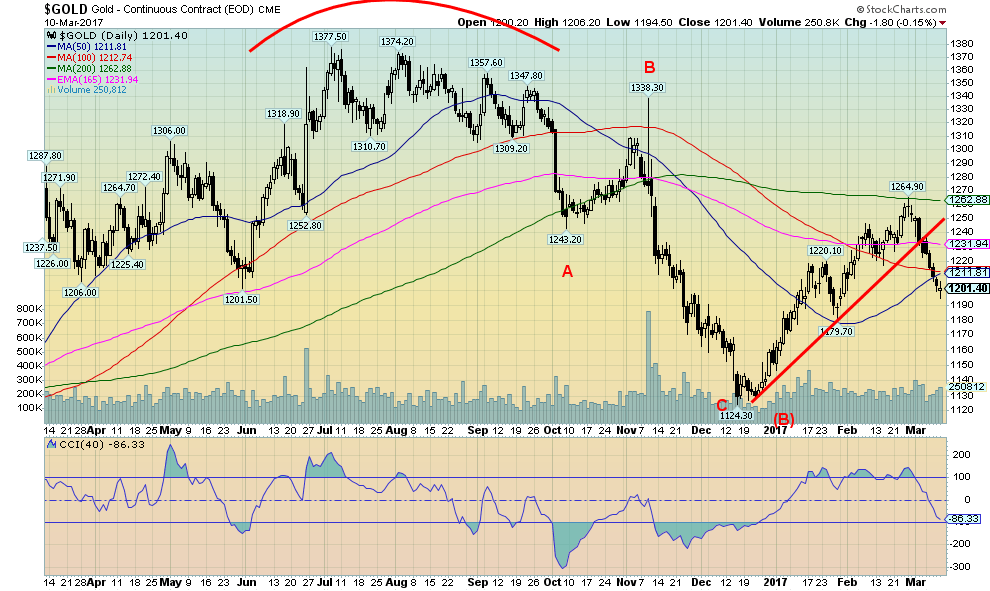
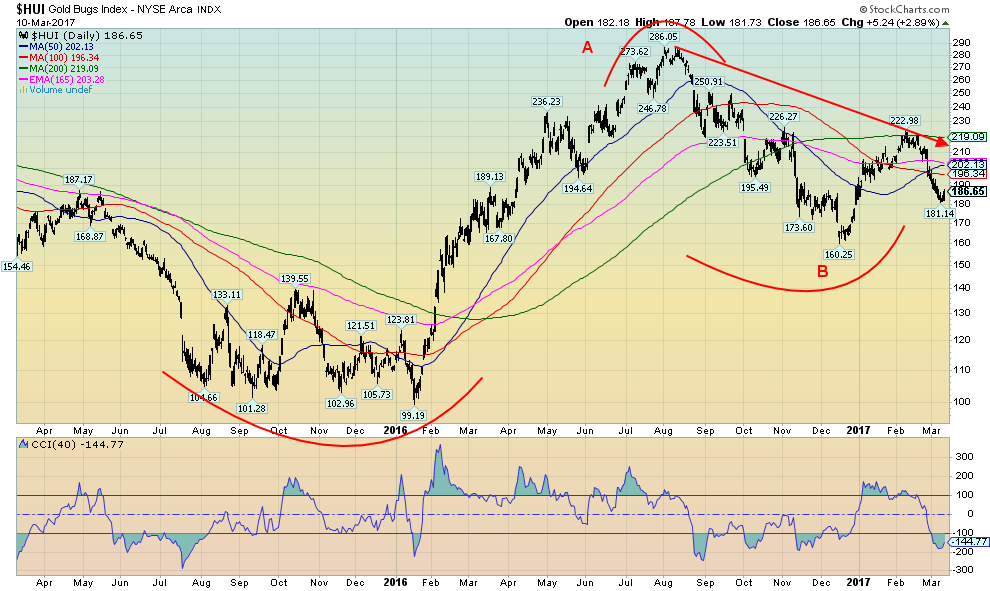
Gold also hit the 200 day MA before turning down. The drop since then has been swift driven by fear that the Fed is about to hike interest rates.

U.S. unemployment rate fell to 22.7% from 22.9%, which was caused by the rise in the labor force participation rate. Gold prices also decreased last week.
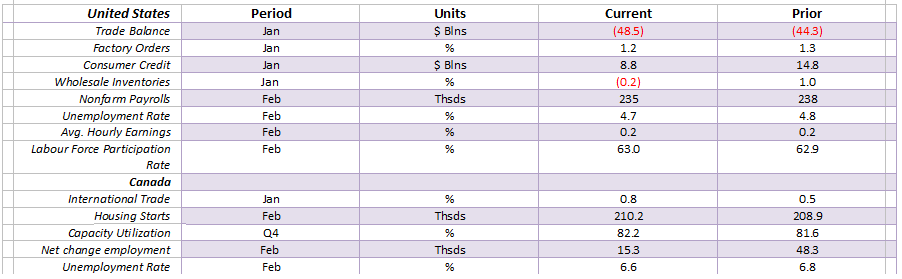
On Friday the February employment numbers were released and once again they surprised to the upside coming in with a gain of 235,000 following January’s revised gain of 238,000 up from the original report of 227, 000. The unemployment rate (U3) fell to 4.7% as more people job searched. The labor force participation rate rose to 63% from 62.9%. That helped lower the U6 unemployment rate as well as it fell to 9.2% from 9.4%. Shadow stats that adds in long-term unemployment and those defined out of the labor force as determined back in the 1990’s, fell to 22.7% from 22.9%. All in all, it was what many called an upbeat report. The stock markets rebounded.
Interestingly the headline nonfarm payroll number counts each part-time job as an employed individual even if they are counting the same individual twice. The separate household survey noted a jump of 260,000 multiple jobholders for February. The two series are not, however, comparable and therefore it is hard to compare them. Nonetheless, it is interesting.
Even as the Shadow Stats unemployment number fell to 22.7% from 22.9%, we are reminded that 94.4 million are considered to be not in the labor force. Of the current labor force of 152.2 million, some 18% are considered to be part-time workers. On an adjusted basis to account for population growth, the labor force in 2000 was actually higher at 155.4 million. And there were fewer part-time workers. Of the 94.4 million considered to be not in the labor force 50.6 million are retirees. Others considered to be not in the labor force are those with disabilities (6.1 million), stay at home parents (5.1 million) and students (6 million). That still leaves 26.6 million a veritable army. In the US, 42.6 million are considered to be living in poverty (13% of the population) and the same number is food stamp recipients. Despite Obamacare 31.4 million Americans are still without health insurance.
Of the other employment numbers, average hourly earnings rose 0.2% the same as January and the average work week remained unchanged at 34.4 hours. Median income today is $30,129 vs. median income adjusted for inflation in 2000 was $28,976. Real median household income in the US is $56,516 vs. $57,790 in 2000. Wages have largely stagnated since the 1990’s. However, the share of the 1% and even the 20% has grown considerably.
Model Portfolio
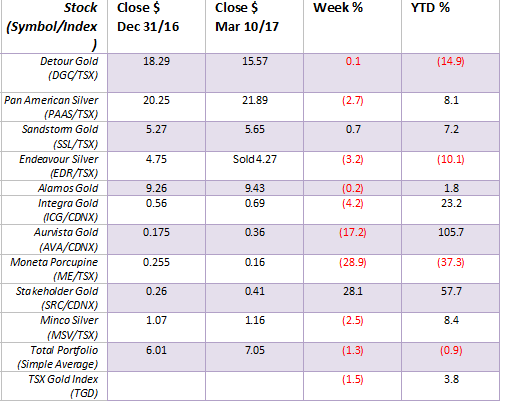
While it was a better week for the portfolio then the previous one it was still a down week. It also swung the overall performance to down on the year just under 1%. Stakeholder Gold (SRC) enjoyed a good up week. As we noted the previous week we took our lumps on Endeavour Silver (EDR). We will add something else in due course. Aurvista (AVA) pulled back but is still up over 100% in 2017. The weak sister right now is Moneta (ME). It was sparked apparently by a negative report even as they intersected gold that extended known gold mineralization several kilometers along the strike from an existing 43-101. Moneta presents a potential buying opportunity at these levels.
© David Chapman
MARKETS AND TRENDS
© David Chapman
Note: for an explanation of the trends, see the glossary at the end of this article.
New highs refer to new 52-week highs.
Key Economic Numbers Week March 6 to March 10, 2017
(Source)
(Source: www.shadowstats.com, www.data.bls.gov, www.statcan.gc.ca, www.tdeconomics.com)
Note: % M/M unless otherwise noted
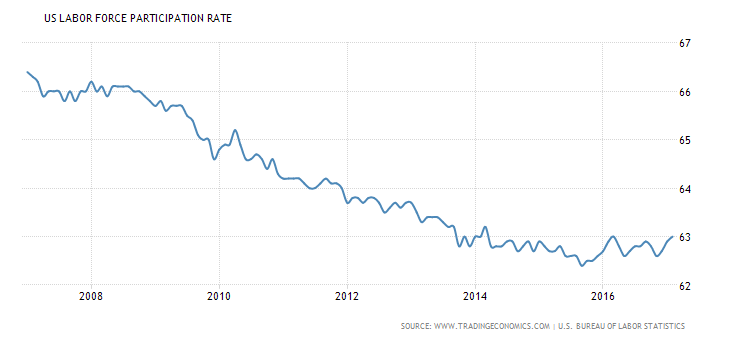
The chart above shows the US labor force participation rate. The February rate was 63% up from 62.9% the previous month. That means that more people entered the labor force and were looking for work. It is at its highest level since March 2016. It was last over 63% back in September 2013. Nonetheless, it is a far cry from the 66% reported in 2007 prior to the financial crisis and crash of 2008.
(Source)
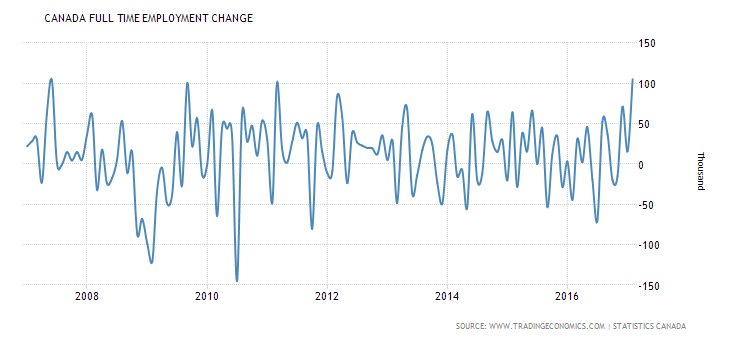
Job creation in February for Canada was apparently gangbusters. It was reported that the number of jobs grew by 15.3 thousand in February and the unemployment rate fell to 6.6% from 6.8%. Even better, it was reported that the number of full-time jobs grew by 105.1 thousand the best one-time month’s growth in over a decade. That meant that the number of part-time jobs fell 89.8 thousand in order to come up with a net increase of 15.3 thousand. All this came against the backdrop of an almost 10% drop in WTI oil prices. Despite the upbeat jobs report the BofC is not expected to hike interest rates at next month’s meeting nor will they knee-jerk react if the Fed decides to hike rates on Wednesday, March 15, 2017. Canada’s labor force participation rate fell to 65.8% from 65.9% and that helped lower the unemployment rate. One of the best improvements for the unemployment rate was a fall in youth unemployment (ages 15-24) as it fell to 12.4% in February from 13.3% in January. From 1976 to 2017, youth unemployment has averaged 14.1%. The lowest was in July 1989 at 10.4%.
(Source)
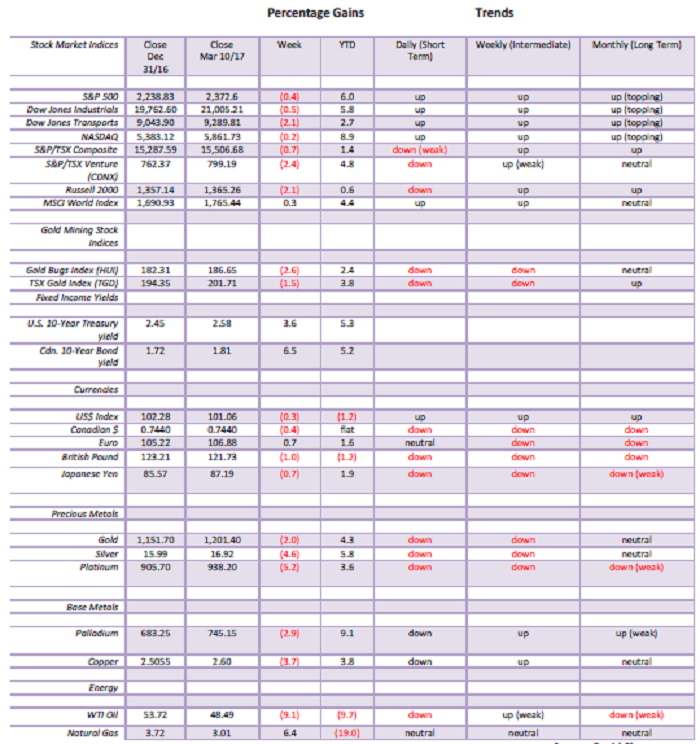
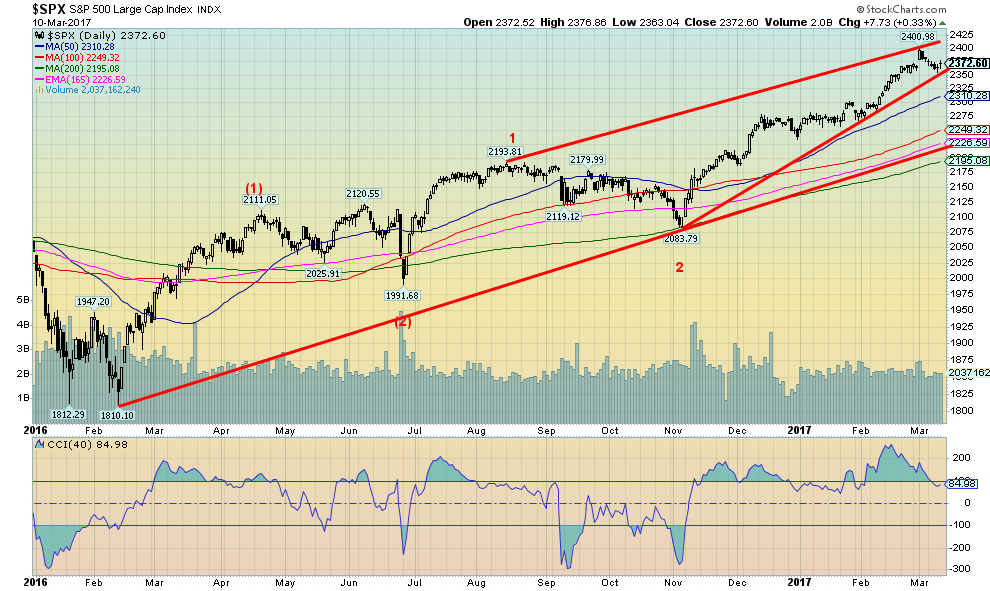
After closing higher almost continually starting back on February 8, 2017, the stock markets have faltered over the past week. The S&P 500 and the other indices recorded their first weekly loss since late December 2016. We continue to believe that we are in the throes of a fifth wave to the upside and believe that intermediate waves (1) and (2) are complete starting with the February 2016 bottom. We believe we are now in wave 3 of (3). That suggests that once we have a 4th wave correction there should be one more wave to the upside. That could take us into the summer. The current wave is getting long in the tooth and a sudden sharp correction could occur at any time. With six consecutive days to the downside, it is possible that the 4th wave correction is getting underway. That is assuming the top at 2400 seen on March 1, 2017. With the Ides of March upon us and so many things happening that could go wrong this coming week the odds increase that a drop could occur especially against the backdrop of high sentiment. A drop below 2,350 should send the S&P 500 down to 2,300. A more serious correction could develop under 2,250 and 2,200.
(Source)
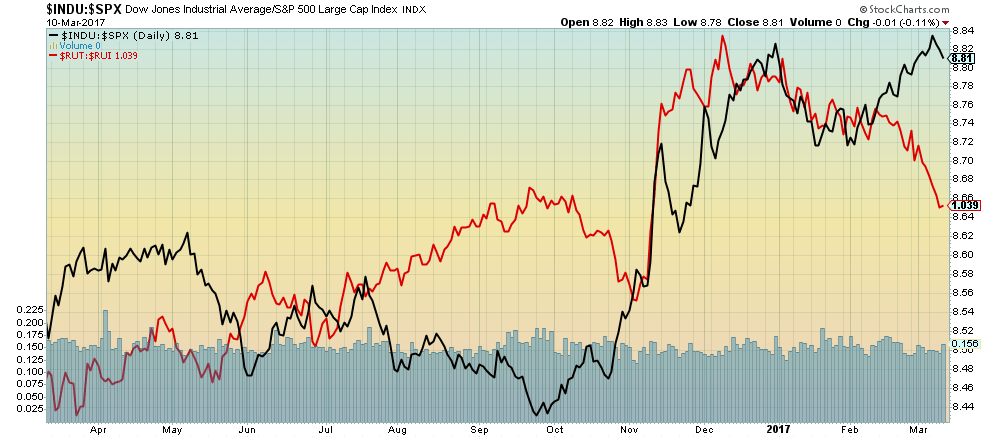
This is an interesting chart in that it is meant to show the relative performance of large cap stocks vs. small cap stocks. The black line represents the ratio of the Dow Jones Industrials (DJI) and the S&P 500 (to represent large cap stocks) and the red line, which is the ratio of the Russell 2000 with the Russell 1000 (to represent less liquid small cap stocks). The small cap stocks have been deteriorating since topping on December 8, 2016. The large cap stocks, on the other hand, after faltering through to early February began another sharp ascent. They may have topped a few days ago on March 7, 2017 making a slightly higher high than the one seen on December 30, 2016. What this suggests to us is that the market is bailing on the more speculative small cap stocks even as they continued to buy the large cap stocks.
(Source)
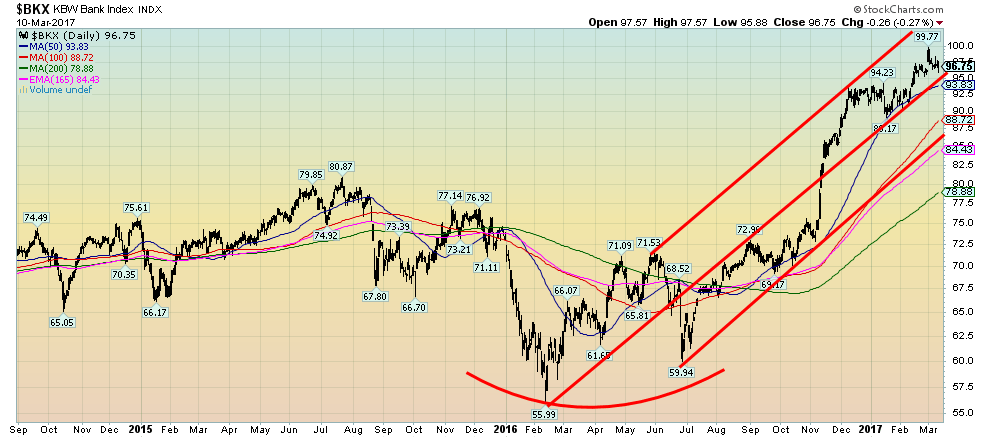
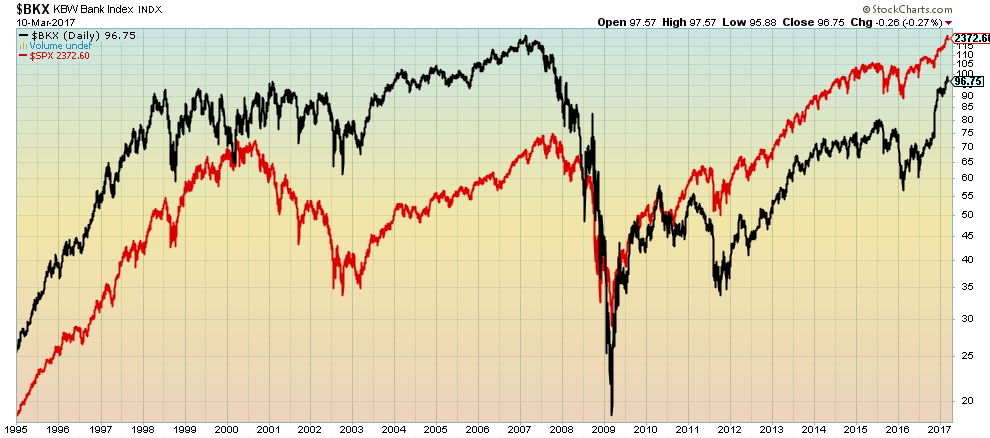
One of the hottest sectors that have helped to drag markets higher has been banks. This is the KBW Bank Index. It is up 72% from its lows in 2016.But rising interest rates could, in the end, be fateful for banks.
(Source)
But we do need to keep things in perspective. As powerful as the rally has been for banks since early 2016 a reminder that they remain below their highs of 2007 while the S&P 500 has made new highs. During the 2008 financial crash, it was banks that led the way to the downside. Also, banks remain vulnerable to a debt crisis.
(Source)
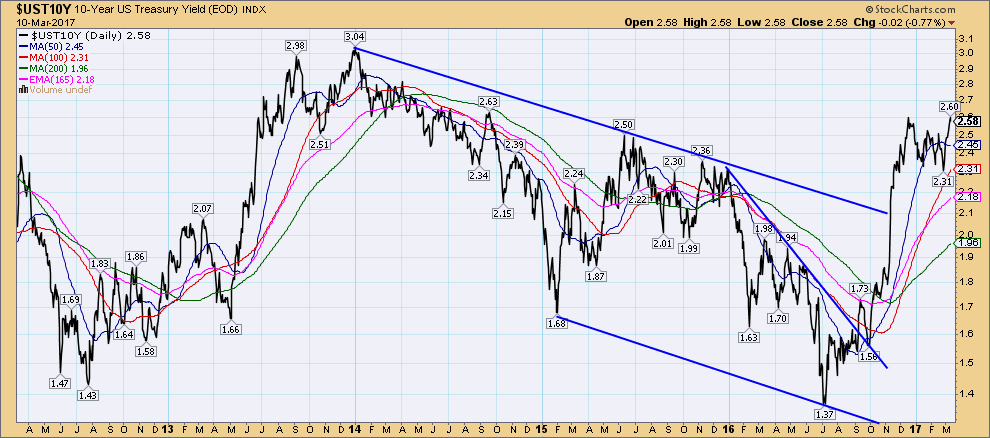
The US 10 year Treasury note hit its highest level since September 2014 closing at 2.58% this past week following a high of 2.60%. The 10-year note also hit 2.60% in December 2016. As we had noted for the past few weeks our sense coupled with the thought that we are in the throes of making a potential 3-year cycle low in bond prices (high in yield as prices move inversely to yields) with the last low (high yield) seen in late 2013. As we had noted previously as well we believe the next six-year cycle low in bond prices is due in 2019. The six-year cycle tends to break down into 2 three year cycles or 3 two year cycles. This appears to be a breakdown into 2 three year cycles.
The market hasn’t bottomed yet but could anytime. With WTI oil prices falling sharply this past week that might be a catalyst. Interest rates have been rising on the fear that the Fed will hike rates. Maybe they won’t and that too would cause bond yields to fall once again. Expect some volatility this week in bond prices. A reminder as well that the debt ceiling comes off on March 15 as well.
(Source)
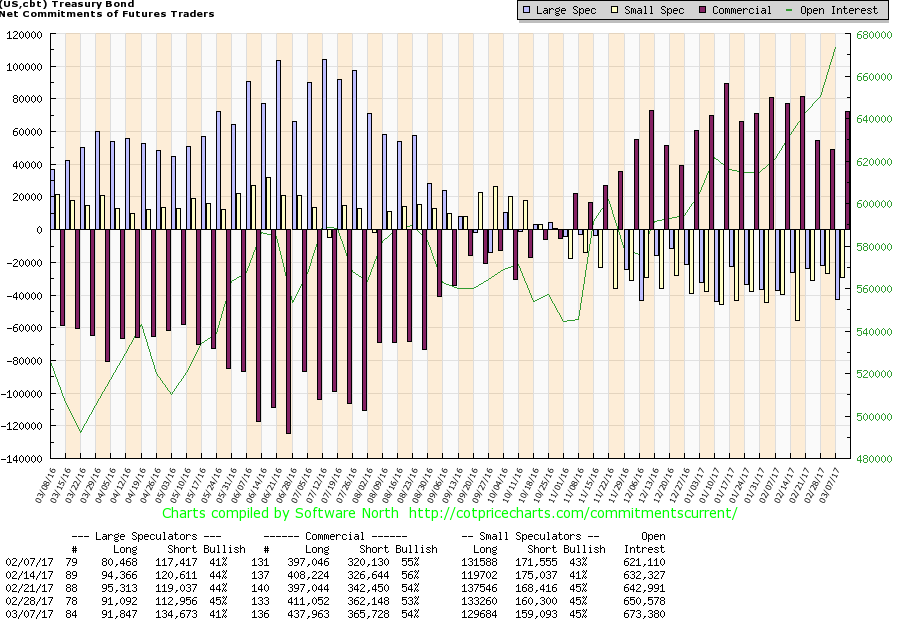
It should come as no surprise that the large speculators COT (hedge funds, managed futures etc.) is at its lowest level in weeks with only 41% bulls. On the other hand, the commercial COT is at 54% and it has been high and rising for weeks. Great combination. Speculators getting short and wrong at a bottom with the commercials getting long once again. The commercials are most likely anticipating a low and a subsequent rally.
(Source)
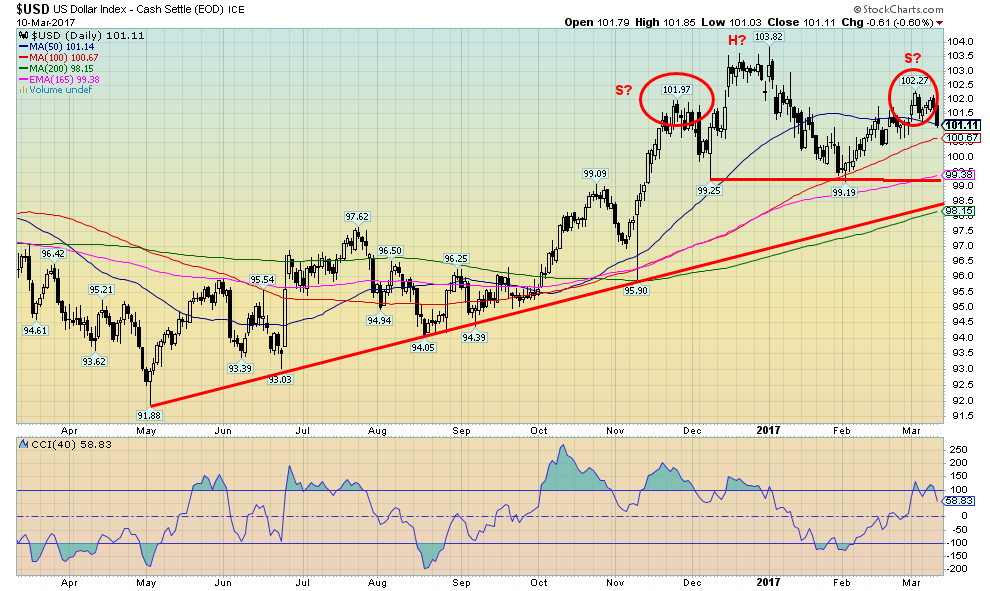
Despite the fact that we made a recent high of 102.27 taking out the what we thought might be a left shoulder high of 101.97 back in November 2016 the thoughts of a head and shoulders top for the US$ Index remains alive. Despite the strong jobs number on Friday the US$ Index instead of going up actually fell 0.6% on Friday we are sure catching a lot by surprise. So is a top in? Well, we can’t tell yet. It remains possible that the US$ Index still has sufficient to rise towards our long held 106-108 objective zone. But the Friday drop against the backdrop of what should have been good news for the US$ caught us by surprise. Trump would be pleased, as he wants a lower US$. But then maybe all the negative activity in the background with Trump including the ongoing Russian hacking investigation and demands for an investigation of Obama wiretapping and the potential for a growing clash in the US Justice Department is starting to leave a few with cold feet about the US$. Coming up is the debt ceiling and if it becomes rancorous as it has in the past that could also weigh on the US$. There has also been a talk of a Trump accord similar to the Plaza accord way back in 1985 to bring down the value of the high US$ at the time. Still, the breakdown zone is just above 99. Still, a way to go to get there and Friday closed on 50-day MA support. Regaining 102 would be positive for the US$ Index.
(Source)
Almost as if on cue, gold topped on February 27, 2017, just in front of the annual PDAC meeting. Gold also hit the 200 day MA before turning down. The drop since then has been swift driven by fear that the Fed is about to hike interest rates. But a funny thing happened on Friday following the release of the nonfarm payrolls and unemployment numbers. While the market treated it has another sign that the Fed should hike rates on March 15, 2017. The odds are now 80% that the Fed will hike. But instead of falling further gold prices reversed and closed higher off the lows. The cash market followed through following the close of futures and moved even higher. The low on Friday at $1,194.50 was 50% of the entire move from the low of $1,124.30 to the recent high of $1,264.90.
Could that be signaling a low for gold? Obviously, we won`t know immediately. It could also be the first wave down of a possible ABC type correction and that following a rebound there is a test of the recent low. However, given the upcoming events of the FOMC, the debt ceiling and the Dutch elections odds could favor a revival of the recent up move for gold. Regaining above $1,230 would be a positive sign and might suggest that a low is in. There is a bit of resistance at $1,210 to $1,215 but above that, a run to $1,230 is probable. Only a drop back under $1,194 could target down to next good support at $1,175 to $1,180.
(Source)
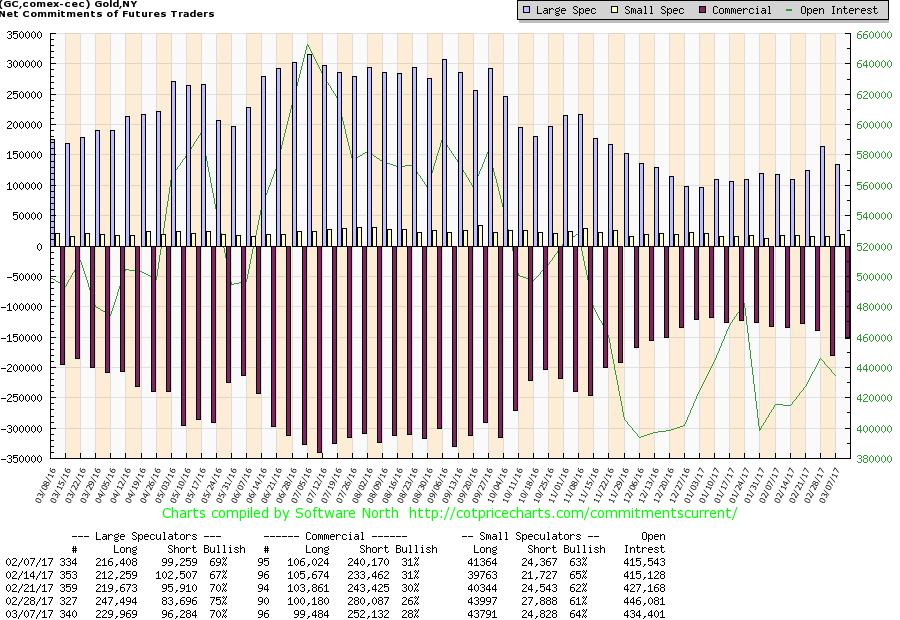
Maybe it is not a surprise that with the selloff in gold prices to just below $1,200 this past week that the commercial COT rose from 26% to 28%. That tells us that the commercials were covering their shorts. Short open interest fell to 252 thousand contracts from 280 thousand contracts the previous week. At the other end, the large speculators COT (hedge funds, managed futures) was at 70% down from 75% the previous week. Are the large speculators always wrong at tops and bottoms? Seems that way.
(Source)
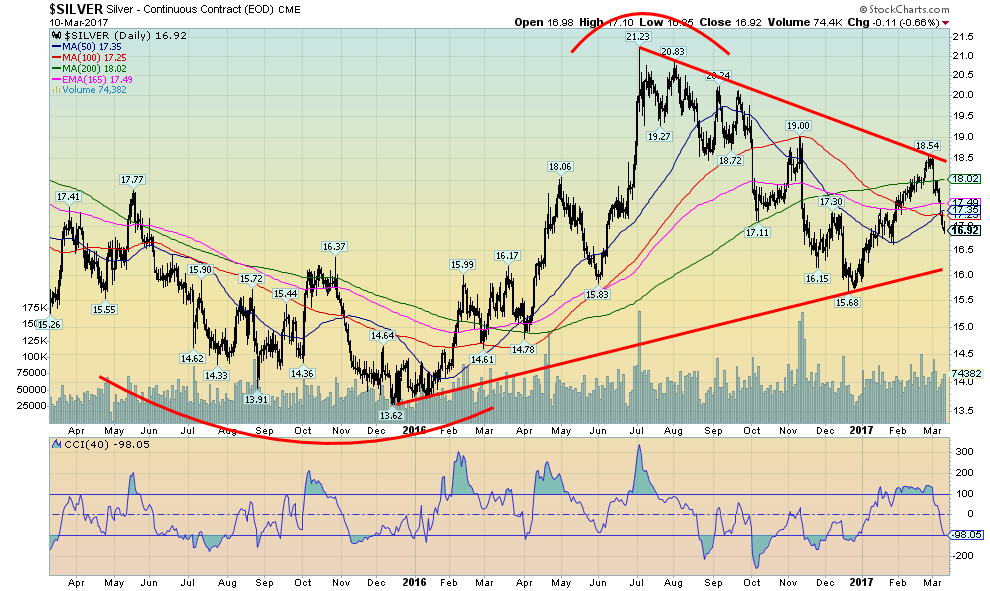
Silver followed the same path as gold with a sharp move down but following the release of the employment numbers silver steadied and came back. On a cash basis, silver closed back over $17. With a low of $16.85 on Friday, it was just above the 50% retracement ($16.77) of the recent move to $18.54 from $15.68. Sentiment towards silver (and gold) has quickly become negative. If silver were to fall further the next good support is down at $16.50. Below $16.35 odds shift to new lows below $15.68. Above $17.40, things begin to look up and a run to $18 is possible. Above $18 odds are new highs would be seen.
(Source)
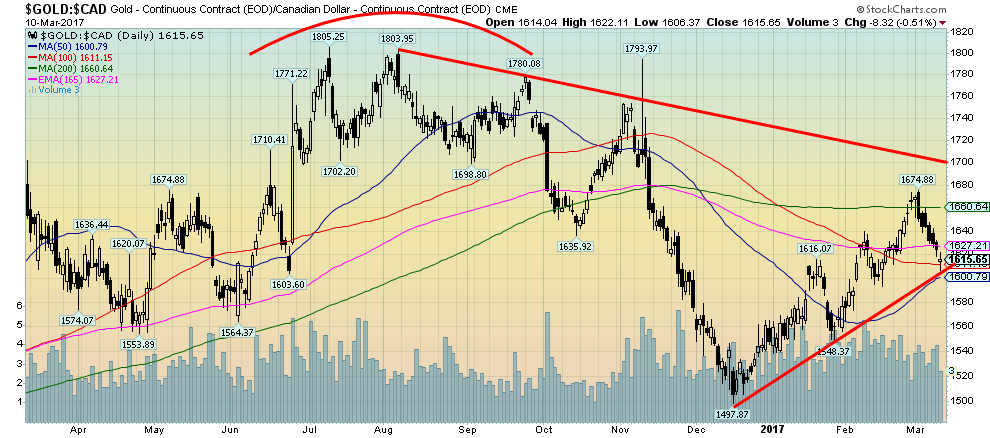
Gold in Cdn$ has also fallen but in looking at its chart the drop has not been as severe as gold in US$. It helps that the Cdn$ has also fallen in value against the US$. With a low of $1,606 gold in Cdn$ has retraced just below the Fibonacci 38.2% retracement point. It has also held the recent uptrend line and is currently on support of the 100 day MA. Gold in Cdn$ remains down 15% from the highs of 2011 vs. down 37.5% in US$ terms. The Cdn$ has fallen 30% against the US$ since 2011.
(Source)
Gold stocks as represented by the Gold Bugs Index (HUI) has also taken a hit recently. The retracement thus far is 66% of the move from 160.25 to the recent high of 222.98. Note the high hit the 200 day MA before turning down. Not only did the gold stocks make a new this week they reversed on Friday and closed higher on the day a positive development. The gold stocks tend to lead both up and down so hopefully the positive close on Friday leads to higher prices. Regaining above 200 would be a positive development. The key area to take is above 220.
(Source)
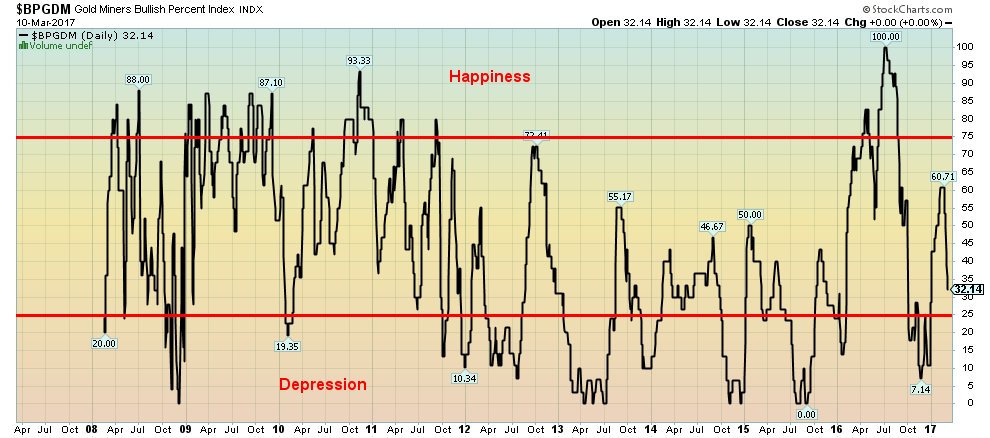
Sentiment indicators are quite useful in that they can define areas of extreme bullishness and extreme bearishness. We have labeled this one instead “happiness” and “depression”. That often seems to be the way it is in the gold market. The recent drop in gold prices and the gold stocks has moved the sentiment indicator down even as it remains in neutral territory. At the recent high it was well short of moving into happiness territory. Note the reading of zero seen back in August 2015. That reading is one of the lowest we have ever seen and indicated that there wasn`t a gold bull to be found. It was the opposite at the high in July 2016 when it recorded 100. That meant there wasn`t a bear to be found. Both were wrong.
(Source)
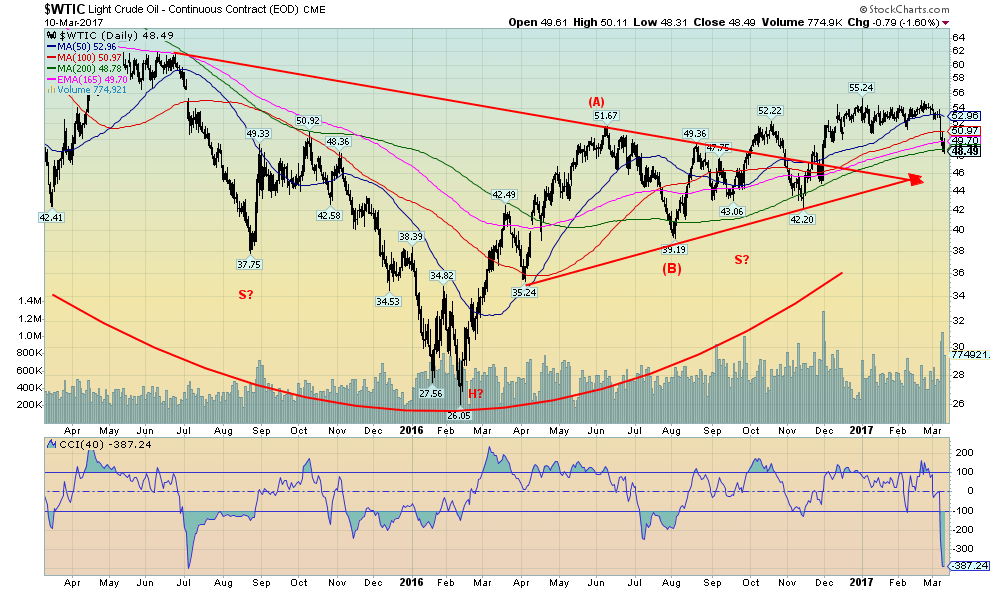
Have oil prices topped out? That was quite a hit this past week as WTI oil fell 9.1%. The fall was triggered by the US oil storage report that showed a big jump of 8.2 million barrels reaching the highest level on record going back to 1982. US oil production is back over 9 million barrels a day and the number of rigs has jumped by 135 since the beginning of December 2016. All this news was offsetting the OPEC production cuts. Generally, numbers have shown that the OPEC nations have largely adhered to the agree upon cuts but that Non-OPEC countries have not been anywhere as vigilant. Nonetheless, the big jump in storage is now offsetting the so-called production cuts and the worry is that once again the world is going to be oversupplied.
The chart is looking as if it has now completed an ABC type correction. What we thought might have been a large head and shoulder is now not looking too good. If WTI oil were to fall below $40 once again we could see the specter of new lows below $26.05 seen last February 2016. And the current period is usually one where we see strong energy prices.
There is support here in the $48 range and the market has become quickly oversold but a break below $46 could send WTI oil down towards $40. Only a move back over $53 currently might lead to higher oil prices.
Energy stocks were hit as well as the Oil & Gas Index (XOI) fell almost 3% this past week and is now down 10% from its recent high while the TSX Energy Index (TEN) fell 2.3% on the week and is down 14.7% from its December 2016 high.
(Source)
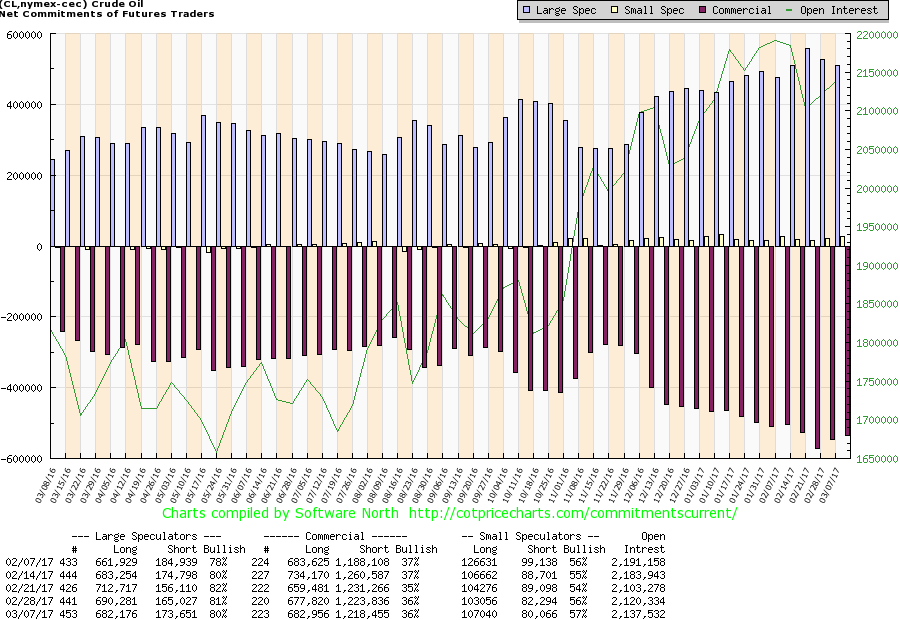
Maybe it should have been no surprise that the large speculators COT (hedge funds, managed futures) had been in the 80% plus level while the commercial COT was down to 36%. For weeks now the commercial COT has been falling as the large speculators COT has been rising. Crude oil speculators were near all-time highs.
Lower oil prices could eventually weigh on bond prices and drag them higher (yields lower as yields move inversely to prices) if the perception is that lower oil prices might actually be a drag on the economy.
GLOSSARY
Trends
Daily – Short-term trend (For swing traders)
Weekly – Intermediate-term trend (For long-term trend followers)
Monthly – Long-term secular trend (For long-term trend followers)
Up – The trend is up.
Down – The trend is down
Neutral – Indicators are mostly neutral. A trend change might be in the offing.
Weak – The trend is still up or down but it is weakening. It is also a sign that the trend might change.
Topping – Indicators are suggesting that while the trend remains up there are considerable signs that suggest that the market is topping.
Bottoming – Indicators are suggesting that while the trend is down there are considerable signs that suggest that the market is bottoming.
—
DISCLAIMER: This article expresses my own ideas and opinions. Any information I have shared are from sources that I believe to be reliable and accurate. I did not receive any financial compensation in writing this post, nor do I own any shares in any company I’ve mentioned. I encourage any reader to do their own diligent research first before making any investment decisions.


Morocco’s Growth Holds at 4.6% as Agriculture Offsets Economic Pressures
Morocco’s economy grew 4.6% in Q1 2026, driven by a strong agricultural rebound offsetting declines in industry. Services expanded moderately...


Abivax Shares Surge as New Trial Data Eases Safety Concerns Over Ulcerative Colitis Drug
Abivax shares surged nearly 36% after positive updated trial results for its ulcerative colitis drug obefazimod reassured investors following earlier...


El Dorado Raises $9M to Expand Cross-Border Fintech Platform
El Dorado, a Latin American fintech improving cross-border financial services, raised a $9 million Series A led by Paradigm with...


Bitcoin Stalls Near $60K as Strategy Moves, ETFs Outflow, and EU MiCA Rules Take Effect
Bitcoin hovers near $60,000 with ETF outflows, while Strategy boosts reserves, sells BTC, and raises dividends to reassure investors. Ethereum...


Cannabis Dominates Global Drug Use: Trends, Risks, and Shifting Markets
Cannabis remains the world’s most widely used illicit drug, with 256 million users in 2024, surpassing all others combined. Growth...
 |
|
 |  |
 |
|
-

 Fintech2 weeks ago
Fintech and AI: Adoption Grows, but Profits Favor Agile Innovators
-

 Fintech5 days ago
PayPal’s Slowdown: From Fintech Leader to Low-Growth Dividend Stock
-

 Impact Investing1 week ago
Edison Accelerates Renewable Growth and ESG Impact in 2025
-
 Africa58 minutes ago
Morocco’s Growth Holds at 4.6% as Agriculture Offsets Economic Pressures
You must be logged in to post a comment Login