Markets
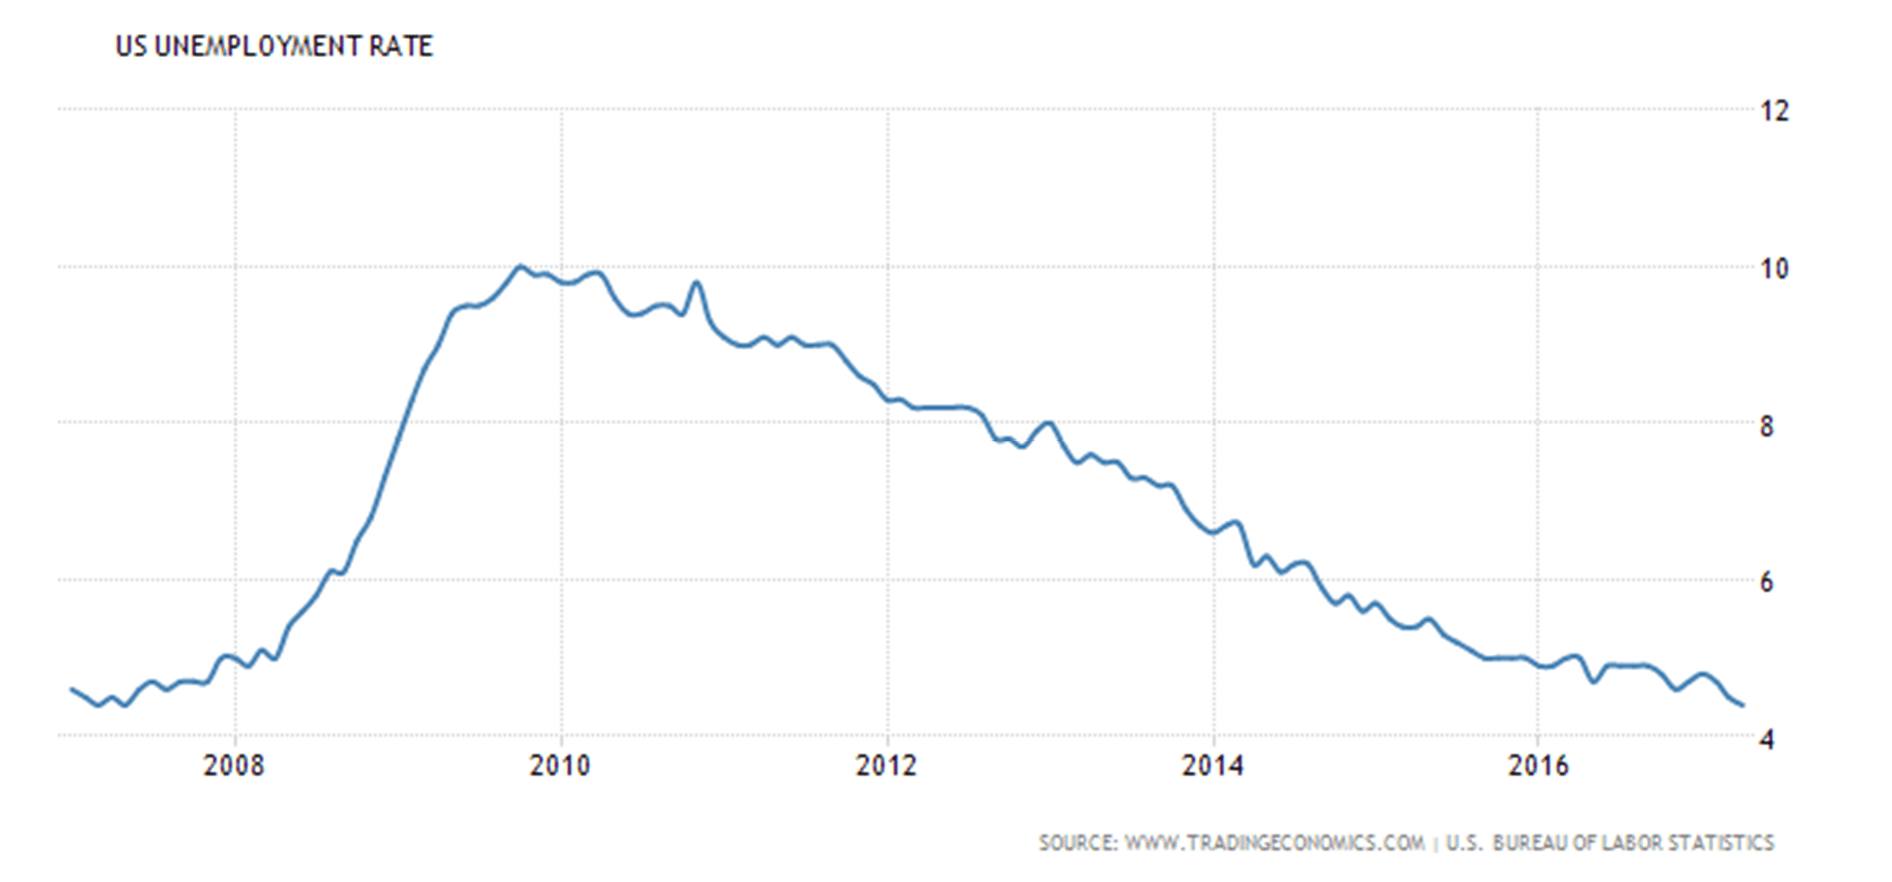
US unemployment rate has reached the lowest level seen since May 2007
It was surprising how little the market changed over the past month. If there was a surprise it was the US$ falling and gold falling. Both usually move opposite to each other. But gold sentiment that was quite positive has quickly turned somewhat negative and silver is approaching sentiment levels usually associated with bottoms.

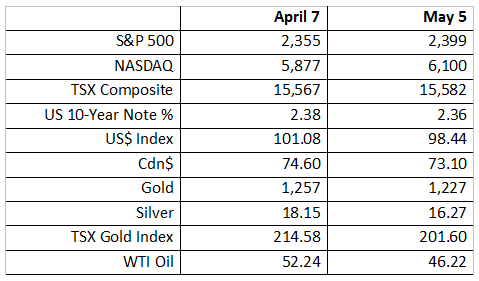
It’s amazing, I guess. We’re away for the better part of a month and when we return little has changed. We left on a holiday on April 12 and didn’t return until April 30. The last report we did was on April 7, 2017. So, some quick comparisons:
© David Chapman
The NASDAQ made new all-time highs again, but the S&P 500 did not nor did any of the other major indices. The S&P 500 is barely above its April 7 closing. Not much happened as the index faded, then rallied back. The TSX Composite is a short distance from its April 7 closing as well. Ditto for the 10-year US Treasury Note. Hit down was WTI Oil prices along with the Canadian $. The two do have some tendency to go hand in hand. Strangely, the US$ Index is down 2.6% and gold is also down, off 2.4%.
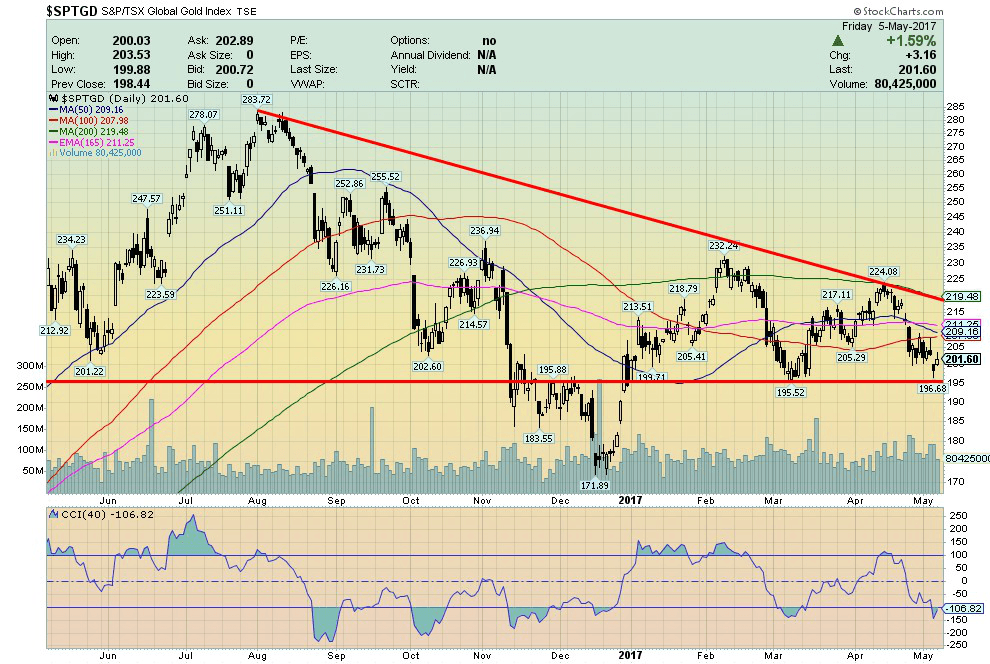
Silver was hit down over 10%. That’s unusual as usually if the US$ falls gold (and silver) rise. Instead, it has been the opposite. The gold stocks are also off with the TSX Gold Index (TGD) down 6% and a number of producer stocks down even more. Positive sentiment in the sector has quickly turned negative.
WTI oil prices fell on oversupply concerns and with the Middle East at least relatively quiet despite numerous threats from the US against Iran, Saudi Arabia against Iran, and Israel bombing into Syria once again. Calls continued for Russian President Putin to back away from the Syrian President Assad, but there is no sign that happening.
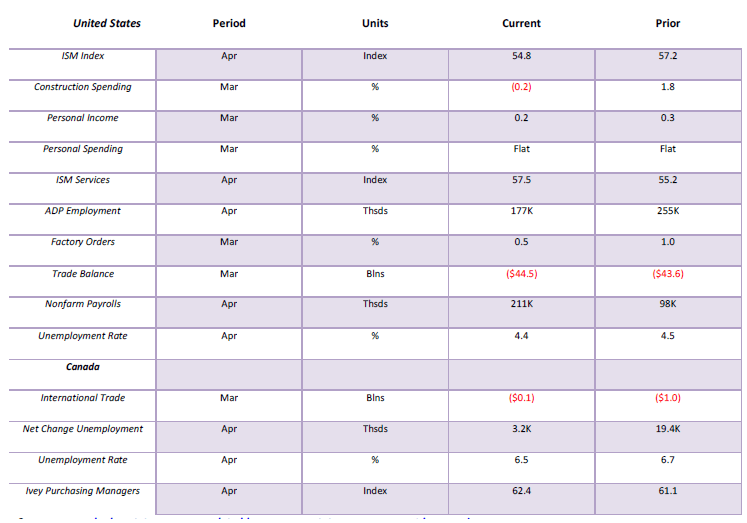
The US economy continues to bumble along although there was a bit of a surprise when the Q1 GDP was reported as a paltry 0.7%. The FOMC did not hike interest rates but that was largely expected and all eyes will be on the June FOMC where the expectation is once again the Fed will hike interest rates. But with some signs of a slowing US economy, some are questioning further hikes. This past week the April ISM manufacturing number came in lower than expected: 54.8 vs. 57.2 in March. However, the nonfarm payrolls number for April was better than expected despite a further downward revision of the March nonfarm payrolls. The headline unemployment rate (U3) fell to its lowest level since 2007, but the labor force participation rate also fell telling us workers left the labor force most likely because they are discouraged.
Model Portfolio
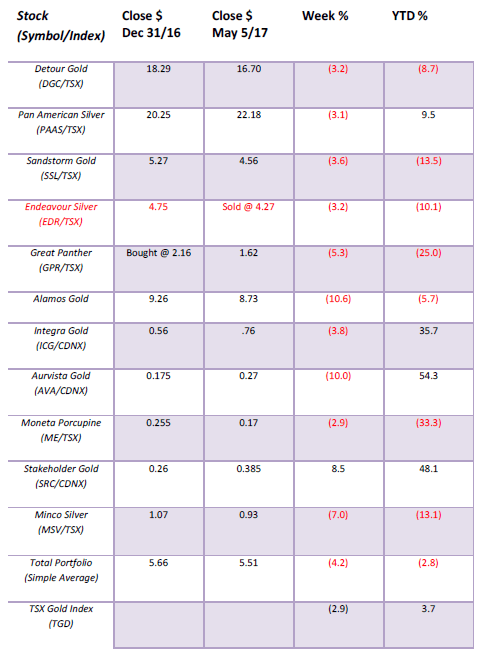
It was not an enjoyable week (or month) for our portfolio. The junior exploration picks have maintained their gains for the year with only Moneta Porcupine (ME) continuing in the red. But in a major disappointment, the producers have slipped badly with the pullback in gold and the gold miners. Overall, we are now underperforming the TSX Gold Index. However, given the quick shift of sentiment from positive to negative it would not be a wise idea to be selling down here. We continue to believe we will be substantially higher before year-end.
© David Chapman
MARKETS AND TRENDS
© David Chapman
Note: For an explanation of the trends, see the glossary at the end of this article.
New highs refer to new 52-week highs.
Key Economic Numbers Week May 1 – May 5, 2017 Source
(Source)
Source: www.shadowstats.com, www.data.bls.gov, www.statcan.gc.ca, www.tdeconomics.com
Note: % M/M unless otherwise noted
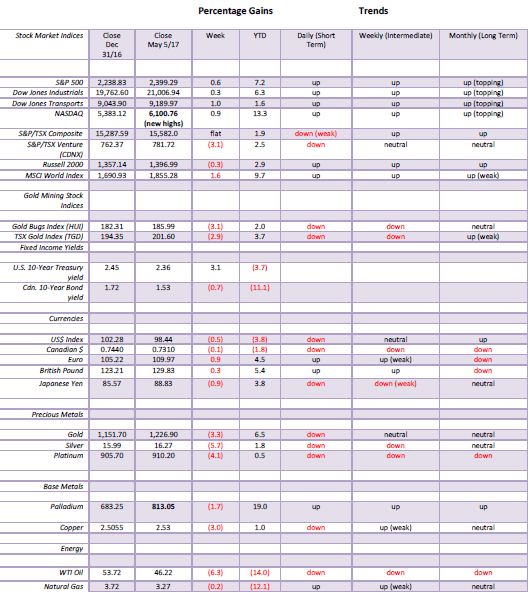
The US unemployment rate (U3) edged down to 4.4% from 4.5% in April the lowest level seen since May 2007 before the 2007–2009 financial crash and recession. While the number of unemployed fell by 146 thousand the labor force participation rate, also fell from an 11-month high to 62.9% from 63%. This, in turn, translates into a lower unemployment rate. The U6 unemployment rate that counts discouraged workers (less than one year) plus part-time workers seeking full-time employment fell to 8.6% from 8.9%. The Shadow Stats unemployment number fell to 22.1% from 22.5%. This figure includes those unemployed for more than one year defined as discouraged workers defined out of the labor force in 1994 by the Clinton administration. The nonfarm payrolls jumped to 211 thousand higher than the expected 180 thousand. Over half the jobs were in the service, leisure industry where the jobs are traditionally part-time, low wages, and lacking in benefits. The March nonfarm payrolls were revised downward to 79 thousand from 98 thousand. Those not in the labor force totaled 94.3 million although the vast majority of them are retirees (50.9 million).
(Source)
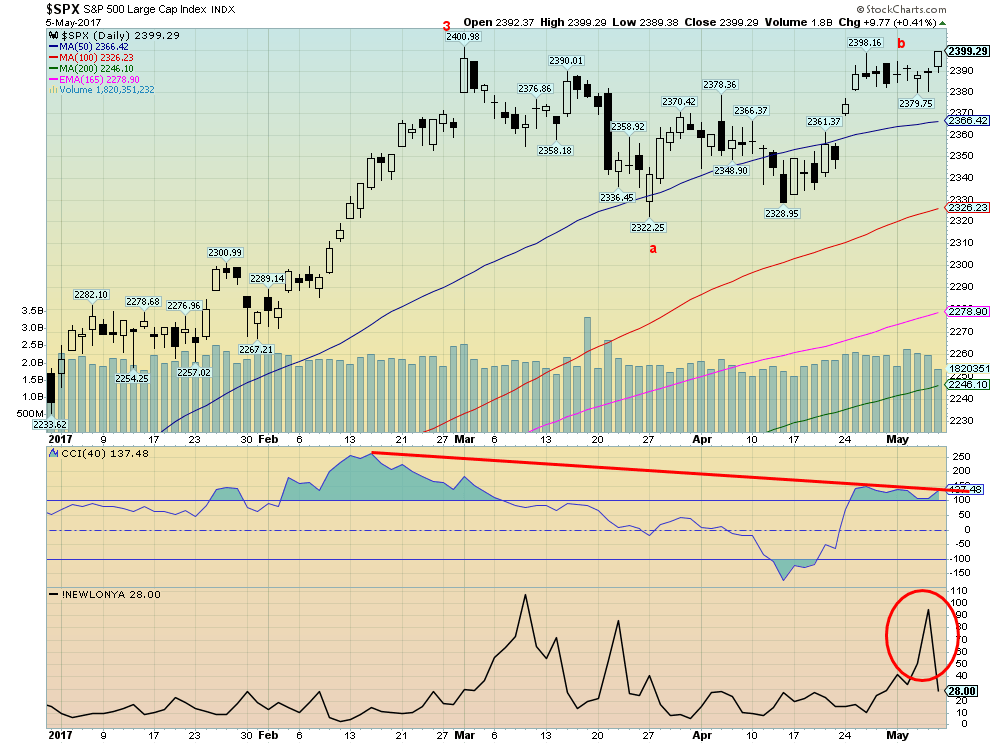
Our shorter-term chart of the S&P 500 shows a few interesting things. First, despite being at or near new highs for the index indicators are diverging. Most indicators are nowhere near their February peak. That shows quite well on the NASDAQ that is at all-time highs yet indicators are off their highs. Second, after peaking in February the wave structure is a distinct ABC type, which suggests to us that what is unfolding is a corrective wave. We appear to have completed an “a” wave and may be in the throes of completing the “b” wave. What remains is either the “c” wave or an even more complex abcde type of correction with waves “c, d, e” to come. Finally, we put the NYSE new lows index on the chart and we note that more new lows were being made even as the S&P 500 moved higher into May. Grant you, the NYSE new lows has dropped quickly with the move on Friday, but overall we were seeing rising new lows even as the index itself was moving higher—another divergence.
Support right now is at 2,380 and down to 2,360. Below 2,360 a test of the March/April lows should get underway. A “c” wave down could carry us to new lows but a “c, d, e” type of structure would create a coil before the index does leap to new highs this summer. We believe this is a wave 4 in the making and as a result, once this correction is over the S&P 500 should move to new highs in the summer to complete wave 5.
(Source)
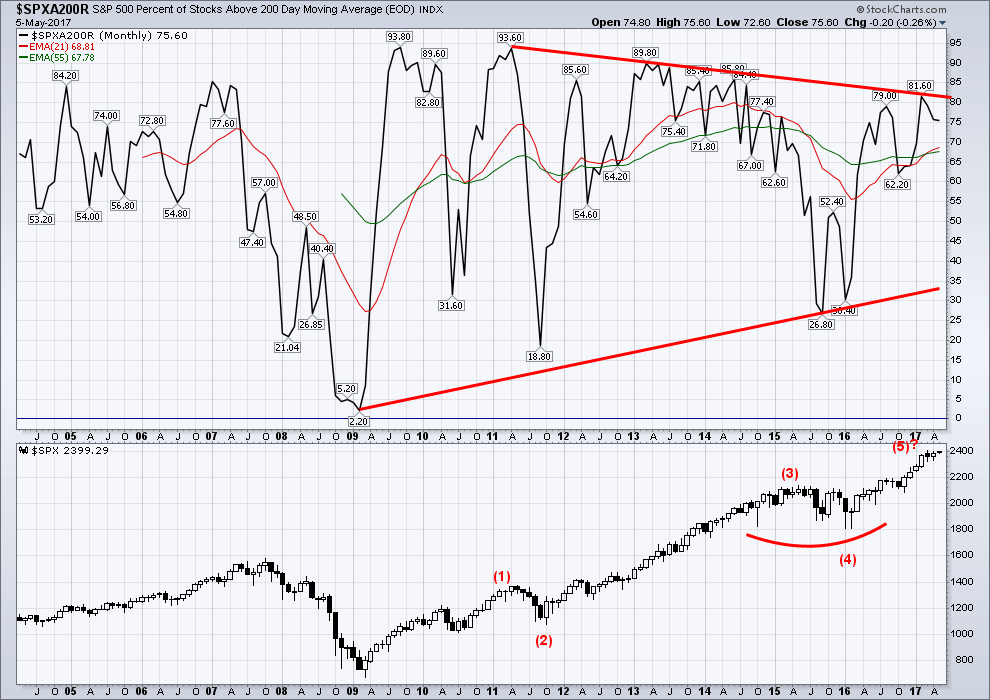
Following the financial crash of 2007–2009 the bull market of 2009–2017 has seen two corrections. The first one was in 2011 during the EU financial crisis and the second one was in 2015–2016 ending in early 2016. Both corrections were under 20%. These have been labeled waves (2) and (4) of the 2009–2017 bull. So we know we are on the final up wave (5) on a primary wave basis and we could also be in the throes of completing wave 5 on an intermediate and minor basis too. As noted, none of that rules out new highs this summer but the question one should be asking is does one want to chase it? Buyer beware.
(Source)
(Source)
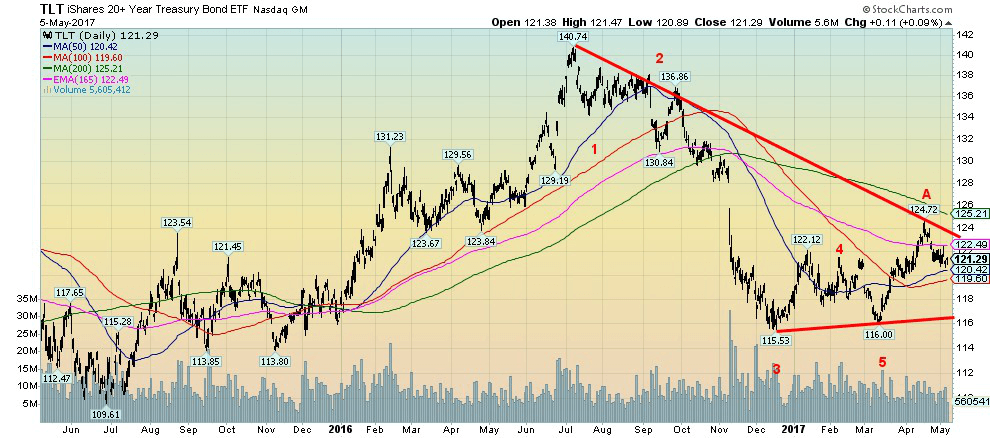
It is difficult to say whether the bond correction is over or not. We did appear to make an important low in March (label wave 5), but what we are not sure of is whether the upside correction that got underway is over or whether there is more to come. The upside correction ran out steam just below the 200-day MA. Volume as noted fell off telling us that is most likely a corrective move and not the start of a new upward thrust. We can’t help but note the heavy volume on the gap collapse back in November that preceded the December 2016 low. Bonds are trading listlessly as the market appears to be uncertain as what the Fed will do next. There have been some signs the economy is slowing a bit but there are few if any signs that it is about to collapse. We say that despite the bankruptcy filing of Puerto Rico and the ongoing chaos and threat of default from Venezuela and once again Greece having trouble. But all of those issues seem to be small and probably containable despite the pain for those living in those countries.
(Source)
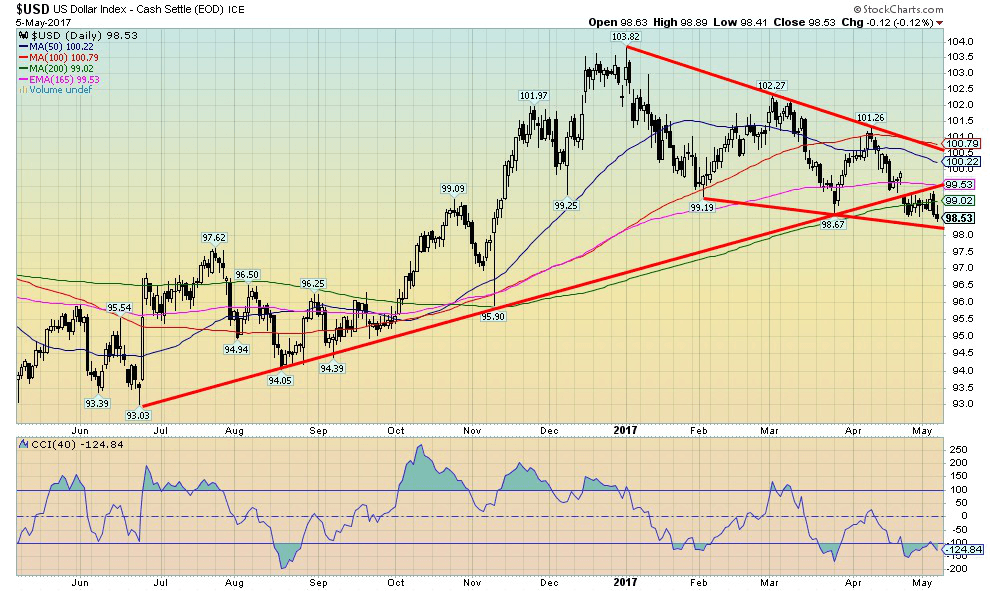
Has the US$ Index topped? The breakdown on April 24 following the French elections was a gap breakdown. But was it just a common gap or was it something bigger like a breakaway gap? Hard to say at this point and now the level to watch for is just above 98. A breakdown 98 would be definitive and tell us that the final top is most likely in for the US$ Index. The failure to sustain any kind of rally that could take the US$ Index above the January 2017 high of 103.82 suggests to us that final top could well be in. The caveat, of course, is that if the US$ Index fails to break under 98 it keeps alive the potential for another retest of the January 2017 high and even new highs. We had long held that the target for the US$ Index was 106-108 but that is not a guarantee that it would happen.
Sentiment has become quite bearish for the US$ Index but bearish sentiment can become even more bearish. On the other hand sentiment for the Euro (the Euro makes up 57.6% of the US$ Index) has become quite bullish. And as we noted with the French election this weekend it could become “buy the rumor” and “sell the news.”
So for the interim, at least, we are neutral the US$ even as the trend is currently down. A break of 98 would be negative and could target the index down to the 94/95 zone. A break back above 99.50 and especially over 100.50 would be positive and suggest another test of the January 2017 high.

(Source)
The Canadian $ has plunged to new lows as our economy shows signs of being weaker than the US and the US slaps trade tariffs on us. Oil prices falling haven`t helped either. It was an odd period over the past several months as oil prices moved higher and the Canadian $ failed to respond and move higher. It was a divergence we noted at the time but we weren’t sure of the meaning. Now we know. Oil prices have now fallen and the Canadian $ goes down with them. It seems the Canadian $ was an indicator that was telling us that it didn`t really believe the oil rally. The Canadian $ was right.
(Source)
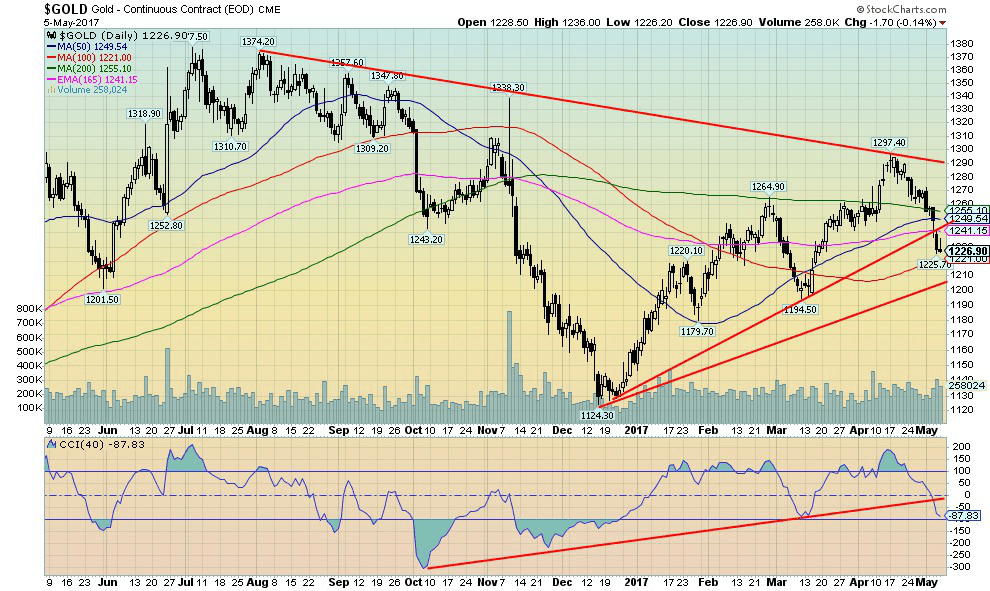
It definitely seems counter-intuitive that with the US$ down over the past month gold prices have fallen as well. The usual pattern is US$ down gold up; US$ up gold down. During the great correction for gold from 2011 to 2015 gold prices fell about 46%. The US$ in the same period rose roughly 36%. Since December 2015 the US$ has traded mostly sideways while gold is up roughly 17% despite the recent pullback.
Gold hit a high of $1,297 on April 17, 2017 and sentiment had clearly gotten ahead of itself hitting 90% bulls. The pullback has dropped sentiment to 46% bulls. While not exactly in a screaming buy zone the suspicion here is that the worst is probably over. Gold did break an uptrend line from the December 2016 low and now appears to be headed to its next good level of support near $1,210. The major concern would only occur if gold were to fall under the March 10, 2017 low of $1,194. Gold`s first wave out from the December 2016 low may have topped in late February at $1,264. Since then we could be making an ABC type of correction known as a flat where the B wave is actually higher than the first wave. If that is correct then this is a bullish correction and once it is complete a more powerful up wave could develop.
Seasonally gold is typically weak into May and June with lows even into July. Oddly, last year gold made a low in late May then rallied into a top on July 6 at $1,377. Could that happen again? The simple answer is yes. Last year the Brexit helped push gold prices higher. Could this year be the French elections? Oddly it was the French election a few weeks back that helped trigger gold`s most recent decline. Le Pen finished 2nd forcing the run-off that is happening this weekend. As we’ve said, the expectation is Macron the centre-right candidate should win.
Gold remains in a period where potential major cycle lows were expected. The period was to last from roughly the last quarter of 2015 to the first quarter of 2018. Thus far the major low was seen in December 2015. But gold really needs to take out $1,500 to suggest that the final low is in. All the action over the past two years suggests a significant bottom is forming that once completed could see gold embark on another strong up market comparable to 2001–2011 when gold rose from about $255 to $1,920.
Gold’s commercial COT has remained relatively stable the past few weeks—currently at 25% vs. 24% the previous week. Short open interest fell in the past week by roughly 12,000 contracts. This is not exactly bullish but it is not super bearish either. Over the past five weeks, the commercial COT has been between 24% and 26%.
(Source)
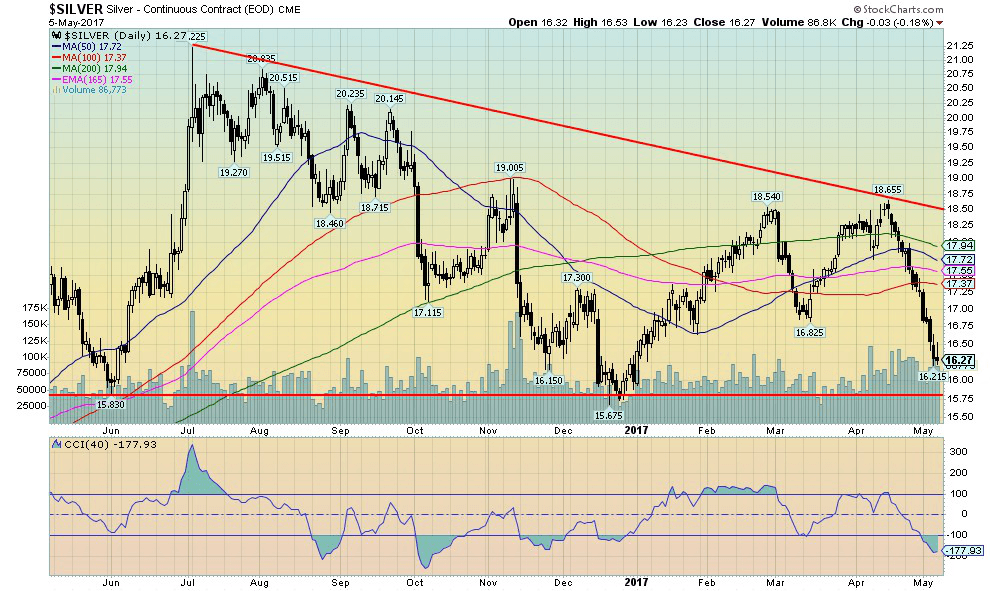
The pullback for silver has been even more severe than for gold. While gold is off just over 5% from its recent top, silver has fallen almost 13% from the $18.65 top. Silver sentiment has plunged even more so than gold. At the recent high silver sentiment was 83% bulls. Today it sits around 14% bulls. Not at the really depressive levels seen in December 2015 and December 2016, but sentiment is getting into levels where one would certainly not want to sell but be looking instead to buy.
(Source)
Gold stocks, as measured here by the TSX Gold Index (TGD), have held in surprisingly well during the recent decline. Yes, they are down but only about 10% vs. gold`s decline of 5% and silver`s drop of 13%. We consider that good as usually gold stocks get hit harder in declines. Recall that while gold fell about 46% during the great correction 2011 to 2015 and silver dropped 72% the TGD fell 75%.
(Source)
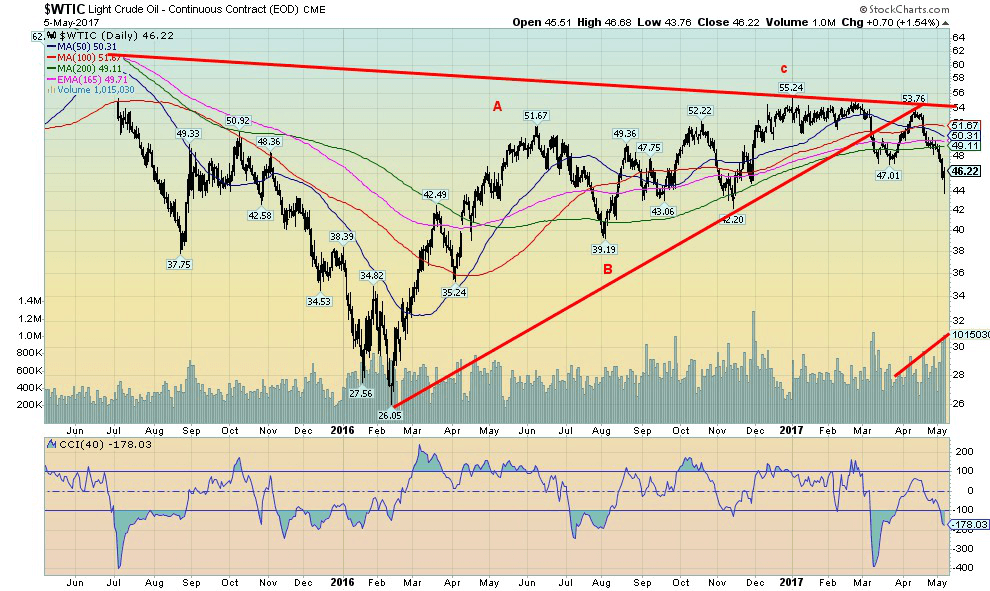
Oversupply is once again hitting oil prices. It appears that the up move from the February 2016 low at $26.05 was merely an ABC type correction to the decline from over $100. WTI oil is now embarking on what could be its final wave to the downside. Note how volume has picked up as prices have moved lower. Further, we took out the March low of $47.01 and that suggests that lower prices lie ahead.
GLOSSARY
Trends
Daily – Short-term trend (For swing traders)
Weekly – Intermediate-term trend (For long-term trend followers)
Monthly – Long-term secular trend (For long-term trend followers)
Up – The trend is up.
Down – The trend is down
Neutral – Indicators are mostly neutral. A trend change might be in the offing.
Weak – The trend is still up or down but it is weakening. It is also a sign that the trend might change.
Topping – Indicators are suggesting that while the trend remains up there are considerable signs that suggest that the market is topping.
Bottoming – Indicators are suggesting that while the trend is down there are considerable signs that suggest that the market is bottoming.
—
DISCLAIMER: This article expresses my own ideas and opinions. Any information I have shared are from sources that I believe to be reliable and accurate. I did not receive any financial compensation in writing this post, nor do I own any shares in any company I’ve mentioned. I encourage any reader to do their own diligent research first before making any investment decisions.


Morocco’s Growth Holds at 4.6% as Agriculture Offsets Economic Pressures
Morocco’s economy grew 4.6% in Q1 2026, driven by a strong agricultural rebound offsetting declines in industry. Services expanded moderately...


Abivax Shares Surge as New Trial Data Eases Safety Concerns Over Ulcerative Colitis Drug
Abivax shares surged nearly 36% after positive updated trial results for its ulcerative colitis drug obefazimod reassured investors following earlier...


El Dorado Raises $9M to Expand Cross-Border Fintech Platform
El Dorado, a Latin American fintech improving cross-border financial services, raised a $9 million Series A led by Paradigm with...


Bitcoin Stalls Near $60K as Strategy Moves, ETFs Outflow, and EU MiCA Rules Take Effect
Bitcoin hovers near $60,000 with ETF outflows, while Strategy boosts reserves, sells BTC, and raises dividends to reassure investors. Ethereum...


Cannabis Dominates Global Drug Use: Trends, Risks, and Shifting Markets
Cannabis remains the world’s most widely used illicit drug, with 256 million users in 2024, surpassing all others combined. Growth...
 |
|
 |  |
 |
|
-

 Crypto1 week ago
Bitcoin Holds Steady as Microtransactions Surge and ETF Inflows Continue
-

 Biotech2 weeks ago
AseBio 2025 Report Highlights Growth and Future Potential of Spanish Biotechnology
-
 Cannabis5 days ago
Tilray (TLRY) Falls as Bearish Momentum Persists Despite Marketing Push
-

 Biotech1 week ago
New Gene Therapies Transform Rare Disease Care, but Gaps Remain
You must be logged in to post a comment Login