Featured
Value Stocks Are Doing Well as Witnessed by Berkshire Hathaway Making All-Time Highs
Our chart of the week looks at the US$ Index and we raise questions as to whether the days of the U.S. dollar as the world’s reserve currency are over. Stock markets soared this past week despite the Fed rate hike which was expected. The war in Ukraine is approaching a stalemate and that in turn has seen stock markets respond positively.

Since 1970 the world has been through a series of financial crises. Each crisis has been progressively worse than the previous one. The solution has been to see the developed world’s central banks lower interest rates to historical low levels, and flood the financial system with unprecedented volumes of liquidity now called quantitative easing (QE). The result is money and debt have exploded. Since the 2008 financial crisis world debt has more than doubled. Economic growth as measured by GDP has only kept its head above water. But bubbles popped up everywhere. Dot.com bubble, housing, and subprime bubble, and more recently what has been called the everything bubble. We bailed ourselves out of the previous bubble busts. Can we do it again? In a world awash in debt and already having spent trillions on bailing us out do we have any “bullets” left? We have already unleashed the highest inflation since the 1970’s as commodity inflation soars. World trade is contracting and threatens to get worse. Is there a solution without going through what previous generations went through? Economic depressions and war.
Our chart of the week (page 7) looks at the US$ Index and we raise questions as to whether the days of the U.S. dollar as the world’s reserve currency are over. Stock markets soared this past week despite the Fed rate hike which was expected. The war in Ukraine is approaching a stalemate and that in turn has seen stock markets respond positively. Signs last week that indices were breaking out and the TSX Composite made new all-time highs. But is it sustainable? Is this the start of a new upleg or merely what will prove to be a strong correction to the first wave down? We believe the latter but many are calling it the former. Value stocks are doing well as witnessed by Berkshire Hathaway making all-time highs.
Gold and commodities paused this past week but in a potential stagflationary economy i.e. high inflation, reduced or even negative growth commodities should continue to shine following corrective periods. A non-metal commodity, lumber, for example, has been participating in this rally and has benefited West Fraser Timer Co. Ltd, a diversified wood products company with operations in western Canada and the U.S., which pays a dividend and is held in the Canadian Conservative Growth Strategy.* With currencies under pressure a reminder that gold is also a currency. Gold has already made new all-time highs in euros, and Japanese yen. And noteworthy in Russian rubles as well as the currencies of other developing countries. Major currencies, including the U.S. dollar, which came close to new all-time highs, are sure to follow. Our worry is lagging silver.
“What generates war is the economic philosophy of nationalism: embargoes, trade, and foreign exchange controls, monetary devaluation, etc. The philosophy of protectionism is a philosophy of war.”
—Ludwig Von Mise, Austrian School Economist, historian, logician, sociologist, proponent of classical liberalism, libertarianism; 1881–1973
“Markets can remain irrational longer than you can remain solvent.”
—John Maynard Keynes, 1st Baron of Keynes, English economist, whose ideas changed the theories and practice of macroeconomics and economic policies, known for Keynesian economics, author of The General Theory of Employment, Interest, and Money (1936); 1883–1946
“The four most dangerous words in investing are: ‘this time it’s different.’”
—Sir John Templeton, American-born British investor, banker, fund manager, and philanthropist, founder of Templeton Growth Fund (1954); 1912–2008
This time is different. It’s a phrase we’ve heard many times. It was also the title and subject of the book This Time is Different, Eight Centuries of Financial Folly by Carmen M. Reinhart & Kenneth S. Rogoff (2009). We leap from one financial crisis to the next, claiming old rules are meaningless, that today’s situation bears no resemblance to past financial disasters. Yet, when one looks closely, it almost seems that one financial crisis begets the next one.
Over our working years, we have been through or seen countless financial crises. The 1970s opened up with the Nixon shock of August 1971 when he ended the convertibility of the U.S. dollar into gold. But the 1970s was all about the oil shocks. First the OPEC oil shock (1973) and then it ended with the Iranian revolution and hostage crisis (1979) that helped trigger the early 1980s recession. Then came the Latin American debt crisis through the late 1970s and into the early 1980s. Argentina, Bolivia, Brazil, and Colombia headed the parade of defaults. The 1980s brought us banking crises, including the collapse of Continental Illinois, at the time one of the largest banks in the U.S. The 1980s also saw the rise of the Japanese stock market bubble, culminating in the crash of 1990 and the Savings and Loans crisis in the U.S. where over 1,000 S&Ls failed. And then there was “Black Monday” on October 19, 1987.
The 1990s started off with the early 1990 recession, then we had the Mexican economic crisis of 1994, the Asian contagion crisis of 1997, the Russian currency and debt collapse of 1998 and LTCM, and closed the decade with yet another Latin American debt collapse in Argentina that carried over into the early 2000s. The 2000s started off with a bang with the culmination of the dot.com bubble in 2000–2002, the September 11, 2001 attacks, and more unrest and banking collapse in Latin America (Venezuela and Uruguay). Things really heated up with the sub-prime mortgage crisis, an oil price bubble leading to a collapse, the collapse of the U.S. housing market that spilled over into the EU, the Iceland financial crisis, the Irish banking crisis, another Russian financial crisis (2008–2009), and a Spanish banking crisis. Few could forget the Lehman Brothers collapse of September 2008.
The 2010s started out with the European sovereign debt crisis that centered on Portugal and Greece but also Ireland. It even had its own acronym—PIGs. There was yet another Russian financial crisis in 2014, a Chinese stock market crash (2015), and the Turkish currency and debt crisis of 2018. The decade was closing with yet another Argentina debt crisis. The 2020s started off with a bang or is that a crash, the pandemic crash of March 2020, and here we are again yet another Russian financial crisis. This one appears to be a conglomeration of every other financial crisis.
Not only do we have a spike in oil prices, but all commodities are soaring because of the ongoing conflict in Ukraine. Note, however, that they were already rising before war broke out. Inflation is at its highest level since the 1970s. We have massive supply chain disruptions lingering on from the pandemic and now exacerbated by the war in Ukraine. Led by the U.S., the Western world has overwhelmed Russia with economic and financial sanctions. It’s a different kind of warfare—financial warfare. Evidence is mounting that it could end in severe blowback against the Western financial system. A possible growing Russian default could be bigger than the Lehman Brothers moment.
With the outlook for global growth falling, we are also faced with inflationary price shocks that impact the world. Food and energy are the two that could cause the most damage as the burden of the rises falls heavier on low- and middle-income countries that depend on imports and on poorer households where food and energy (and rent) make up almost all their expenses. It is no surprise that the OECD and other economists are lowering their forecasts for global growth. Could the world fall into a global recession?
It is noteworthy that many of the crises noted above sparked a collapse in stock markets. Using the S&P 500 as our measuring mark, we note declines following a number of the crises mentioned above:
- 1970s energy crisis
- 1973 OPEC oil crisis – down 48.2%
- 1979 oil and Iranian crisis – down 27.1%
- 1987 stock market crash – down 33.5%
- 1990 oil crisis – down 19.9%
- 1998 Russian ruble/debt default, LTCM – down 19.3%
- 2000–2002 dot.com bubble, 9/11 – down 49.1%
- 2007–2009 sub-prime mortgage crisis, Lehman Brothers – down 56.8%
- 2011 EU sovereign debt crisis – down 19.4%
- 2020 pandemic crash – down 33.9%
In addition, and noteworthy was the bursting of the Japanese Stock Market bubble in 1990 and the Chinese stock market crash of 2015. Japan’s Nikkei Dow (TKN) fell 63.5% in 1990–1992 while the Shanghai Stock Exchange (SSEC) fell 49.0% in 2015–2016. For the SSEC, that was actually less than it fell during the 2008 financial crisis when the index collapsed 72.8%.
S&P 500 1970–2022
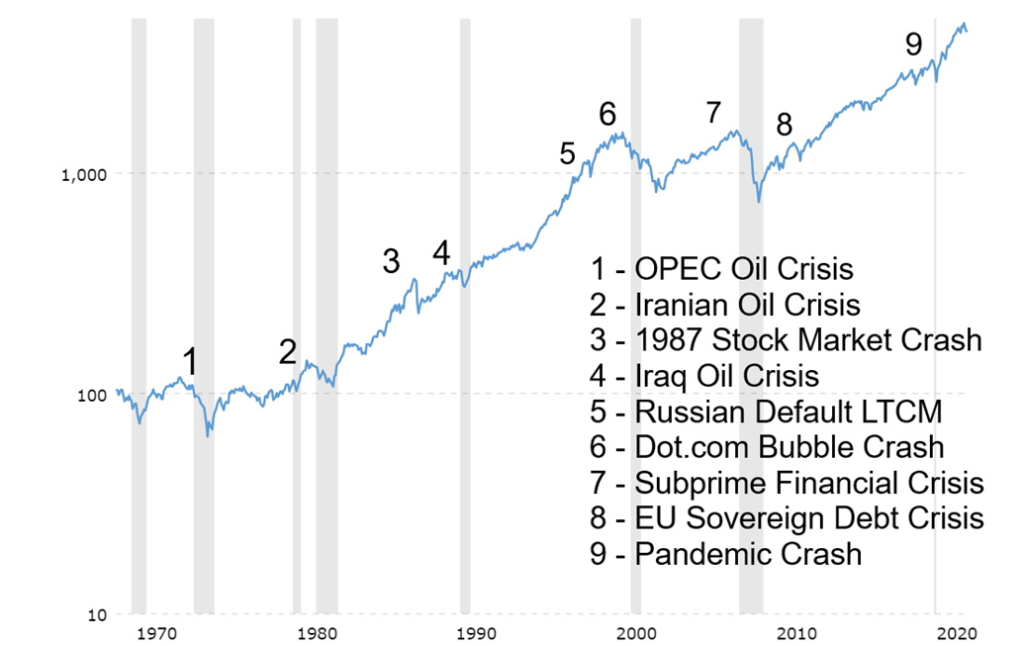
Almost consistently, the monetary authorities (central banks) responded to the crisis by a) lowering interest rates to zero, and in the EU and Japan, sub-zero, and b) flooding the financial system with liquidity, more formalized after the 2008 financial crisis as it was called quantitative easing (QE). The result was the creation of stock market bubbles that saw the NASDAQ soar 519% from October 1998 to March 2000, the S&P 500 gain 101.5% in 2002–2007, the S&P 500 gain 400.5% in 2009–2019, and the S&P 500 gain 120% from March 2020 to January 2022.
We called it the Fed put. We face a financial crisis but along comes the Fed (and other central banks) to save the day. The result, we may suffer a short-term setback but there is nothing like zero percent interest rates and trillions of dollars of liquidity to send stock markets soaring once again. But have we now “bitten-off” more than we can “chew”?
Growth of Money Supply, U.S. Federal Debt, U.S. GDP – 1970–2022
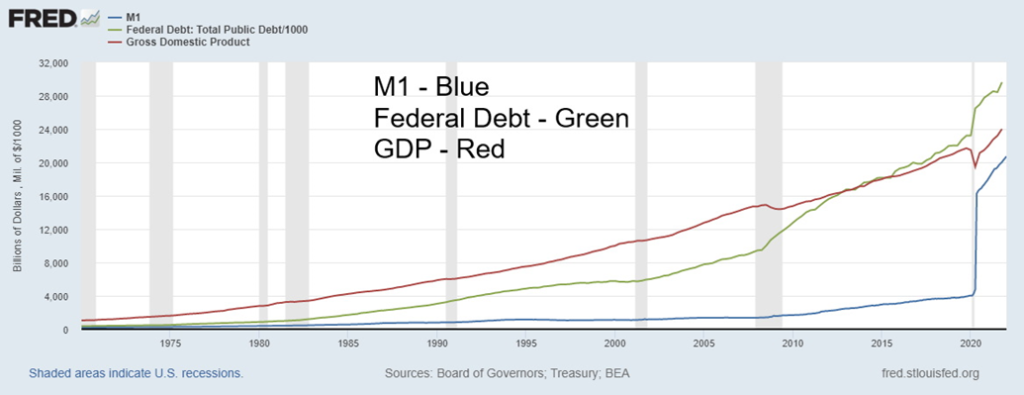
The gains in the stock markets were fueled by an historical growth in money and massive amounts of debt. But at what cost? GDP growth did not keep up with the growth of debt and money (M1). Since 1970, M1 has grown by 9,823%, the U.S. Federal debt by 8,051%, but U.S. GDP has gone up only 2,149%. And that’s nominal GDP. Real GDP (adjusted for inflation) has gained only 300%. During this same period gold is up 5,405%, the S&P 500 is up 5,025%, while oil has gained only 2,737% despite the jump in prices during the past year. Not even gold and the stock market have kept up with the massive growth in money and debt. Since the March 2020 pandemic crash the U.S. Federal debt is up 30.6%, M1 is up an astounding 409% while nominal GDP growth is up only 11.8%.
In punishing Russia for its invasion of Ukraine, while deemed necessary by many, the West has to be prepared for blowback, potentially serious blowback. Spiraling energy, food, and metal prices are pushing inflation to levels not seen in 40 years. It is negatively impacting the affordability of everything. Already we’ve seen some blowback in the form of the collapse of the nickel market following cease trading on the LME. It sparked huge losses for China’s Tsingshan Holdings. Russian bonds are potentially on the brink of default, bringing back memories of the 1998 collapse that almost took down the financial system. Even if they do make payments on issues due in mid-March, the threat of default could continue to hang over the market.
Supply chains are being severely disrupted because of the conflict in Ukraine, and adding to supply chain disruption is China shutting down major cities to contain yet another outbreak of COVID. With the Americas opening up, what are they going to do if another COVID wave hits Canada and the U.S.? The Fed has started to hike interest rates and the Bank of Canada (BofC) preceded them. Fed Chair Jerome Powell remains bullish on the U.S. economy, something that some might say is wishful thinking. Banks are at least in better position than they were in previous crises because of steps taken after the 2008 financial crisis that effectively forced the banks to shore up their capital positions. As well, gold now is considered Tier 1 capital for banks.
There is potentially more disruption coming. Is the U.S. dollar position as the world’s reserve currency being challenged? China does not have sanctions on Russia. China (and Russia) have been building an alternative payments system to SWIFT. With Russia largely removed from SWIFT, alternative systems could gain traction and attract more participants, particularly those vulnerable to U.S. actions. More and more, Russia will deal in rubles and yuan. Saudi Arabia is prepared to accept yuan as payment for their oil. This is a sharp departure as it lessens the need for U.S. dollars. If the need for U.S. dollars falls, can it remain as the world’s reserve currency?
With the world already awash in money from the previous financial crisis and interest rates, despite the recent small rise still near record lows, do the central banks have the wherewithal to bail out the financial system again if another financial crisis hits? We should not be under any illusions. Russia will suffer, but sanctions like the trade and currency wars of the 1930s have repercussions. Brace for more financial and economic shocks and continued volatility.
Chart of the Week
US$ Index 1970–2022
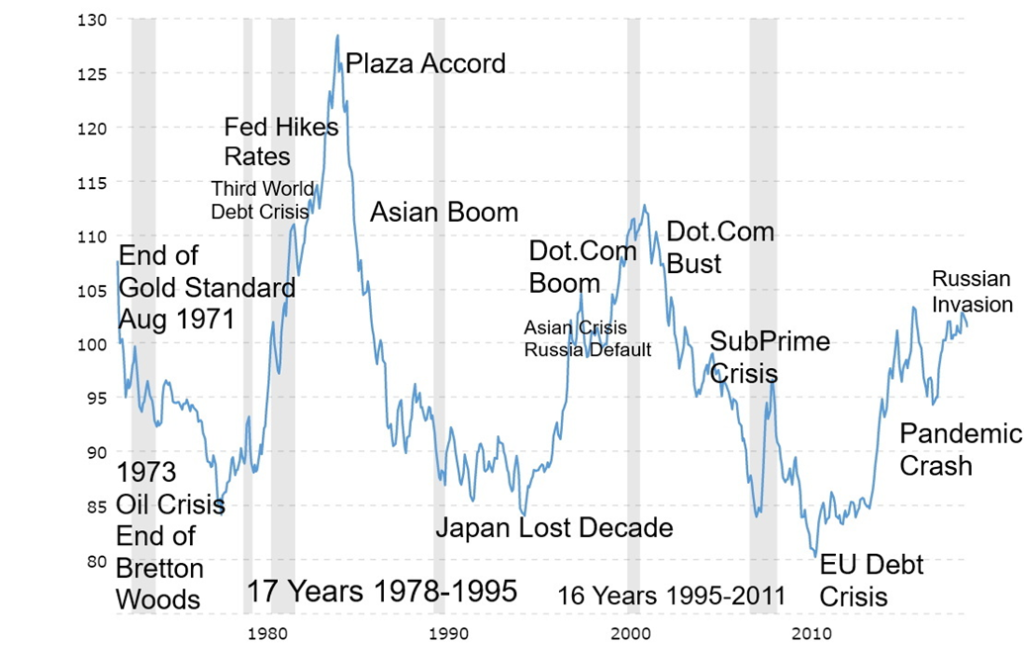
The U.S. dollar has been the world’s official reserve currency since the Bretton Woods agreement in 1944. It lasted all of about 29 years when the US$ Index began trading, the gold standard officially ended, and the U.S. dollar was set free to float against global currencies. President Richard Nixon took the U.S. dollar off the gold standard in August 1971 but it wasn’t until 1973 that Bretton Woods fully ended. The age of fiat currencies was under way.
Since then, the US$ Index (officially made up of the euro (EUR) 57.6%, Japanese yen (JPY) 13.6%, pound sterling (GBP) 11.9%, Canadian dollar (CAD) 9.1%, Swedish krona (SEK) 4.2%, and Swiss franc (CHF) 3.6%) has been the benchmark for the trading of other currencies against the U.S. dollar. The overvalued dollar began a long descent, bottoming in 1978 as inflation raged. To fight inflation and end the descent of the U.S. dollar, the Fed hiked interest rates to 20%. By 1985 the world was in distress because of the sharp rise of the U.S. dollar. As a result, in September 1985 the Plaza Accord agreed to depreciate the U.S. dollar against the Japanese yen and the German Deutsche Mark to correct trade imbalances between the U.S., Japan, and Germany. The agreement was signed by the G5.
The U.S. dollar began a long descent as an Asian economic boom got underway. In doing so it eventually had unintended consequences as the Japanese bubble burst in 1989–1990, paving the way to Japan’s lost decade. That brought a lot of Japanese yen back to Japan, pushing up the value of the yen, which in turn led to an agreement between Japan and the U.S. to raise the value of the U.S. dollar, as the falling dollar coupled with a rising yen was hurting Japanese exports. The US$ Index bottomed in 1995. The rise coincided with the dot.com boom, although it also coincided with the Asian financial crisis in 1997 and the Russian default/LTCM in 1998.
The US$ Index topped in 2002 as the wars on terror got underway which included the U.S. invasion of Iraq in 2003 and the euro started trading. This led to a long decline of the US$ Index as it bottomed initially during the financial crisis of 2008 but bottomed for good in July 2011 during the EU/Greek Sovereign Debt Crisis. QE started a boom in the U.S. and the dollar rose once again in January 2017. The Trump trade wars initially weakened the U.S. dollar, although the US$ Index bottomed in January 2018 as the trade wars intensified. Following a pullback, the US$ rose out of the pandemic and the Russian invasion of Ukraine helped to pull the US$ Index back to the upside. But so far it has failed to take out the 2017 highs of 103.
The U.S. dollar makes up about 60% of central bank global reserves (the others are pound sterling, Japanese yen, Chinese yuan, and a scattering of other currencies including the Canadian dollar) and also constitutes up to 60% of international debt. As well, the U.S. dollar constitutes about 55% of cross border credit and 40% of foreign exchange and trade. With up to 60% of international debt in U.S. dollars, a strong U.S. dollar can cause problems. Foreign borrowers of U.S. dollars earnings are in their home currency. The stronger the U.S. dollar, the more of their domestic currency is required to acquire the U.S. dollars to pay back their loans.
We note that the US$ Index appears to have a 16–17-year cycle of troughs. Ray Merriman of MMA Cycles (www.mmacycles.com) notes it as a 15-year cycle. The trouble with it is there are few observations. The low in 1978, followed by lows in 1995 and 2011. The next low, according to these cycles, could come anywhere from 2023 to 2027. Merriman centers his low around 2023–2024.
There are growing threats to the U.S. dollar despite the recent run-up following Russia’s invasion of Ukraine. The threats are high inflation, fragmentation of the globalized economy and threats to world trade, and sanctions on Russia targeting their foreign reserves.
The freezing of Russian reserves is causing some concern. The fear is that, for whatever reason, the U.S. could seize a country’s foreign reserves, much of which is held in U.S. treasuries with the Fed. While Japan leads the way, holding some $1.3 trillion of U.S. treasury securities, China is right behind with just under $1.1 trillion. However, countries that did not condemn Russia at the UN and are not on board with sanctions could be vulnerable to a U.S. backlash. Global central banks are trying to diversify their way from the U.S. dollar to either other currencies or gold.
Because of sanctions on Russia that effectively also bar them from SWIFT, China is working to create an alternative to SWIFT. The question is, how many countries will join? So far, there are about 11,000 banks a part of SWIFT but only about 150 with China’s system. China’s system would be in yuan. Russia and China will be moving to a yuan-based system and that in turn could help avoid U.S. sanctions. Dissatisfaction with the actions of the U.S. against many countries is leading to a rethink of using the U.S. dollar. China and Saudi Arabia are discussing the possible payment for oil in yuan. India is also looking at becoming a part of the system away from U.S. dollars. The Reserve Bank of India and the Bank of Russia have been holding talks. Curiously, the tariffs that the U.S. placed on China during the Trump presidency have never been removed. For years, the U.S. and China had a strong trade relation with China sending the U.S. goods and China buying U.S. treasuries thus financing their deficits. No more. China has not added to their holdings of U.S. treasuries in well over a year. Indeed, they have fallen with Japan and the U.K. primarily picking up the slack and buying new issues of U.S. treasuries. China has indicated growing concern about their holdings of U.S. treasuries.
Naturally, there are problems. The U.S. dollar has largely benefitted because the alternatives are weak. The euro does not have a strong institutional base, gold supposedly lacks liquidity although we fail to understand that one given the volumes that are traded, the yuan is not fully convertible and remains pegged against the U.S. dollar, and cryptocurrencies are only theory, lacking any real trustworthiness. A disruption in trade between the U.S. and China could have global implications, not dissimilar to the trade and currency wars of the 1930s that contributed to the Great Depression.

The history of reserve currencies is a long one. Reserve currencies do not last forever. Going back to 1400, only five global powers have enjoyed reserve currency status: Portugal, Spain, Netherlands, France, and Great Britain. Each lasted roughly 94 years. The U.S. dollar’s reign is now around 100 years, following the demise of the pound sterling after World War I. But the lack of an alternative could prolong the U.S. dollar’s reign. Instead, what we might see is a splintering of global currencies as trade wars, sanctions, etc. intensify. That in turn could create an extended period of instability and volatility with numerous challengers including the yuan, cryptos, and even gold.
MARKETS AND TRENDS
| % Gains (Losses) Trends | ||||||||
| Close Dec 31/21 | Close Mar 18/22 | Week | YTD | Daily (Short Term) | Weekly (Intermediate) | Monthly (Long Term) | ||
| Stock Market Indices | ||||||||
| S&P 500 | 4,766.18 | 4,463.12 | 6.2% | (6.4)% | up (weak) | down | up | |
| Dow Jones Industrials | 36,333.30 | 34,754.93 | 5.5% | (4.4)% | up (weak) | down | up | |
| Dow Jones Transports | 16,478.26 | 16,497.72 | 8.3% | 0.1% | up | up | up | |
| NASDAQ | 15,644.97 | 13,893.34 | 8.2% | (11.2)% | up (weak) | down | up | |
| S&P/TSX Composite | 21,222.84 | 21,818.47 (new highs) | 1.7% | 2.8% | up | up | up | |
| S&P/TSX Venture (CDNX) | 939.18 | 853.94 | 0.9% | (9.1)% | neutral | down | up | |
| S&P 600 | 1,401.71 | 1,338.72 | 4.2% | (4.5)% | up | down | up | |
| MSCI World Index | 2,354.17 | 2,195.11 | 4.4% | (6.8)% | neutral | down | up (weak) | |
| NYSE Bitcoin Index | 47,907.71 | 40,807.05 | 4.3% | (14.8)% | neutral | down (weak) | up | |
| Gold Mining Stock Indices | ||||||||
| Gold Bugs Index (HUI) | 258.87 | 304.20 | (2.7)% | 17.5% | up | up | up | |
| TSX Gold Index (TGD) | 292.16 | 342.32 | (3.8)% | 17.2% | up | up | up | |
| Fixed Income Yields/Spreads | ||||||||
| U.S. 10-Year Treasury Bond yield | 1.52% | 2.15% (new highs) | 7.5% | 41.5% | ||||
| Cdn. 10-Year Bond CGB yield | 1.43% | 2.19% (new highs) | 10.1% | 53.2% | ||||
| Recession Watch Spreads | ||||||||
| U.S. 2-year 10-year Treasury spread | 0.79% | 0.21% (new lows) | (16.0)% | (73.4)% | ||||
| Cdn 2-year 10-year CGB spread | 0.48% | 0.30% (new lows) | (9.1)% | (37.5)% | ||||
| Currencies | ||||||||
| US$ Index | 95.59 | 98.23 | (0.9)% | 2.8% | up | up | up | |
| Canadian $ | .7905 | 0.7941 | 1.0% | 0.5% | up | down (weak) | up | |
| Euro | 113.74 | 110.50 | 1.3% | (2.9)% | down | down | down | |
| Swiss Franc | 109.77 | 107.28 | 0.2% | (2.3)% | down | down | up (weak) | |
| British Pound | 135.45 | 131.84 | 1.1% | (2.7)% | down | down | neutral | |
| Japanese Yen | 86.85 | 83.94 (new lows) | (1.6)% | (3.4)% | down | down | down | |
| Precious Metals | ||||||||
| Gold | 1,828.60 | 1,929.30 | (2.8)% | 5.5% | up | up | up | |
| Silver | 23.35 | 25.09 | (4.1)% | 7.5% | up | up | up | |
| Platinum | 966.20 | 1,035.90 | (4.8)% | 7.2% | down (weak) | up | up | |
| Base Metals | ||||||||
| Palladium | 1,912.10 | 2,493.00 | (10.9)% | 30.4% | up (weak) | up | up | |
| Copper | 4.46 | 4.74 | 2.4% | 6.2% | up | up | up | |
| Energy | ||||||||
| % | 75.21 | 103.09 | (5.7)% | 37.1% | up | up | up | |
| Natural Gas | 3.73 | 4.86 | 3.0% | 30.3% | up | up | up | |
New highs/lows refer to new 52-week highs/lows and, in some cases, all-time highs.
Canada Inflation 1997–2022
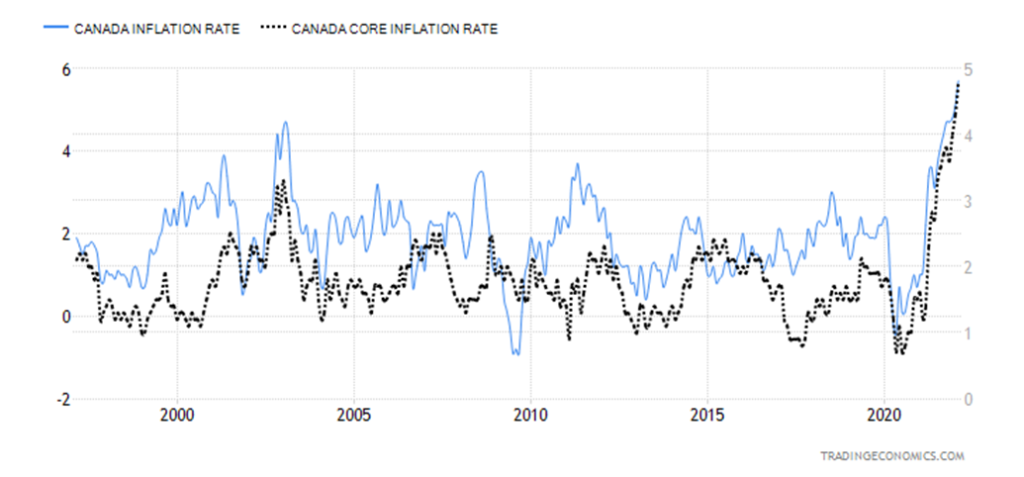
Canada’s inflation rate soared to 5.7% for February, the highest since August 1991. It was also above expectations of a gain of 5.5%. March could be higher as there have already been further price increases since then. The core inflation rate ex: food and energy was up 4.8%. Sharp jumps were seen for gasoline at the pumps, up 32.3% and food up 6.7%. For food it is the fastest growth in 13 years. Other major jumps were seen for shelter, up 6.6%. Canada’s inflation rate has broken out of a 30+ year downtrend. It also points to more gains to come.
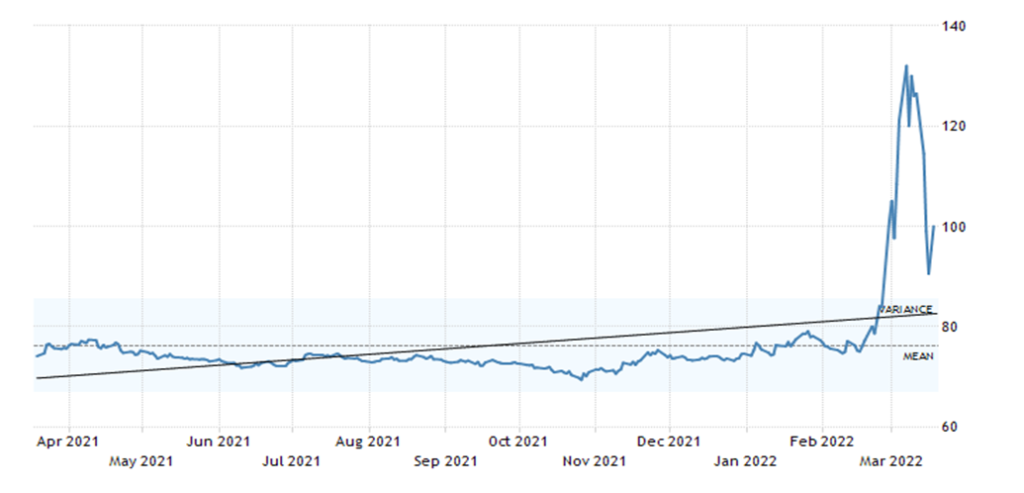
Russian Ruble US$1=
Ukraine Hryvnia US$1=
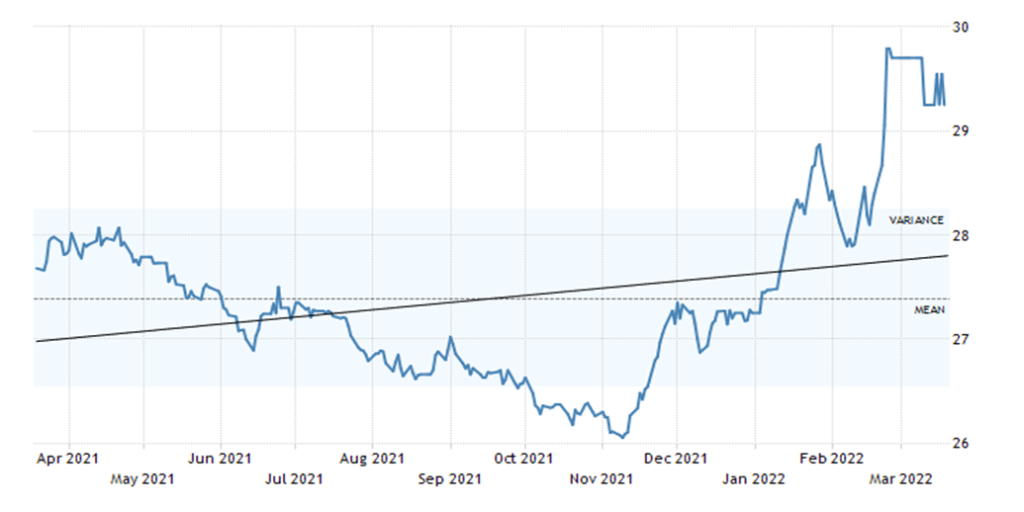
Two currencies headed in the same direction: down. Or, to rephrase, the U.S. dollar can purchase a lot more rubles or hryvnia. Since November 2021 the U.S. dollar has appreciated 36% against the ruble (at the high it had appreciated 69%) while the U.S. dollar has appreciated 12% against the hryvnia. Inflation was running at 10.7% in Ukraine in February while inflation was running at 9.2% in Russia. One area that is sharply different is foreign reserves. Russia had US$630 billion while Ukraine had US$27.5 billion. Both have had their credit rating cut, with Russia listed at risk of default and Ukraine listed as in default. Ukraine had external debt of US$125.0 billion in Q3 2021 while Russia was listed as having US$478.2 billion as of Q4 2021. Most of the debt is owned by foreign banks, mostly in the EU but also by some U.S. banks. Other parties such as pension funds, hedge funds, etc. could own Russian debt as well.
Russia had, according to some sources, deposited $117 million in interest payments on two U.S. dollar denominated bonds. But, according to sources, only some bondholders had received payment while others said they had not. Leading up to the interest payment due date were warnings from credit agencies that Russia may default. Russia says they made the payment. We await confirmation. Russia has $38.5 billion of foreign currency sovereign debt. Russia has an additional $615 million due over the rest of March and a bond of $2 billion is to be paid in full on April 4. While some allow payment in rubles, the payments due on March 17 were to be paid in U.S. dollars; otherwise, it would be considered a default.
For the bulls it was enjoyable week as markets rebounded. Some are now calling the mini-bear over. We are not so sure, but we do accept that we could be making a more extended corrective period. Everything is to some extent dependent on the ongoing war in Ukraine. If that suddenly ended, the markets would likely rally further. The Fed hiked rates this week as was expected and Chairman Jerome Powell remains upbeat and bullish on the U.S. economy. On the other hand, there are those who believe we are already into the early stages of a recession. Certainly, we’ve had a number of signs that we are headed for one. Inflation over 5%, sharply rising oil prices and commodity prices that are pressuring inflation to the upside, a war, and before that COVID that helped disrupt supply lines. And need we mention the sanctions on Russia and trade tariffs that were put on China under President Trump that remain? And now this week we have the U.S. hinting at “consequences” against China if they help Russia. Sanctions against China, the world’s second-largest economy?
Markets jumped nicely this past week. The S&P 500 gained 6.2%, the Dow Jones Industrials (DJI) was up 5.5%, the Dow Jones Transportations (DJT) continued to be a bit of a star, up 8.3%, while the NASDAQ gained 8.2%. The small-cap S&P 600 gained 4.2% while the Mid-Cap S&P 400 was up 5.3%. A great week. In Canada, the TSX made new all-time highs but only up 1.7%. The small-cap TSX Venture Exchange (CDNX) gained 0.9%. Overseas, the MS World Index was up 4.4%. In the EU, the London FTSE gained 4.0%, the Paris CAC 40 was up 5.8% as was the German DAX. In Asia, China’s Shanghai Index (SSEC) faltered, making new 52-week lows, off 1.8% as shutdowns loomed because of a resurgence of COVID. And as well, China as noted, was threatened by ‘’consequences” from the U.S. if they helped Russia.
Signs that there might be a peace deal between Russia/Ukraine get markets going that the time to buy is upon us once again. But a reminder that the sanctions remain even if peace is achieved. None of that is good for global trade. And, as we noted, China is shutting down because of another COVID outbreak, which is a negative as it further disrupts the supply chains that have already been severely disrupted. The U.S. has had great job gains, but here we are two years after the March 2020 shutdown and the nonfarm payrolls are still short of where they were in February 2020. Usually, we should be well past the old high by now. The Fed is often too late to catch on for what to do. Inflation rose and the Fed called it transitory. It is no longer looking that transitory. The Fed, not surprisingly, is behind the curve, just starting to hike rates. Real incomes are declining after inflation and manufacturing is showing some signs of slowing. Housing sales are also showing some signs of slowing. With inflation still high, we have stagflation. Not good for stocks, but certainly good for commodities.

The above chart we saw from John Maudlin economics (www.mauldineconomics.com) shows the drawdowns the stock markets made in each of the recessions since 1945. Since we believe the current recession may already be in its early stages, it is something to keep in mind going forward. Defensive is the word.
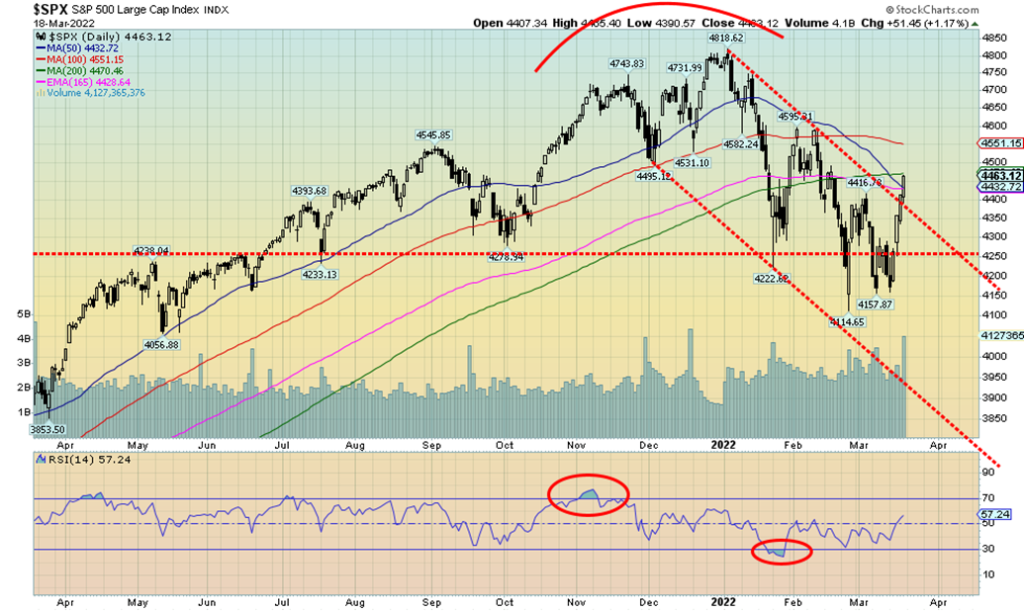
The S&P 500 has broken out of what appears as a downtrend line from the January high. The decline appears to us as an ABC pattern. The question is, how high could we go? Key levels are seen at 4,385, 4,465, and 4,550. New highs are possible above 4,650. As we note with some of the sentiment indicators, some are showing bullishness while others are showing we should be cautious. The S&P 500 Bullish Percent Index (BPSPX) is up to 64.8% which is a surprisingly bullish move in the past week. A week ago, it was 36.20. Still, only 50% of S&P 500 stocks are trading above their 200-day MA and 55% above their 50-day MA.
We are embarking on what appears to be a corrective move of the decline since the January 4 high. Are we starting a new bull move to new highs? Corrective waves are usually playable—for traders. Investors may wish to use the rally to re-balance their portfolios to a more defensive stance if they are not there already. Irrespective of this, we couldn’t help but notice that the big moves this past week were technology stocks; i.e., the FAANGs. They led the market up and they will lead the market down. As to value stocks, well, Berkshire Hathaway just made new all-time highs this past week.
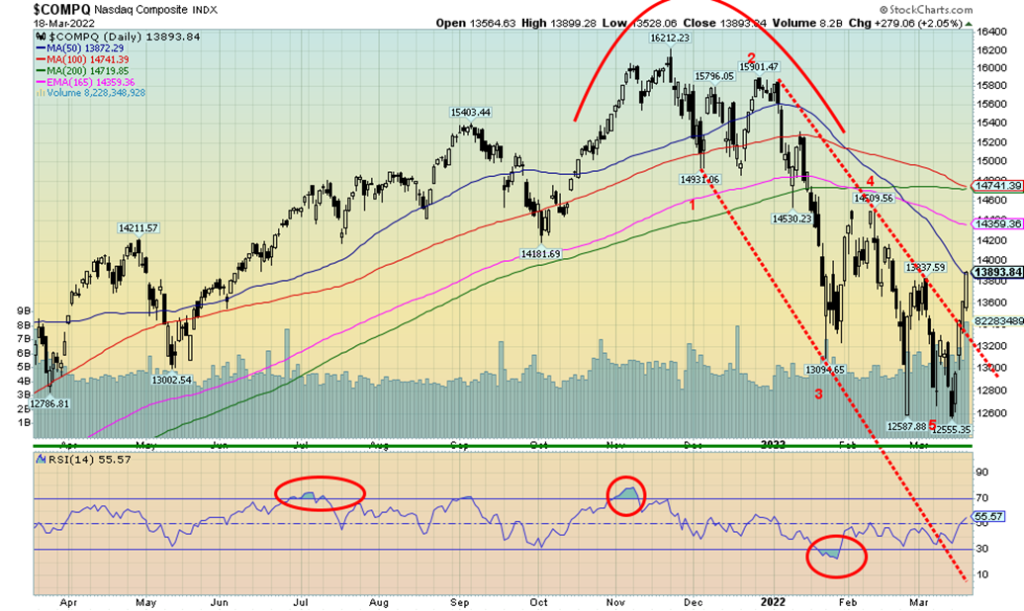
Is a bottom in? Well, the NASDAQ this past week appears to have broken above a downtrend line from the late December highs. The FAANGs had a gangbuster week. Meta was up 15.4%, Apple up 6.0%, Amazon +10.8%, Netflix +11.8%, Google +4.9%, Microsoft +7.3%, Tesla +13.8%, Twitter +14.5%, and the Chinese stocks seemed to lose their fervor for being delisted as Baidu was up 25.3% and Alibaba up 24.9%. Finally, Nvidia was up 19.7%. As we said, gangbusters.
Many are hailing the bottom is in. We remain suspicious. Bottoms are usually rounded affairs, although sudden sharp declines like we saw in March 2020 can result in spike bottoms. We note that for the move the NASDAQ did see new lows on March 14 but the DJI and the S&P 500 did not, a possible divergence. The NASDAQ still has a way to run before it can be considered that a final low is in. We’d like to see it at minimum over 14,500 and preferably over 14,700. Over 15,350 would suggest new highs ahead.
The NASDAQ appears to have fallen in five waves to the 12,555 low on March 14. However, the S&P 500 and the DJI appear to have only fallen in an ABC-type pattern. We’d label this wave 1 or A of a larger intermediate decline. If the NASDAQ is correct, we are starting what could be a corrective period or wave 2 or B up. B waves in a bear market are fascinating as we could actually see new highs. On the other hand, we could correct up to 13,950 to 14,815 and still only be in a correction pattern. If the 5-wave decline is correct, then we could make a correction in an ABC pattern or an ABCDE-type pattern. Volumes were high at the end of the week.
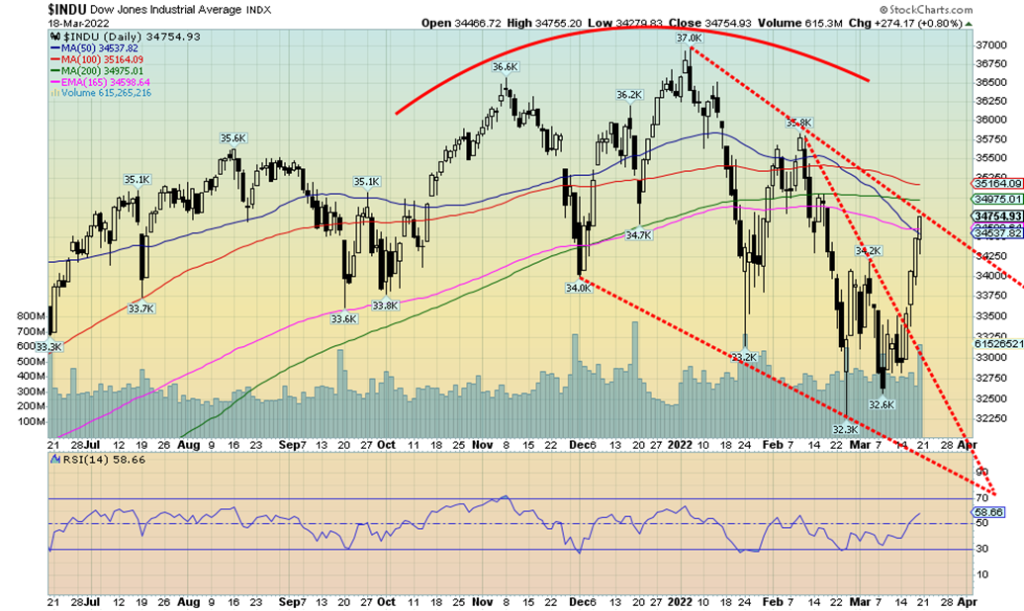
We are no longer considering the DJI made a head and shoulders top. No, we haven’t yet taken out that right shoulder high near 35,800, but we do appear to have broken up from what appeared as a falling or descending wedge pattern. If that’s correct, then we should regain that 35,800 level as a minimum. A break above that level could then suggest that we will go higher. A move above 35,850 would suggest new highs are possible. The run-up has been swift and steep and usually moves of this nature are not sustainable. That’s a reason why we remain somewhat suspect of this rally. We have now rallied to what appears as another downtrend line from the January top. If correct, then we should just about run our course. A return back under 34,200 would be the first good sign this was running out of steam.
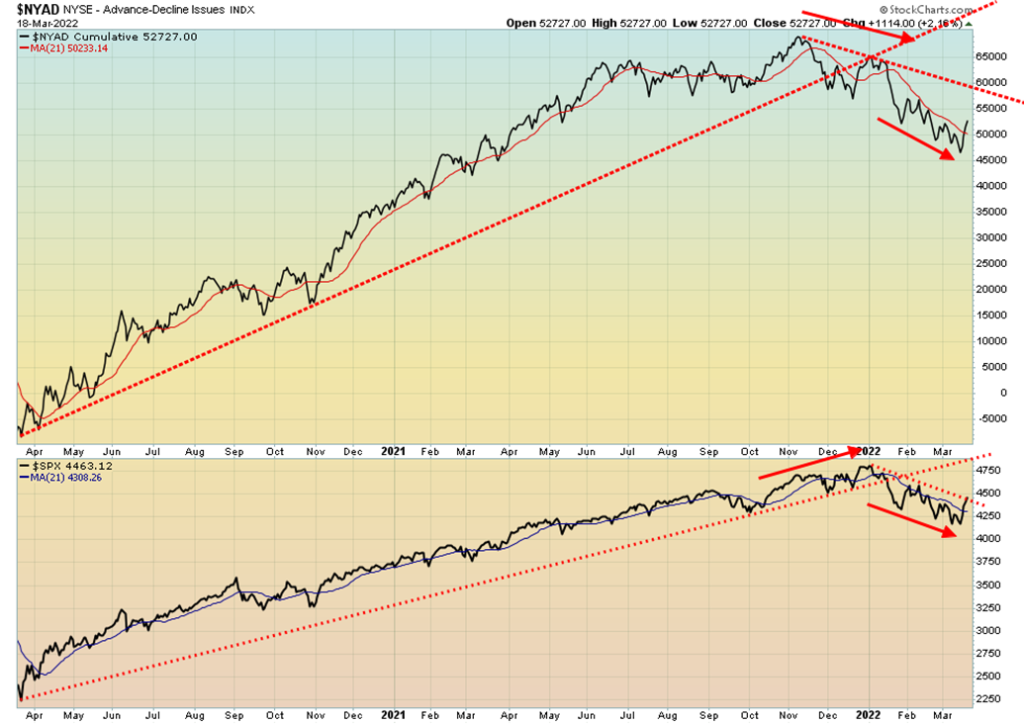
We like to see divergences at important tops and bottoms. Note how the NYSE advance/decline diverged with the S&P 500 back in late 2021. While the S&P 500 continued higher to new highs, the AD line was falling, making a lower high. A negative divergence. At a bottom, we’d like to see a positive divergence. So far, we see none as both the S&P 500 and the AD line are still aligned up and down.
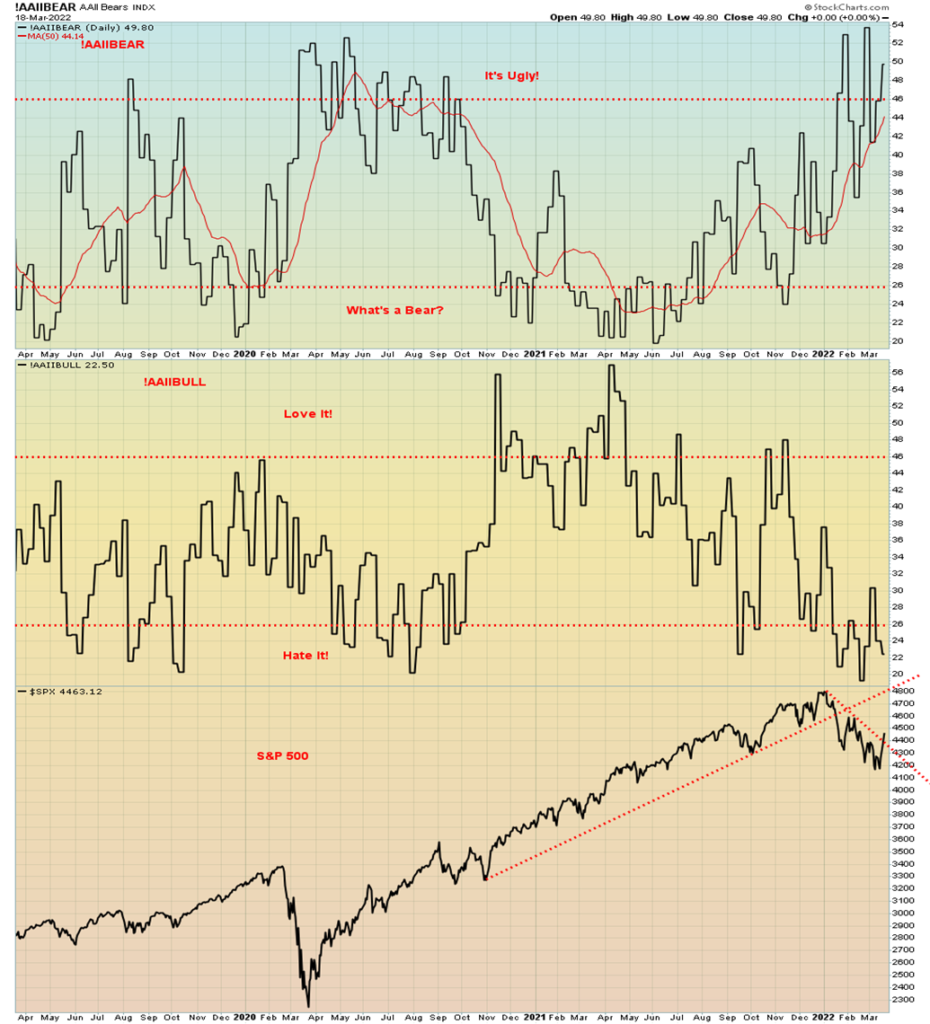
The all-bears index and the all-bulls index above are suggesting that the markets could be making a bottom. The all-bears index is suggesting things are ugly while the all-bulls index is suggesting maximum pessimism in the “hate it” range. So, which is it as other indicators are not so negative? But it is something to note.
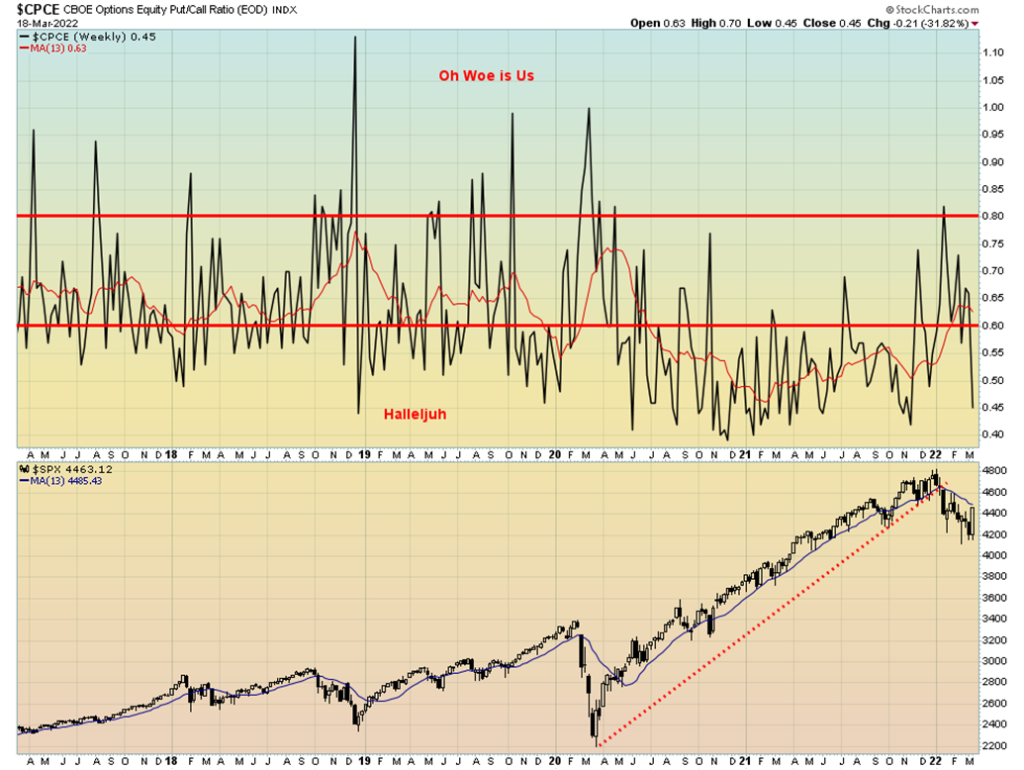
Hard to believe how bullish the market became in the past week. The put/call ratio fell to 0.45 this past week, deep into bull territory. It’s now not far from its lows, even as the S&P 500 remains well below the January 4 highs. This indicator appears to be saying the opposite to the bull/bear indices.
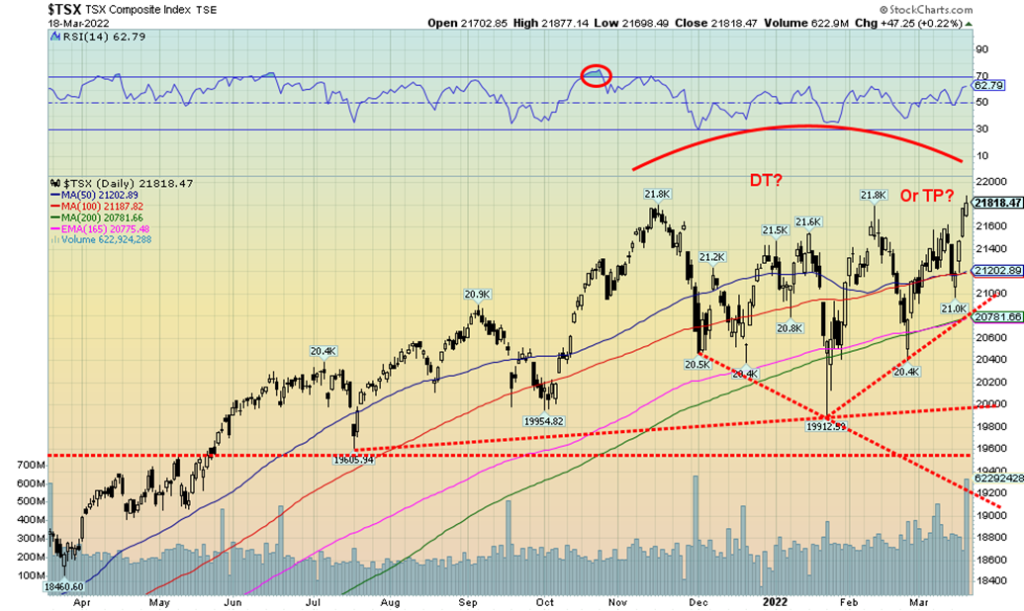
The TSX Composite is the star. The TSX Composite hit new all-time highs this past week at 21,877, taking out the high seen in November 2021. We are now not putting a lot of faith in the possibility of a triple top. Triple tops are rare. Instead, we could go higher still. The catalyst, of course, is the strong-performing materials markets (golds, metals & mining) along with energy. But they fell this past week. So, what helped push the TSX to new heights? Well, Information Technology (TKK) rebounded sharply, up 10.8% on the week. Consumer Discretionary (TCD) also rebounded strongly, up 4.7%. Income Trusts (TCM) made new 52-week highs, up 1.1%. Health Care (THC) also had a strong week, up 7.8% (way overdue). But six out of the TSX 14 sub-indices were down on the week led by Golds (TGD), off 3.8%. Energy (TEN) fell 3.4% and Materials (TMT) dropped 1.8%. Telecommunications (TTS) was also down, off 2.2%. We can’t predict here how high the TSX might go. An argument could be made based on the triangle that formed over the past four months of a possible move to 23,600/23,700. But to get there we’d need to see strong moves in the commodity-based indices: Golds, Metals, Materials, and Energy. We continue to believe these are the sectors to be in going forward. As we have often noted, the stocks in these sectors remain cheap. The TSX Composite continues to have support down to around 20,800 although trouble is seen under 21,200.
U.S. 10-year Treasury Bond/Canadian 10-year Government Bond (CGB)
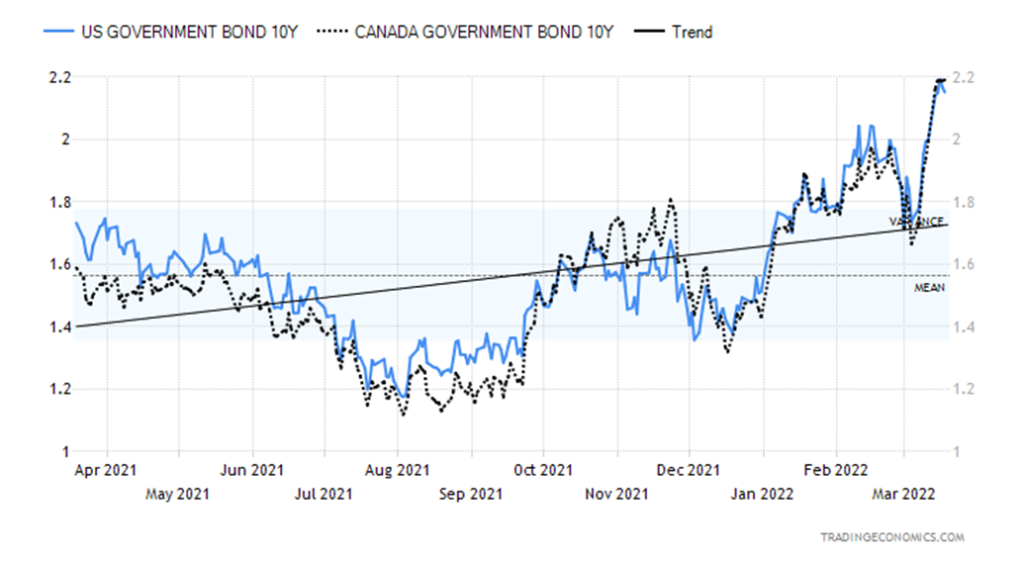
The Fed as expected raised interest rates by 25 bp this past week. There are suggestions that the Fed could hike rates five or six more times in 2022. The next hike is not expected until June. The 10-year U.S. treasury note rose to a high of 2.20% this past week, the highest level in the year. In settling at 2.15% it was up 7.5% on the week. The Canadian 10-year Government of Canada bond (CGB) rose 10.1% to 2.19%, the high of the week. But then the 2–10 spreads narrowed. The U.S. 2-10 spread plunged to 21 bp, the lowest level since March 2020. That was down 16% on the week. The Canadian 2–10 spread fell to 30 bp, off 3 bp or 9.1%. The 2–10 spreads continue to hint that we could soon go negative, signaling a potential recession.
Did we see hints of a weakening economy? The NY Empire Manufacturing Index came in at negative 11.8% when they expected +7%. The PPI was up 10% y-o-y. That was largely as expected. Retail sales for February were up 0.3% but they expected a gain of 0.7%. Y-o-y retail sales were up 16.6% but that was before adjusting for inflation and population. Real retail sales were up 7.0%. The Philly Fed manufacturing index was 27.4, better than the expected 17. Initial jobless claims were 214,000, slightly below expectations of 220,000 and last week’s 229,000. But home sales faltered. Existing home sales fell 7.2% in February and were down sharply from a month earlier. Could the housing market be slowing?
Canada saw inflation hit the highest level in 30 years. Housing starts continue to be to the upside, boding better for the Canadian economy especially with mask mandates coming off everywhere. Retail sales grew 3.2% in January.
The question is, how high could rates go? Based on the breakout to new highs, the 10-year could rise next to around 2.35%. The highest level most recently was in March 2018 when the 10-year hit 3.21%. The 10-year doesn’t break down until back under 1.50%. That’s not expected anytime soon as the trend is now solidly to the upside.
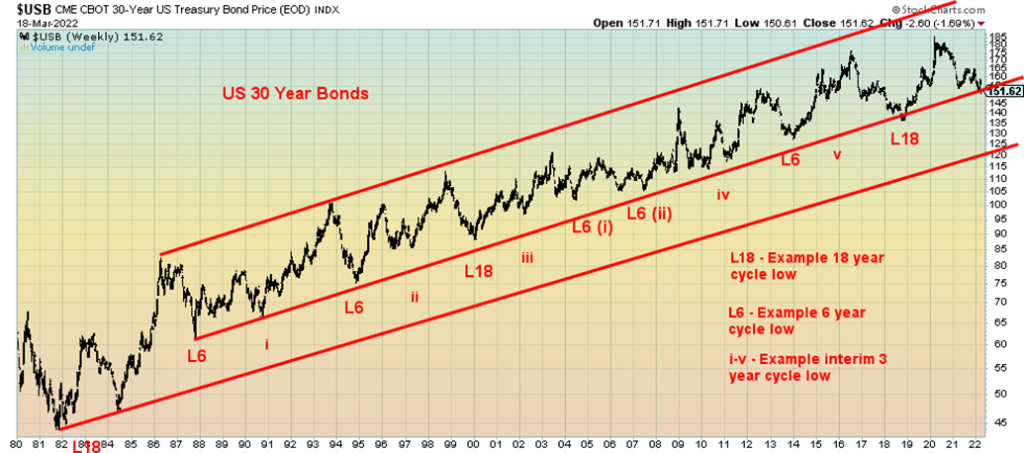
With bond yields headed to their highest level in a year, we thought we’d take a quick look at our long-term cycles in bonds once again. The U.S. long bond (30-year) has shown over the years a reasonably consistent cycle of six years with a longer-term cycle of 18 years (3–6-year cycles). The 6-year cycle in turn breaks down into either two 3-year cycles or three 2-year cycles. The last 6-year and 18-year cycle bottomed in 2018. That puts the next 6-year cycle to bottom sometime out into 2024. Given a low in 2021 followed by a rebound, that may have been our 3-year cycle low. But now we have broken down under that last 3-year cycle low and we also appear to be breaking the long uptrend line from lows dating all the way back to 1987. That’s possibly a remarkable development as it suggests that we could be headed to an even larger sell-off for bonds and test the uptrend line from the 1981 low. Note the nice series of 6-year cycle lows (5–7 years spread) in 1987, 1994, 2000, the double bottom of 2005/2007, 2013, and then again in 2018. The next low is due in 2023–2025. If we are truly breaking that uptrend line from 1987, we are in for some trouble. Sharp declines in bond prices (rise in yields as yields move inversely to prices) have led in the past to collapses of bond funds.
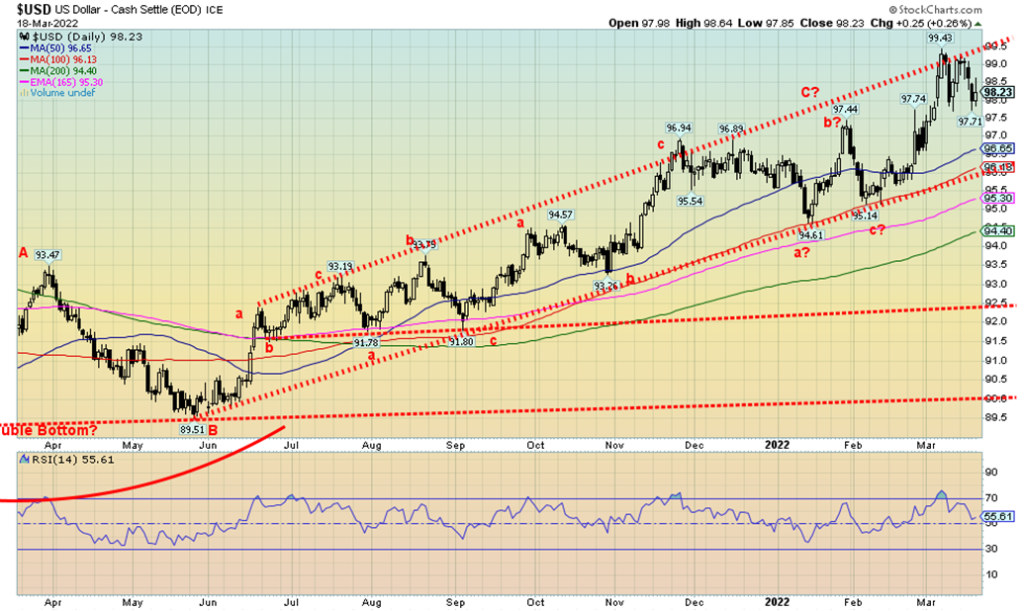
Has the US$ Index topped? Lower highs get us looking at the downside. The high was made on March 7 at 99.43 then on March 14 the US$ Index made a lower high at 99.30. We now have a defined break zone at 97.70. If that breaks we start to confirm the high and could project down to 96 as a minimum objective. The US$ Index has been benefitting from the Russia/Ukraine war with funds fleeing the EU and into U.S. treasuries. But with U.S. treasuries seemingly now falling in price (rising in yield), maybe they are not so attractive. Also with the U.S. threatening more sanctions on Russia and threatening China with consequences if they help Russia, one might wish to reconsider the U.S. dollar as a safe haven.
The US$ Index fell 0.9% this past week. The euro was up 1.3%, bouncing off its lows, the Swiss franc gained a small 0.2%, the pound sterling was up 1.1%, but the Japanese yen continued its losing ways to fresh 52-week lows, down 1.6% on the week. Fears are that Japan is close to falling into a recession again. Japan is highly dependent on oil imports and with the price of oil screaming to new highs it is starting to bite the Japanese economy. The Canadian dollar gained 1.0% this past week.
The fall in the US$ Index is a bit of a surprise, considering the Fed raised rates this past week while the ECB thus far has not. Higher rates in the U.S. are supposed to attract capital from the country with the lower interest rates. Indeed, the ECB is not indicating a rate hike anytime soon, unlike the U.S. that continues to indicate six hikes in 2022. Furthermore, the EU is already showing signs of sliding into a recession whereas the U.S. has not just yet. But we look at the technical picture and that suggests to us we should move lower for the US$ Index.
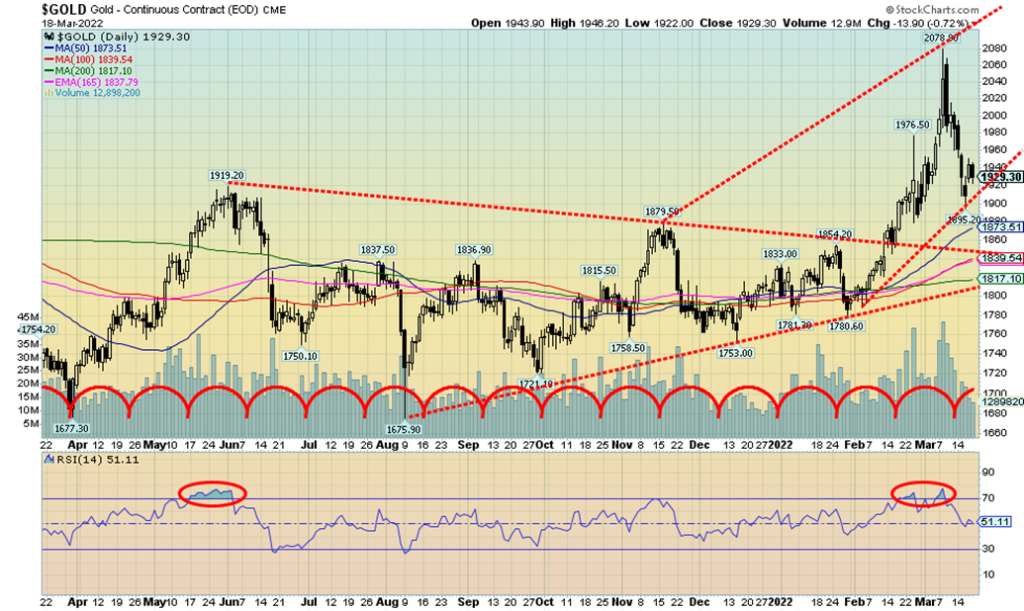
Correction time for gold as talk of a peace deal between Russia and Ukraine lessened gold’s appeal as a safe haven. The correction from the almost new all-time highs was about 9%. Fairly normal so far. The question is, is the correction over?
This past week gold made its biggest weekly drop in four weeks, losing 2.8%. Silver fell more, off 4.1%. Platinum dropped 4.8% while of the near precious metals, palladium fell a sharp 10.9% but copper gained up 2.4%. The gold stocks were also down with the TSX Gold Index (TGD) off 3.8% and the Gold Bugs Index (HUI) down 2.7%.
If there is a metal to watch going forward it is uranium that hit a high of $60/pound the previous week before settling at $57.25 this past week. Russia produces some 2,900 tons of uranium, the sixth highest in the world. Australia has the world’s highest reserves and production. The trouble is, the U.S. is considering imposing sanctions on Russia’s state-owned Rosatom. Rosatom produces some 42% of the globe’s uranium refinement. Rosatom also accounts for some 25% of the U.S.’s imports of nuclear fuel. The U.S. relies on nuclear energy for 25% of its energy needs. So, sanctions against Rosatom could spark further gains for uranium prices.
Over at the LME the nickel markets remain in turmoil. They tried to restart trading in nickel and then had to quickly shut it all down again. Volatility reigns.
Gold fell into what appears to be a short-term cycle low this past week. The low on the week was seen at $1,895 and we have noted that we’d like to see the $1,900/$1,920 zone hold. So far, so good. Under $1,875 we’d have to reconsider the current bull market. But real trouble for the gold bull would not come until we broke under $1,800/$1,820. Given all of the background news of the ongoing war and rising inflation/stagflation, we are not expecting that. However, a period of consolidation would not be out of the question.
Gold needs to regain back above $2,000 to suggest that we could make new all-time highs. We did get a one day close over $2,000 (March 8) but that was it and we did not confirm it with consecutive closes. The next day March 9 gold fell sharply. Volumes fell off pretty quickly, suggesting to us that this down move was corrective in nature. A key going forward may be the US$ Index that has of late remained elevated. However, as we note, that may soon be coming to an end.
The large symmetrical triangle that gold appeared to form from May 2021 to February 2022 suggests targets up to at least $2,100. Arguably, we came close with the high of $2,078. That’s why it is important that we eventually make new highs to suggest even higher levels up to around $2,200 to $2,400. Talk of gold $10,000 is just that. Anything may be possible and there is an argument for it but at this point we can’t see it. One step at a time. Oh yes, and hold above $1,800 but preferably continue to hold $1,900/$1,920.
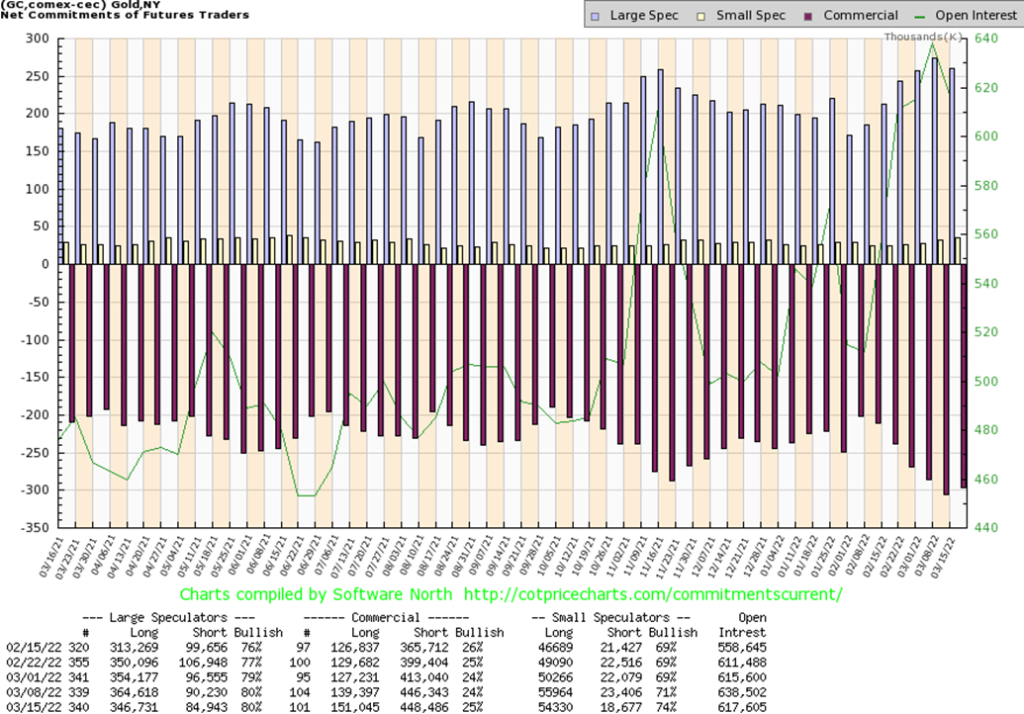
The gold commercial COT (bullion companies and banks) rose slightly to 25% from 24% this past week. Long open interest jumped almost 12,000 contracts while short open interest was only up about 2,000 contracts. We view that as at least somewhat positive. The large speculators COT (hedge funds, managed futures, etc.) was steady at 80% although their long open interest fell roughly 18,000 contracts but short open interest also fell down just over 5,000 contracts. Overall open interest fell about 21,000 contracts on a down week for gold, suggesting short covering. The COT report only goes to Tuesday so it did not capture the latter part of the week when gold fell more.
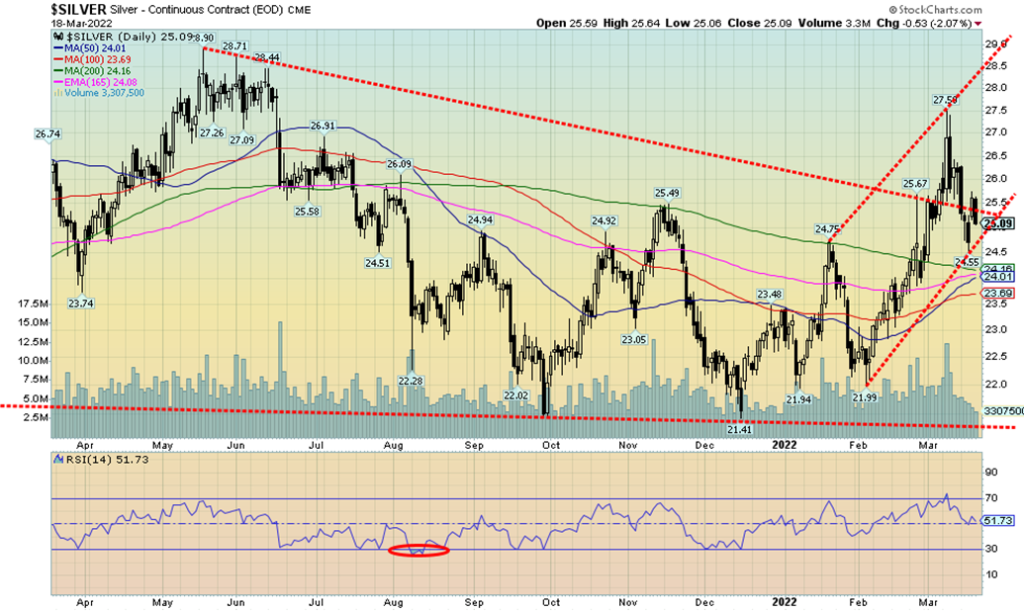
Silver fell 4.1% this past week, hitting a low of $24.55 just above the 200-day MA currently at $24.16. So far, this looks like a normal correction and a test of the 200-day MA. We’d be more concerned if we were to break under $24 and especially under $23.50. At that level we’d have to consider the bull move over. The decline from the high of $27.50 was roughly 11%, a fairly normal correction. The decline this past week appears to have created a well-defined bull channel. But breakdowns under our points would put us on the defensive. We continue to be concerned that gold made new highs but silver isn’t even close. These are divergences that at help maintain some degree of caution and not get overly bullish as the gold people tend to do. But we like the looks of the bottom pattern that was made between the May high and the recent breakout of the downtrend line. Yes, we tested back under but so far it appears as a normal correction. We may not be quite finished, but as long as we hold the low of the past week at $24.55, we should be okay. However, as noted, the real line in the sand comes at $24 and $23.50. To the upside, we need to regain above $26.50 and above $26.80 new highs are probable. Above those levels the next band of resistance can be seen at the May highs between $27.25 and $29.
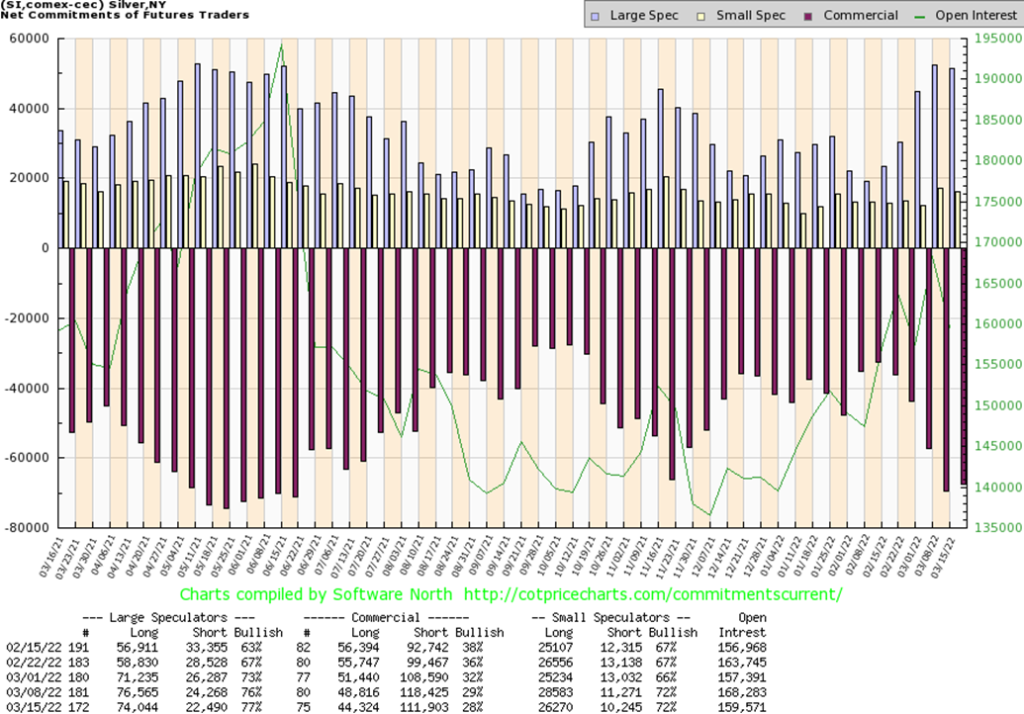
The silver commercial COT slipped to 28% this past week from 29% as long open interest fell over 4,000 contracts but short open interest also declined off about 7,000 contracts. Overall open interest fell about 9,000 contracts on a down week, suggesting that the decline was corrective only and not the start of a new move to the downside. The large speculators COT rose to 77% from 76% as their long open interest fell over 2,000 contracts while short open interest also fell down about 2,000 contracts. The COT, as we note, only goes to Tuesday so next week’s COT will determine whether any further shorts were covered in this sell-off.
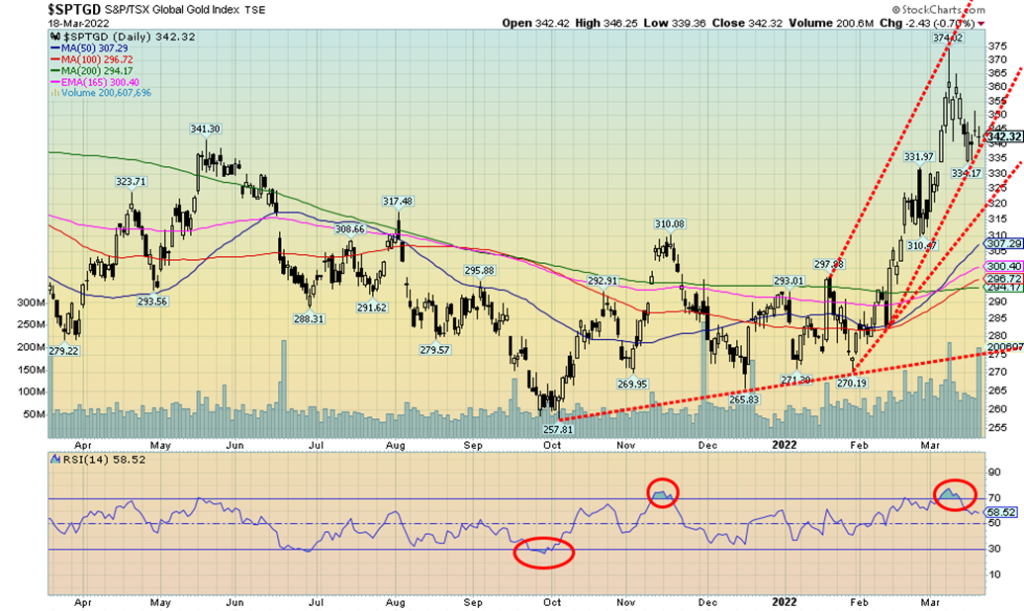
The gold stocks followed gold/silver lower this past week with the TSX Gold Index (TGD) falling 3.8% and the Gold Bugs Index (HUI) off 2.7%. That still leaves them up in 2022 17.2% and 17.5% respectively. Given the decline for both gold and silver the gold stocks, we believe, held in quite well. Even the Gold Miners Bullish Percent Index (BPGDM) pulled back to 72 from 80. That puts the sentiment indicator back in high neutral territory. Over 80 is considered overbought. During the 2020 run to new all-time highs the BPGDM hit 100.
What we appear to have done this past week is to create a more balanced bull channel. The TGD would have had to break down under 320 to consider a top confirmed. But now we have a good parallel channel. A breakdown under 340, which we admit is very close, could suggest further declines. Regaining above 350 would be positive and above 365 would suggest new highs. We are reminded that during the run-up to new all-time highs in 2011 there were at least three pullbacks of 20% or more. Thin markets, such as gold stocks, are subject to some volatile moves. This initial pullback was about 11% and a further decline would not be a surprise. As long as we were to hold 320, we’d consider the bull market intact.
The decline has eased overbought conditions and moved the RSI down into neutral territory. There were no negative divergences on the daily charts at the recent highs. For these reasons we remain positive on gold stocks going forward. As well, the gold/HUI ratio at 6.34 is still showing gold stocks as cheap vs. gold. Gold stocks aren’t expensive vs. gold until under 2.5. We haven’t seen that since 2010/2011. The all-time high was 10.9 back in 2015.
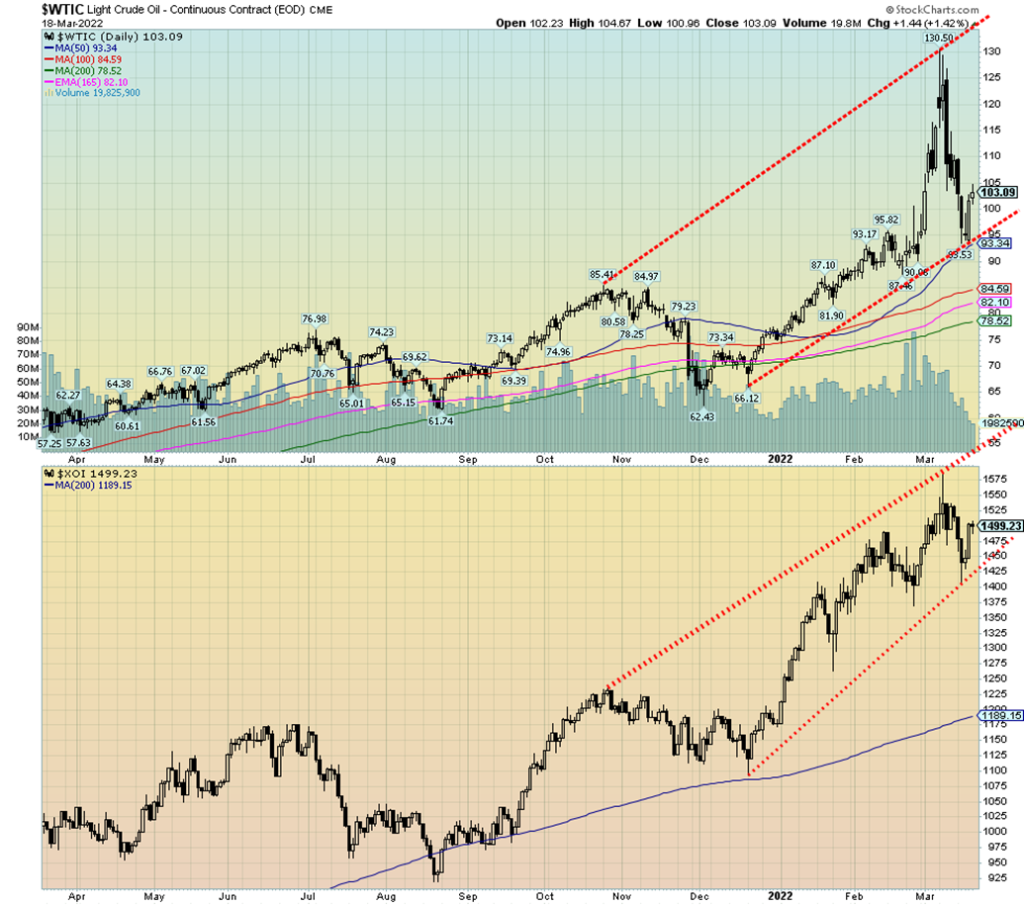
If peace breaks out tomorrow between Russia and Ukraine, will oil prices fall back to earth? That is the question being asked as the latest rounds of possible peace talks sparked a sell-off in oil prices that saw them fall a very fast 28% from the high set on March 7 at $130.50. Yes, that was 28%. Technically a bear market. Then came the rebound when peace didn’t look so sure. But the close of the week at $103.09 was still off 21% from the high. Again, technically a bear market. As well, it appeared that we were breaking the lower channel when in fact all we may have done was to redefine it.
The reality is, even if peace were to be achieved tomorrow, the sanctions would remain. So, nothing really would change. There continue to be forecasts of $200 oil. We did test down to the 50-day MA, but the line held. At the high of $130.50 oil was some 45% above the 50-day MA so a pullback was most likely in order. As well, the RSI indicator had been in overbought territory since late February into early March. A correction was probably overdue.
So, the question begs, is this a correction within the context of a bull market or have we fallen far enough that we are now entering a bear market? This past week WTI oil fell 5.7% while Brent crude was down 4.2%. Natural gas (NG) bucked that trend and was up about 3.0%. Gasoline futures only fell 2.3% while heating oil was down only 1%. Gas at our local gas station down the street fell from $1.90/liter to $1.63/liter, a decline of around 14%.
Given that sanctions will remain no matter what, we are more inclined to look at this as a very sharp correction within the context of a bull market. The last significant weekly low we had was back during the week of February 14 at around $87.50. The last significant monthly low was in December at $62.43. Those points would define whether we have entered a bear market better than the swift decline we witnessed over the past week. One thing that North Americans may still have to face is the potential for shortages to develop. The IEA is suggesting that a 3 million b/d supply crunch may be coming if the war continues. Sanctions could force Russia to cut because of shrinking marketing opportunities and falling exports. Further OPEC members continue to not increase production. Again, according to the IEA, OPEC is underperforming by at least one million b/d.
It was telling that we read stories that Saudi Arabia and UAE were not picking up the phone for President Biden. As well, the British failed to gain any jump for production from the Saudis and UAE. In another move that we noted earlier, the Saudis are considering accepting Chinese yuan from China for its oil. That would be a blow against the U.S. dollar.
So, if this week’s fall was effectively wiping out the war premium, where do we go from here? Probably some consolidation for at least another week or so before we start moving higher once again. As we noted, all we seemed to do this week was move the lower channel boundaries slightly down; otherwise, the uptrend is intact. Vicious as the decline was, it was only profit-taking in an overbought, hyped-up market. We note that the U.S.’s strategic oil reserves continue to fall. The U.S. currently has the equivalent of about five months’ supply at 4 million b/d drawdown.
What we have to watch is the $95 zone. If we were to break under that level, then the odds could favour a test lower. We can’t rule another test under $100 until we at least regain above $115. Above $122 new highs are probable. The recent drop corrected between 50% and 61.8% of the move from $62.43 in December to the high of $130.50. So far, a normal correction. Under $78.50 new lows would be possible. Also, possibly supporting higher prices going forward was that the energy stocks were not too badly hit. The ARCA Oil & Gas Index (XOI) fell 1.0% this past week while the TSX Energy Index (TEN) was off 3.8%. Despite that, oil stocks remain cheap vs. oil. The WTI oil/XOI ratio is currently at 0.07. We wouldn’t consider the oil stocks expensive until we regained over 0.13.
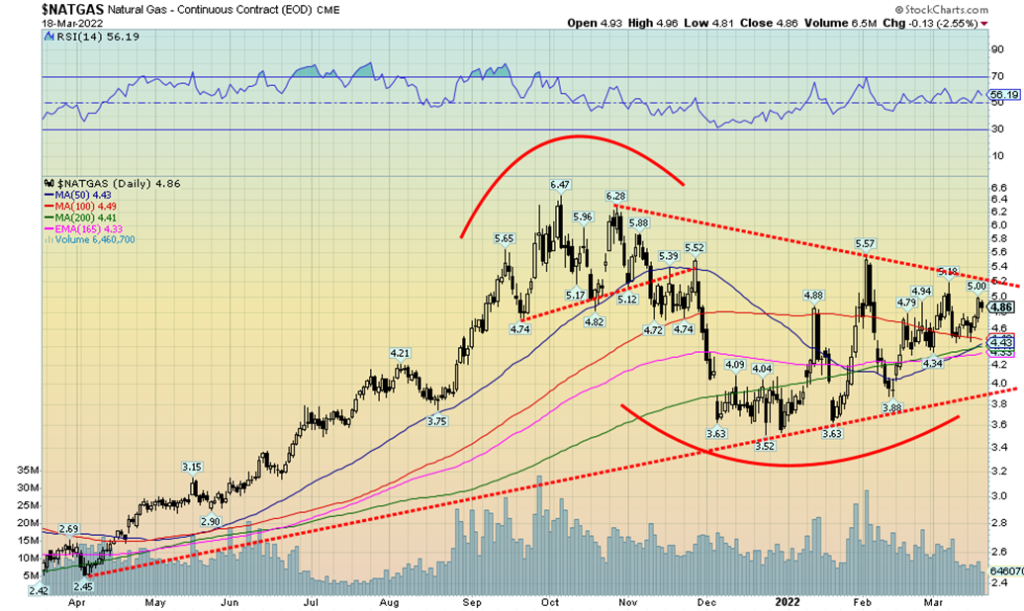
Natural gas is also cheap. NG breaks out over $5.20 from what appears as large symmetrical triangle. After that, NG projects up to around $8-$8.25. High energy prices have preceded every recession since 1970. We don’t expect this to change going forward.
__
(Featured image by Marga Santoso via Unsplash)
DISCLAIMER: This article was written by a third party contributor and does not reflect the opinion of Born2Invest, its management, staff or its associates. Please review our disclaimer for more information.
This article may include forward-looking statements. These forward-looking statements generally are identified by the words “believe,” “project,” “estimate,” “become,” “plan,” “will,” and similar expressions. These forward-looking statements involve known and unknown risks as well as uncertainties, including those discussed in the following cautionary statements and elsewhere in this article and on this site. Although the Company may believe that its expectations are based on reasonable assumptions, the actual results that the Company may achieve may differ materially from any forward-looking statements, which reflect the opinions of the management of the Company only as of the date hereof. Additionally, please make sure to read these important disclosures.
David Chapman is not a registered advisory service and is not an exempt market dealer (EMD) nor a licensed financial advisor. He does not and cannot give individualised market advice. David Chapman has worked in the financial industry for over 40 years including large financial corporations, banks, and investment dealers. The information in this newsletter is intended only for informational and educational purposes. It should not be construed as an offer, a solicitation of an offer or sale of any security. Every effort is made to provide accurate and complete information. However, we cannot guarantee that there will be no errors. We make no claims, promises or guarantees about the accuracy, completeness, or adequacy of the contents of this commentary and expressly disclaim liability for errors and omissions in the contents of this commentary. David Chapman will always use his best efforts to ensure the accuracy and timeliness of all information. The reader assumes all risk when trading in securities and David Chapman advises consulting a licensed professional financial advisor or portfolio manager such as Enriched Investing Incorporated before proceeding with any trade or idea presented in this newsletter. David Chapman may own shares in companies mentioned in this newsletter. Before making an investment, prospective investors should review each security’s offering documents which summarize the objectives, fees, expenses and associated risks. David Chapman shares his ideas and opinions for informational and educational purposes only and expects the reader to perform due diligence before considering a position in any security. That includes consulting with your own licensed professional financial advisor such as Enriched Investing Incorporated. Performance is not guaranteed, values change frequently, and past performance may not be repeated.

-
 Biotech2 weeks ago
Why Bioceres Shares Slide Into Penny Stock Territory
-

 Crowdfunding4 days ago
Real Estate Crowdfunding in Mexico: High Returns, Heavy Regulation, and Tax Inequality
-

 Africa2 weeks ago
Agadir Allocates Budget Surplus to Urban Development and Municipal Projects
-

 Cannabis15 hours ago
South Africa Proposes Liberal Cannabis Regulations with Expungement for Past Convictions


