Featured
What’s up with the bull market?
From stock markets to creditors, even properties and cryptocurrencies, it seems that we are experiencing a bull market.

“The bull market in everything”—so blared the headline of the latest issue of The Economist (October 7th–13th 2017).
Well, we don’t wish to fully embrace the alarmists but the bull market since the bottom of March 2009 is not yet the granddaddy of all bull markets. So far, the current bull market is 104 months old, having experienced only two pullbacks, both less than 20% in 2011 and 2015/2016.
The “Roaring 20s” bull market lasted 97 months with only one significant correction under 20% and few other milder pullbacks. The “biggest bull” still belongs to the 1990s dot.com and tech boom that lasted 112 months with only one major correction under 20% in 1998. So the current one still has potentially a few months to go to overtake that bull market.
In terms of gains, the current bull is up (Dow Jones Industrials (DJI) 254%, certainly an impressive gain. But the “Roaring 20s” bull gained 495% and the 1990s bull tagged on 396%. The current bull still has ways to go to equal either one. Both bull markets ended with the collapse from 1929 to 1932 seeing the DJI lose 89% while the dot.com collapse of 2000–2002 dropped 38% only to be followed five years later with the financial crisis of 2007–2009 that saw the DJI collapse almost 54%. A reminder that roaring bull markets rarely end well.
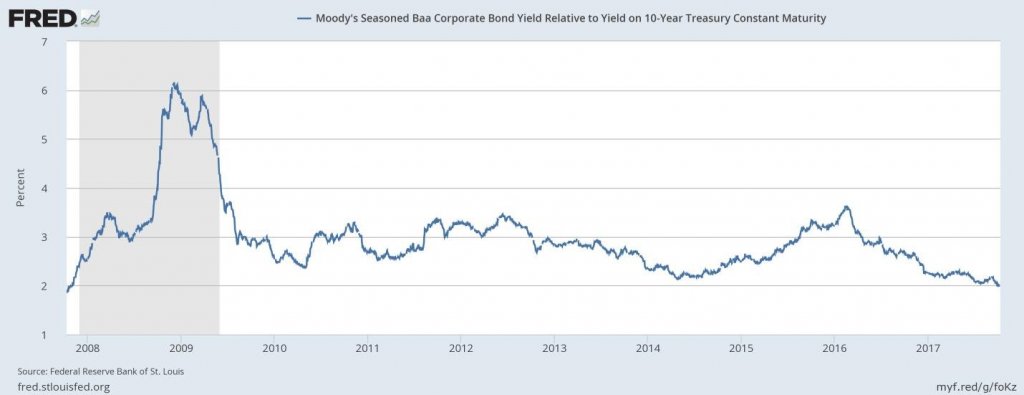
The Economist article referred to the bull market in everything. The stock market has not been the only bull market. Bonds too experienced a powerful market that may well have peaked in 2016. The bond bull wasn’t limited to just government bonds but to all credits, especially what is referred to as “junk bonds” as credit spreads narrowed sharply.
Our chart below shows the spread between Baa corporate bonds relative to 10-year US Treasury notes at the lowest level in a decade (currently 1.97%). The only time the spread has been lower was in the run-up to the top in 2007. While higher, the spread between US 10-year Treasury notes and “junk” bonds (rated BB or lower by S&P, and Ba or lower by Moody’s) is also at or near record lows.
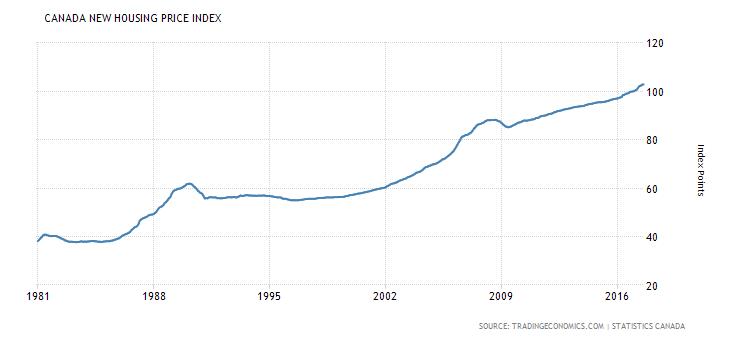
Housing prices have also been on a tear since 2009. US housing prices are virtually back at the highs as our chart of the Case-Shiller home price index indicates. According to The Economist story, they are above their long-term average relative to rents. Prices in Britain and parts of the EU have also soared and they have especially soared in Canada (chart below) and Australia.
But the bull hasn’t stopped with stocks, bonds, and housing prices. The prices of art, coins, and what is known as collectibles have also soared. But the real crazy bull may be seen in the massive run-up in the price of cryptocurrencies led by Bitcoin (see Bitcoin watch that follows). If there is an area where the bull has not been enjoyed over the past five years it is in commodities. Commodity prices led by gold (gold is also a currency) and oil have been for the most part in bear markets. But as we have seen in the past when one bull ends somewhere, another bull gets underway.
© David Chapman

© David Chapman
© David Chapman
Many call these markets in a bubble. And that may be the case. After all, the stock market is at valuations that have only been seen at market tops like 1929 and 2000. And it is well above the valuations seen at the market top in 2007. Bond yields have been kept artificially low for years as central banks globally responded to the 2007–2009 financial crisis by not only lowering rates to zero (and even sub-zero in some cases) but also embarking on massive bond buy programs known as quantitative easing (QE). Now, central banks led by the US Federal Reserve are beginning to hike interest rates and embark on running down their balance sheet by letting the bond buybacks roll off. If the central banks do not get it right, it could spark a panic in the “so-called” bubble markets. The reality is if the central banks don’t get it right they have fewer tools today at their disposal to deal with a financial crisis than they did in 2008.
The world is awash in debt estimated at upwards of $230 trillion, a massive increase of well over $100 trillion since the financial crisis of 2007–2009. A debt debacle could appear out of nowhere especially out of China where the past several years have been financed by a massive debt binge. One positive is that banks are potentially better prepared to withstand a financial crisis today than they were in 2008 thanks to effectively being forced to raise bank capital and undergo strenuous “stress tests.” Regulation has been key. But the Trump administration wants to roll back regulation that they believe has been onerous particularly on the financial sector. As well, the Trump administration is trying to push through massive tax reform. The promise of tax reform and its positives for the stock market is another reason the stock market has enjoyed a run-up since the election in November 2016.
Still, the headline on The Economist is what one often sees at market tops. And it is not as if that kind of headline is a one-off. Positive media accounts of the amazing stock market bull have been cited in USA Today, The Wall Street Journal, Bloomberg, and even by stock market sage Warren Buffett. Rising interest rates and rollback of QE are a couple of indicators that might suggest some caution going forward.
If NAFTA were to fall apart as Trump keeps threatening that could roil markets as the negative impacts would extend beyond Canada, the USA, and Mexico. The world could not deal with an extended period of trade wars that would be not much different from the trade wars of the 1930s that contributed to the Great Depression. Trade wars would, however, be quite positive for gold, as the US Dollar would come under considerable pressure. The US Congress would, however, have the final say on NAFTA and they might not go along with President Trump.
Wars keep threatening. The Mid-East remains a mess, yet any one of the current conflicts that usually have both the USA and Russia involved on opposite sides could suddenly become something more serious. North Korea and the US have constantly traded threats and rhetoric yet an accident could trigger something that everyone would regret. The US keeps playing cat and mouse with China in the South China Sea and with Russia all along the Russian border in Eastern Europe. Again, an accident could trigger something that everyone regrets—and with nuclear weapons.
Trump has stated he will disavow the Iran nuclear deal and has threatened sanctions against Iran’s Revolutionary Guard. While all of this does get booted to Congress the Iranians have threatened retaliation including declaring the entire US military a terrorist organization. This could spark a further arms race in the Mid-East as well as heighten the tensions with Russia, China, and North Korea. The other co-signers of the Iranian nuclear deal that includes Russia, China, the United Kingdom, France plus Germany and the EU as well as being endorsed by the UN Security Council and by extension the entire UN have already expressed dismay and are openly criticising the US for threatening to go back on a signed deal. They have said that the US cannot go back on the deal and that they don’t have the power to end the deal. And will anyone trust the Trump administration again?
Finally, a crisis in the Trump administration could also unhinge the stock market. So far, Trump has managed to avoid anything major with the investigation into the “Russian connection” even as it seems to get closer and could still lead to indictments. Trump is creating chaos in a number of areas including healthcare, threats against the media, and encouragement of the clashes taking place on the street by emboldening supporters. Trump is also creating chaos within the Republicans. With an election looming in 2018 of Congress and numerous Senate seats, the election could prove highly contentious and disruptive as well as extremely polarizing. The US has been lashed with natural disasters this past year with hurricanes and wildfires causing billions in damages. We still don’t know the potential negative economic impact these events will have on GDP.
The bull market has been on quite a run. But it is getting very long in the tooth and no one is expecting or is prepared for anything more than what one might term a nominal pullback. Fundamentals seem to not matter anymore. Optimism and complacency are at extremes. The meme seems to be that this time it is different. But even we freely admit bull markets can go on longer than the shorts can stay solvent.
Bitcoin watch

© David Chapman
Is Bitcoin starting to look like the old adage of the “greater fool theory?” If your taxi driver is telling you to get into Bitcoin aka “digital gold” then one might consider maybe it’s time to get out. Sentiment on “digital currencies” is going through the roof. My inbox is inundated daily with “get rich quick” schemes that involve buying the next great Bitcoin. “A once in a lifetime opportunity where you can make 100,000% returns on your money” (a real ad I saw touting that the advertiser will take his readers to the next level of cryptocurrency wealth). The mind boggles!
Celebrities are touting cyber currencies. Paris Hilton, Floyd Mayweather, and the rapper 50 Cents are but a few that have been spotted in ads touting new ICO’s (Initial Coin Offerings). Hedge funds, banks, and money managers are looking at cyber currencies wondering if they missed the boat or is there still time to get in on the craze. Stories abound of the high school dropout who is now a multi-millionaire because he invested in cyber currencies. Giddiness is now in fashion. There are now over 1,000 different cyber-coins (some say upwards of 1,500) out there. New ICOs are popping up daily. And the entire market is only about $150 billion in size. As they say, when everyone is trying to get through the door at once it might just be pushing the prices to an ever-greater fever pitch.
And rise it did as Bitcoin has now punched through the top of what appeared to be a head and shoulders top. To give the H&S pattern credit Bitcoin did satisfy the target zone. Now the bull market is back in full force even as it appears to be hitting the top of a possible forming channel. The top of the channel appears to be around $6000. Fund managers touting the cyber currencies are saying not to worry, that this is just the beginning. You will get rich beyond your dreams. Some are even touting that Bitcoin or some cyber currency could be the next reserve currency.
Are they nuts? Reserve currency? Or else this is the most insane bubble of our lifetime. It has already surpassed the famous Tulipmania of 1637. Maybe as a more recent comparison, there was the Bre-X bubble back in the mid-90s. It sent all junior penny gold mining stocks into a frenzy that has never been repeated since. Of course, Bre-X, like tulips, was a fleeting moment even as we still plant tulips and there remain numerous junior penny gold mining stocks that trade at levels a fraction of where they were in 1996. But like then “pump-and-dump” schemes abound only this time with cyber currencies.
But a warning, to paraphrase a warning normally seen on cigarette packs “investing in cyber currencies may be hazardous to your wealth.” If it all sounds absurd, it probably is.
Governments are looking at this craze. Some are clamping down as we saw with China, South Korea, and Russia. Governments have concerns. Cyber currencies are not transparent. Cyber currencies could be used for money laundering, tax evasion, terrorism financing and just plain old vanilla fraud. Who would you sue? It’s digital. There is no transparency and it is very volatile in a thinly traded market.
Here in Canada, besides the Federal Government, others who would have concerns are the Bank of Canada (BofC) and FINTRAC (Financial Transactions and Reports Analysis Centre of Canada). The BofC is responsible for the issuance of currency, monetary policy, the financial system and is the fiscal agent for the Government of Canada. FINTRAC monitors financial transactions to facilitate the detection, prevention, and deterrence of money laundering, terrorist financing and other threats to the security of Canada. Both institutions would have a great interest in cyber currencies and want to bring them under their control, given that cyber currencies are a system operating outside the financial system. Yet despite that, we read that there is now a Bitcoin for IRAs in the US (RRSPs in Canada). This was accompanied by the usual “get in soon before it’s too late.”
Maybe Bitcoin will soar to $20,000, $50,000 as some suggest (given the break out over $5,000 now $10,000 is possible—but a return back under $5,000 could spell trouble). Maybe Blockchain, the technology behind cryptocurrencies, will really be the thing of the future. It was once said that the internet would never catch on, that it would fail, that it would never work. We all know how that one worked out.
We have been referred to a tome from the Bank of Canada titled “Competition in the Cryptocurrency Market.” Given its academic tone and length, it will take us a while to plow through it. We do see that some municipality in Switzerland is now prepared to take Bitcoin as payment for taxes. Bitcoin and the cyber currencies certainly have their fans who are trying to convince many others to join the club. But like a Ponzi scheme, the craze will only last so long unless it can be universally accepted and accepted by central banks and probably under their control. But given all the hype out there it is almost as if this is a sure thing. A reminder, there is no such thing as a sure thing.
Markets and Trends
|
|
Percentage Gains Trends
|
|||||||
| Stock Market Indices | Close
Dec 31/16 |
Close
Oct 13/17 |
Week | YTD | Daily (Short Term) | Weekly (Intermediate) | Monthly (Long Term) | |
| S&P 500 | 2,238.83 | 2,553.17 (new highs) | 0.2 | 14.0 | up | up | up (topping) | |
| Dow Jones Industrials | 19,762.60 | 22,871.72 (new highs) | 0.4 | 15.7
|
up | up | up (topping) | |
| Dow Jones Transports | 9,043.90 | 9,936.22 (new highs) | 0.5 | 9.9 | up | up | up (topping) | |
| NASDAQ | 5,383.12 | 6,605.80 (new highs) | 0.2 | 22.7 | up | up | up (topping) | |
| S&P/TSX Composite | 15,287.59 | 15,807.17 | 0.5 | 3.4 | up | up | up | |
| S&P/TSX Venture (CDNX) | 762.37 | 797.44 | 1.2 | 4.6 | up | neutral | up (weak) | |
| Russell 2000 | 1,357.14 | 1,502.66 | (0.5) | 10.7 | up | up | up (topping) | |
| MSCI World Index | 1,690.93 | 1,969.14 | (0.1) | 16.5 | up | up | up | |
| Gold Mining Stock Indices | ||||||||
| Gold Bugs Index (HUI) | 182.31 | 202.77 | 0.3 | 11.2 | neutral | up (weak) | up (weak) | |
| TSX Gold Index (TGD) | 194.35 | 202.76 | 0.5 | 4.3 | up (weak) | down (weak) | up (weak) | |
| Fixed Income Yields | ||||||||
| U.S. 10-Year Treasury yield | 2.45 | 2.37
|
1.7 | (3.3) | ||||
| Cdn. 10-Year Bond yield | 1.72 | 2.08 | (1.0) | 20.9 | ||||
| Currencies | ||||||||
| US$ Index | 102.28 | 93.64 | 0.8 | (8.5) | up | down | down (weak) | |
| Canadian $ | 0.7440 | 0.8020 | 0.5 | 7.8 | down (weak) | up | neutral | |
| Euro | 105.22 | 118.25 | 0.8 | 12.4 | neutral | up | up | |
| British Pound | 123.21 | 132.93 | 1.7 | 7.9 | up (weak) | up | down | |
| Japanese Yen | 85.57 | 89.37 | 0.7
|
4.4 | down (weak) | neutral | neutral | |
| Precious Metals | ||||||||
| Gold | 1,151.70 | 1,304.60 | 2.3 | 13.3 | neutral | up | up | |
| Silver | 15.99 | 17.41 | 3.7 | 8.9 | neutral | neutral | neutral | |
| Platinum | 905.70 | 947.90 | 3.4 | 4.7
|
down (weak) | down (weak) | down | |
| Base Metals | ||||||||
| Palladium | 683.25 | 985.50 | 7.2
|
44.2 | up | up | up | |
| Copper | 2.5055 | 3.13 | 3.3 | 24.9 | up | up | up | |
| Energy | ||||||||
| WTI Oil | 53.72 | 51.45 | 4.4 | (4.2) | up | up (weak) | neutral | |
| Natural Gas | 3.72 | 3.00 | 4.9 | (19.4) | up (weak) | neutral | neutral | |
© David Chapman
Note: For an explanation of the trends, see the glossary at the end of this article.
New highs/lows refer to new 52-week highs/lows.
© David Chapman
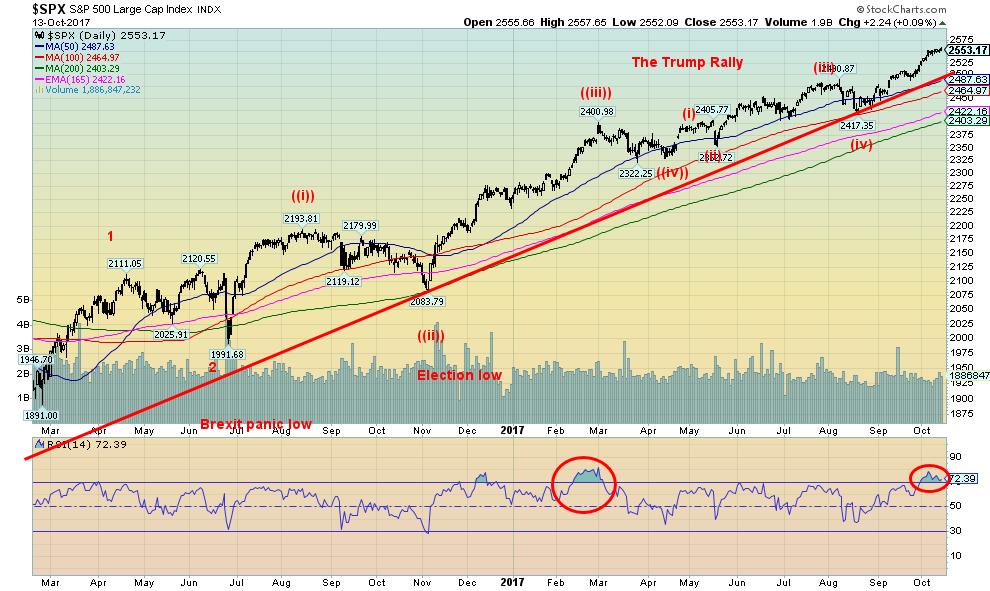
Once again here is the Trump rally that got underway following the election low in November 2016. Much of it, as we have noted, has been driven by expectations that the Trump agenda, particularly tax reform, will be realized. The wave count we are showing does differ from what we have seen for Elliott Wave International (EWI).
EWI has the count that shows us currently in the 5th wave up from the February 2016 low. We wonder whether we still might be in the 3rd wave up but in the 5th wave of the 3rd wave of a higher degree. Either way, it does suggest that a correction is coming. EWI’s count suggests it could be a severe correction and that this wave is the final one and the final top. Our count suggests it could be a swift correction but not take out any major support zones and then be followed by one more run to the upside that would top sometime in the 1st quarter of 2018.
So how would we know which one it is? Key areas are previous lows. A break under 2,417 would take out the last daily low. That would certainly qualify as a correction within the context of the uptrend from the February 2016 low. As long as the April low of 2,322 holds the correction could qualify as wave 4 correction to be followed by one more wave to the upside. If that breaks then the final arbiter of the bull market that got underway in March 2009 would be the February 2016 low of 1,810. If that falls we would have our confirmation of a final top and we would begin to enter a bear market of some significance. First and foremost then is that any pullback now holds the April low of 2,322.
With the daily RSI at 72, it does suggest that the market is currently overextended sufficiently to support a forthcoming correction. Significant support would be seen at 2,490 so a break under that level would confirm that a correction is underway. None of this eliminates the possibility of higher prices. We could actually be in a final blow-off and any pullback now would be shallow before the market moves once again to new highs.
© David Chapman
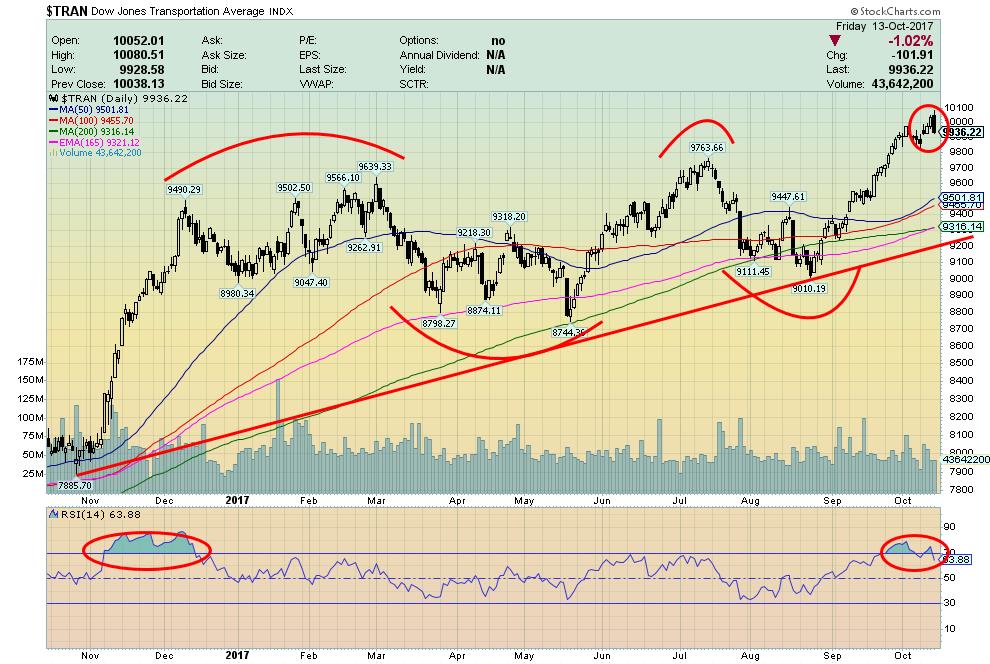
Note the outside day reversal seen on the Dow Jones Transportations (DJT) this past week. The outside day reversal could qualify as a key reversal given the DJT made new all-time highs on Friday (the 13th) then reversed and closed lower for the outside day. Key, of course, is follow-through to the downside this coming week. Note the daily RSI had reached over 70, an area that indicates the market is becoming stretched but does not necessarily signal an impending top. The DJT has considerable support all the way down to 9,200 so that is an area to watch on any pullback. Ideally, at a major top as well we would like to see a divergence between the DJT and the DJI. Since both made new all-time highs this past week, no divergence is present as the averages have confirmed each other.
© David Chapman
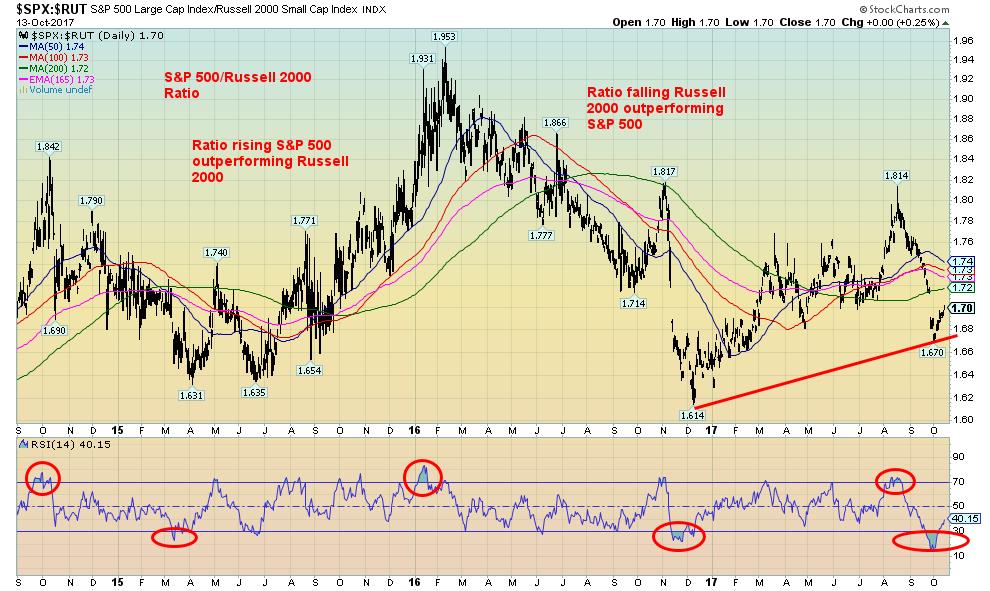
While the DJI, the DJT, the NASDAQ, and the S&P 500 were making new all-time highs this past week the small-cap Russell 2000 did not. That may be another clue that a top is in the works. The S&P 500/RUT ratio started to rise this past week in favor of the S&P 500. In bull markets, the RUT usually outperforms the S&P 500 but in a bear market, the S&P 500 outperforms the RUT. As the markets screamed to new all-time highs it was probably not a surprise that the RUT outperformed. But this past week it did not as the RUT faltered. Still, the ratio has ways to go to determine a new trend. We need to break back over 1.74.
© David Chapman
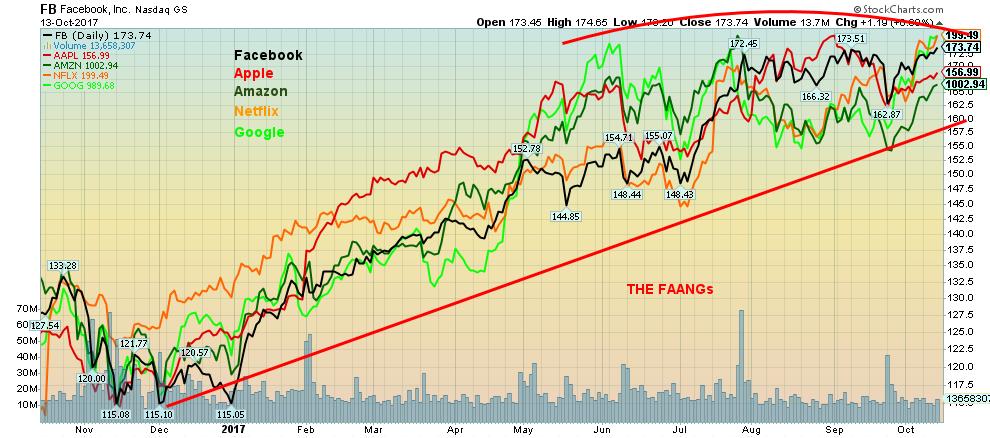
With all the excitement of the DJI, the DJT, the S&P 500, and the NASDAQ making new all-time highs we expected the leaders known as the FAANGs (Facebook, Apple, Amazon, Netflix, and Google) to mostly be making new all-time highs as well. Not so. For this past week, only Netflix (NFLX) and Google (GOOG) saw new all-time highs and just barely. Facebook (FB) made its high at $175.49 back on July 26 and today is at $173.74. Apple’s (AAPL) all-time high was seen on September 1 at $164.94. Today AAPL is at $156.99. Amazon’s (AMZN) all-time high was made on July 27 and $1,083.31 but Friday it closed at $1,002.94. The FAANGs have been the leaders. If the market is to continue higher, it is essential the FAANGs continue their leadership role.

© David Chapman
The bull market that got underway in March 2009 has completed four waves to the upside. The two major corrections were the EU/Greek crisis of 2011 and the end of QE in the latter part of 2015. We know we are on the 5th and final wave to the upside before a more significant correction kicks in. We can’t help but notice the weekly RSI has been poking its head above 70 on a few occasions over the past several weeks. It is a sign of overextension in the market but it does not signify that a top is about to be seen. If we are truly in a blow-off mode, we could see this repeated a number of times going forward. What’s key, as always, is taking out a previous important low. Since the long bull market got underway the 4-year MA has held. The last test of the 4-year MA was seen in February 2016. The 4-year MA is currently at 2,092. If the bull market is to remain intact then that level must hold. That level is not far from the February 2016 low of 1,810. We know if that level ever breaks we are confirming entrance into a long-term bear market.
© David Chapman
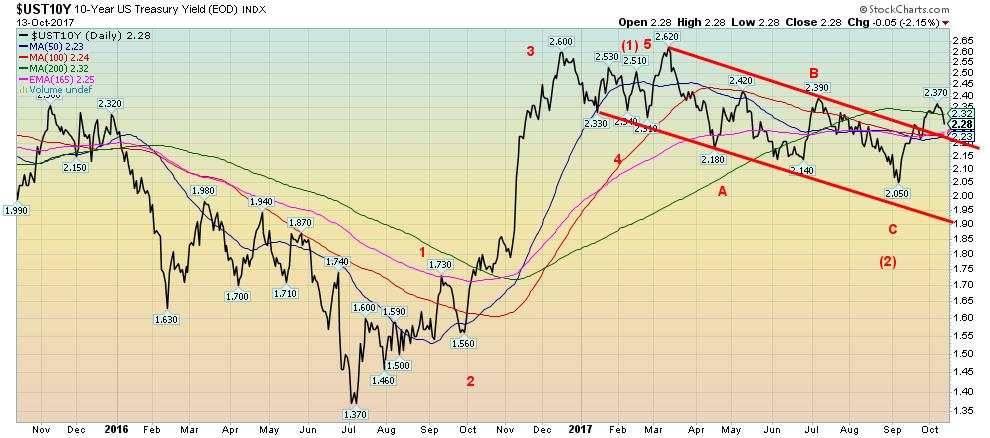
With the core CPI holding steady at 1.7% this past week it helped bring down bond yields. The September CPI came in lower than expected and that was a factor on Friday pushing stocks higher, bond prices higher (yields fell as yields move inversely to prices) and the US$ lower. Gold rose as a result of the lower US$. This set in motion talk that the Fed may not hike interest rates in December as many had been expecting. We shall see. The 10-year US Treasury note yield had broken out above its 200-day MA, hitting a high of 2.37% before backing off this past week to close at 2.28% and back below the key 200-day MA. If we are to rise to 3% as we have been expecting then it is important on this pullback that the 2.20% to 2.25% zone hold. It may be the recent high at 2.37% completed the 1st wave up from the 2.05% low seen in September.
© David Chapman
Spread watch
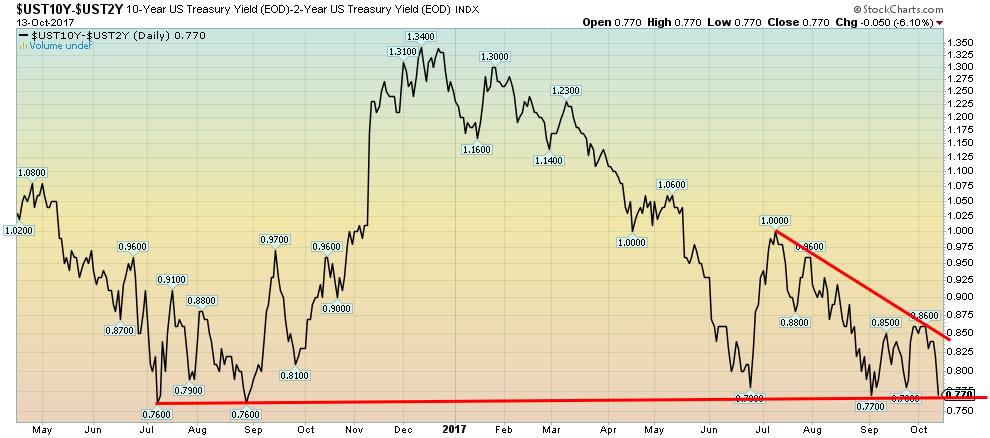
With the drop in yields for the 10-year US Treasury note, the 2-10 year spread narrowed to 0.77% from 0.81% the previous week. Once again, we appear poised to break down under the major 0.77% support zone. Still at these levels, we believe we are long way off from indicating that a recession could be imminent. Prior to the 2000-2002 recession and the 2007-2009 recession the 2-10 year spread went negative. We are a long way from a negative yield. But the spread bears watching on a weekly basis.
© David Chapman
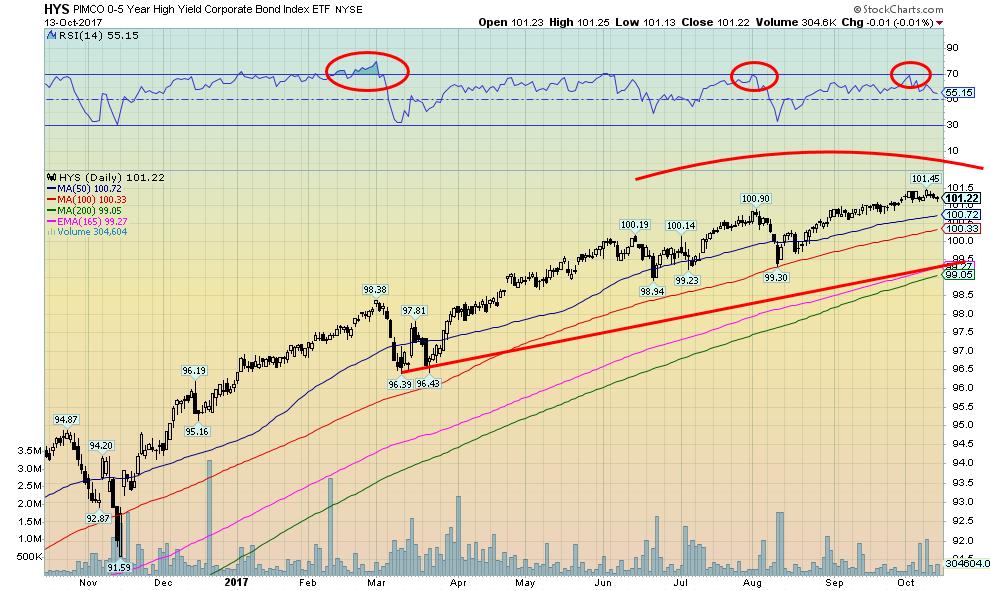
The Pimco 0-5 year high yield corporate bond index ETF (HYS) is bond ETF for junk bonds. Junk bonds are rated below BB for S&P and Ba for Moody’s. The HYS appears to be slowly rolling over but it is a long way from breaking down. The key level is seen at 99. A breakdown under that level suggests a bear market may be getting underway. Junk bonds have been popular given the higher yields associated with a world looking for yield. But if the credit markets were to falter, junk bonds would not be a place to be as the price decline could be rapid. During the pullback seen in the latter part of 2015, the HSY fell 13%. Not a huge drop, but an indication that when credit becomes a concern it can drop quickly.

© David Chapman
After rising sharply from its 90.99 low in September the US$ Index hit a wall just under its 100-day MA with a high of 94.10. Since then the US$ Index has slipped back under 93. However, it may be finding support at the 50-day MA near 92.80. Friday’s low hit 92.59, but the US$ Index rebounded, closing at 92.93. Friday’s economic reports were naturally befuddling with a whipsaw effect on the US$ Index. A low core inflation number was countered by strong retail sales as a result of buying in the aftermath of the hurricanes. As to the retail sales, car-sales surged to replace vehicles lost during the hurricanes. But even without the surge in car-sales the retail sales number was strong. The weaker than expected core inflation number had market analysts questioning whether the Fed might hike in December. With the US$ Index weak this past week, it is no surprise that other currencies strengthened. The Euro gained 0.8%, the Japanese Yen was up 0.7%, the Cdn$ jumped 0.5% while the Pound Sterling was the strongest—up 1.7% as it continues to be battered back and forth by the Brexit. Gold benefitted from the weak US$ gaining 2.3%.
Is this current US$ decline over? A break below 92.70 would suggest there is more downside. A short-term rebound rally is possible off the 50-day MA that could take the US$ Index to 93.30/93.40. But a firm break above 93.80 would suggest the US$ Index advance is back and a move to 95 and even towards 96 is quite possible. There is considerable resistance up in the 95.40 to 95.60 zone. No matter how we look at it, we believe there is some further upside for the US$ Index before this current upward correction is over. After that, and most likely before year-end the US$ Index should be starting another decline.

© David Chapman
Gold and the precious metals enjoyed a solid up week with gold jumping 2.3%, silver was finally a leader gaining 3.7%, platinum—still exceptionally cheap—gained 3.4%, but the big winner was the metals with palladium jumping 7.2% to just short of new highs and copper gaining 3.3%. On a positive note, we like the fact that gold appeared to gap higher on October 10, 2017. A gap appears on the charts between $1,287 and $1,279. It is always tempting to try to fill gaps.
But possibly the most significant recent event concerning gold this past week is China’s attempts to effectively strong-arm Saudi Arabia into accepting payment for its oil that China imports in Yuan rather than US$. China hates having to pay in US$ and they have been making numerous moves over the past few years to effectively set up a Yuan trading zone in Asia. This may be their boldest move yet. China is now the world’s biggest importer of oil, surpassing the US. And now it would like to pay for its oil in Yuan rather than US$. Well, “like” may not be the word—how about “force.” If China is successful then we are not far from a dual world where countries will either be paying for their oil in US$ or in Yuan. This is a direct challenge to the US$ as the world’s reserve currency and as the Petro Dollar.
It wasn’t that long ago that China created an oil futures contract priced in Yuan. Yuan can also then be exchanged for gold in both Shanghai and Hong Kong. China, like Russia, has been increasing its gold reserves. The purpose by both Russia and China is to strengthen their currencies to compete with the US$. The US continues to hold the largest gold reserves in the world at 8,133 metric tonnes. According to Q2 data, Russia’s gold reserves are now up to 1,715.8 metric tonnes. China’s gold reserves are estimated at 1,842.6 metric tonnes but many suspect they are actually higher. China has consistently been on record saying they want the same level of gold reserves as the US. At another level, China is estimated to have over 20,000 metric tonnes of reserves but we are counting here gold in the ground and not mined as opposed to what is held by the People’s Bank of China (PBOC). Other Chinese wealth funds are suspected of holding considerable gold reserves as well. The chart below only goes to May 2016, but one can see the growth that is occurring in Chinese and Russian holdings.

© David Chapman
If China is successful in having oil paid in Yuan, then that would be a direct economic challenge to the US. These are the kind of events that could lead to global war. A collapse in the US$ would not be in the economic interests of the US. Recall that both Iraq and Libya tried to move away from the US$ for oil payments. Both countries were eventually invaded and they reverted to receiving payment for their oil in US$. Iran has threatened to do the same and more recently Venezuela has made moves away from accepting the US$ for payment for its oil. The US has threatened both Iran and Venezuela with military action.
But payment in Yuan and a gold-backed Yuan would also be quite bullish for gold as well as being a threat to US$ global hegemony and the US$’s role as the world’s reserve currency.
Gold has resistance up to $1,320. A firm breakout over $1,320 would be positive and suggest that a low may be in place. Gold has considerable support now down to $1,270, but a breakdown under that level would suggest that new lows were possible. We are not sure the gold correction is over and there are interests who may wish to help push gold lower again to buy in at lower prices.
© David Chapman
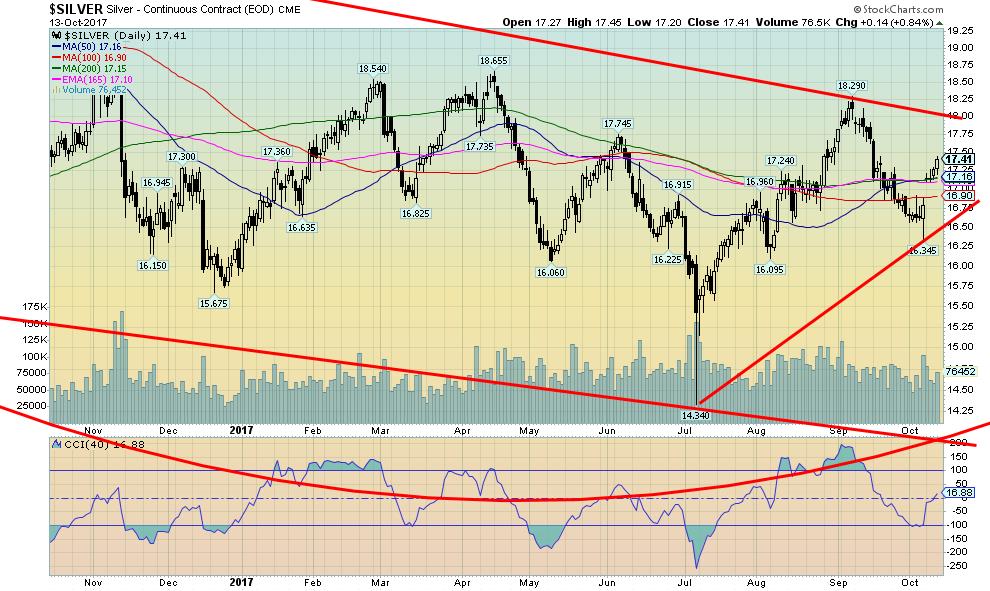
Silver also gapped higher this past week and, as noted for a change, silver led the rally with its gain of 3.7%. Silver managed to close the week over its key 200-day MA and the 165-day EMA. Gold now has strong support down to $16.90/$17. A break under $16.90 would suggest that lower prices are possible. A firm breakout above $17.80 might suggest that silver’s low is in and that silver would then move to challenge the September high of $18.29. Gold and silver sentiment did not get sufficiently low enough at the recent lows to suggest that an important low might be in. That is another reason why we believe there could be one more plunge to the downside before this correction is over. A break above $17.80 would, however, start to change our minds.
© David Chapman
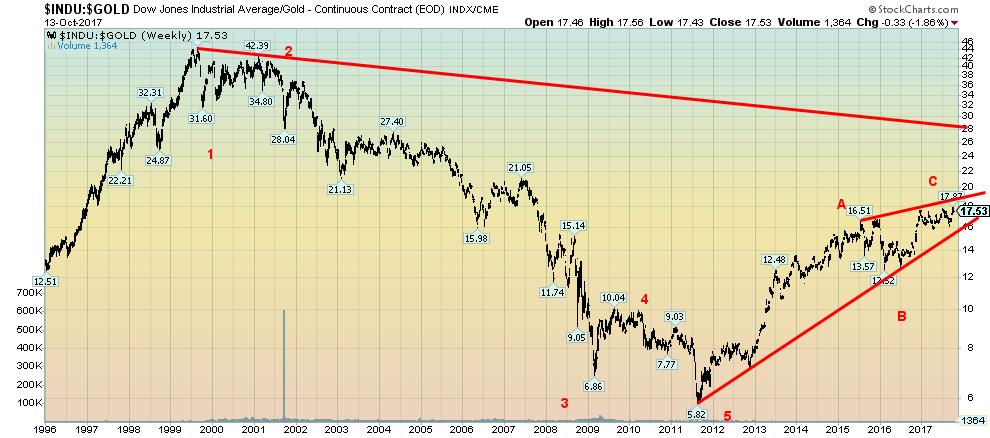
We haven’t looked at the Dow/Gold ratio of late. The Dow/Gold ratio appeared to complete a five-wave decline from the top in 1999 to the key low at 5.82 in 2011. Since then, the Dow/Gold ratio has been rising, favoring owning the DJI over gold. The past two years, however, appear to be setting up a classic ascending wedge pattern. These patterns are ultimately bullish. But first, it needs to break the bottom of the channel currently near 16. Following that a swift decline to at least 12 could get underway. We are currently near the top of the channel. If that is correct then selling the DJI and buying gold may be a positive strategy.
© David Chapman
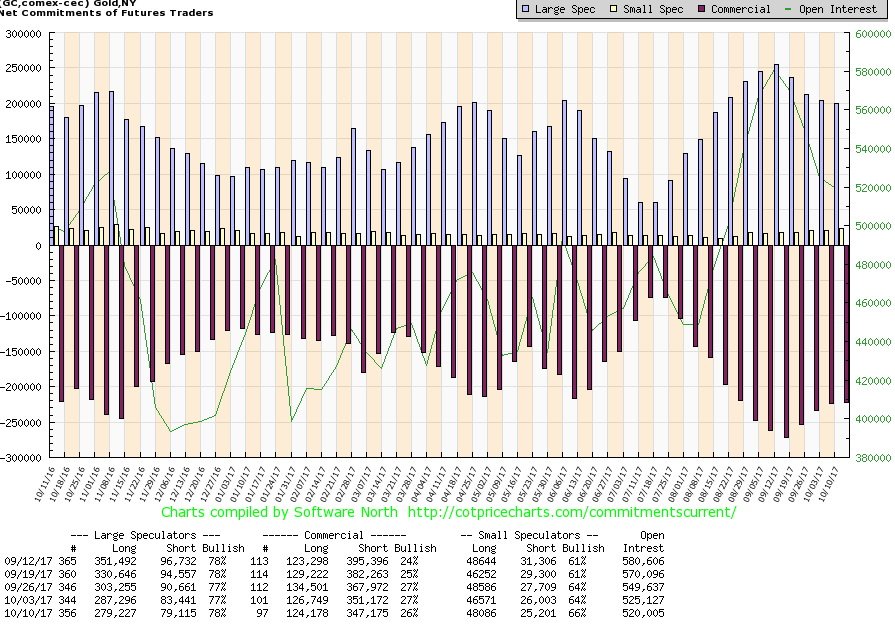
The commercial COT for gold slipped to 26% from 27% this past week. Short open interest fell about 4,000 contracts but long open interest also fell losing roughly 2,500 contracts. The large speculators’ COT rose to 78% from 77% despite a decline in long open interest by roughly 8,000 contracts. Short open interest was also down by about 4,000 contracts. Overall open interest fell just over 5,000 contracts. A decline in open interest as the gold price rises suggests to us the recent rise is corrective in nature and not the start of a new bull run. If it were, then open interest should be rising, not falling. The slight decline in the commercial COT is at best neutral but certainly no more than mildly bearish. It suggests to us once again that the recent correction may not yet be done. For the record, the commercial COT for silver slipped as well to 28% from 29% while the large speculators’ COT for silver was unchanged at 74%. Open interest for silver actually rose by roughly 5,000 contracts. That’s positive for silver going forward.

© David Chapman
Gold stocks, you are frustrating. In a bull market, we would like to see gold stocks leading along with silver. While silver was stronger than gold this past week the gold stocks were at best tepid and were definitely laggards. The Gold Bugs Index (HUI) was up only 0.3% while the TSX Gold Index (TGD) gained 0.5%—pitiful, considering the rise this past week for both gold and silver. Normally we would have easily seen 5% plus gains for the gold indices. Gold stocks remain extremely cheap historically compared to the price of gold. Is this the new paradigm where the metals (gold and silver) are preferred over holding the gold stocks? We don’t think so as rising gold and silver prices should help the leveraged gold stocks where rising prices go directly to their bottom line even as their costs remain relatively static. Rising gold prices also encourage more exploration and the reality is the world is running out of gold reserves in the ground. Some are even suggesting it could become “peak gold.” The past several months appears as a possible accumulation pattern. The TGD needs to break out over 210 to suggest higher prices. The TGD remains well away from its February 2017 high of 232 and not even close to its 2011 high of 455. The 200 zone should provide support on any pullback with stronger support down to 195.
GLOSSARY
Trends
Daily – Short-term trend (For swing traders)
Weekly – Intermediate-term trend (For long-term trend followers)
Monthly – Long-term secular trend (For long-term trend followers)
Up – The trend is up.
Down – The trend is down
Neutral – Indicators are mostly neutral. A trend change might be in the offing.
Weak – The trend is still up or down but it is weakening. It is also a sign that the trend might change.
Topping – Indicators are suggesting that while the trend remains up there are considerable signs that suggest that the market is topping.
Bottoming – Indicators are suggesting that while the trend is down there are considerable signs that suggest that the market is bottoming.
(All charts are courtesy of Federal Reserve Bank of St. Louis, Trading Economics, Coin Desk, Stock Charts and Gold Charts R Us.)
__
DISCLAIMER: David Chapman is not a registered advisory service and is not an exempt market dealer (EMD). We do not and cannot give individualized market advice. The information in this newsletter is intended only for informational and educational purposes. It should not be considered a solicitation of an offer or sale of any security. The reader assumes all risk when trading in securities and David Chapman advises consulting a licensed professional financial advisor before proceeding with any trade or idea presented in this newsletter. We share our ideas and opinions for informational and educational purposes only and expect the reader to perform due diligence before considering a position in any security. That includes consulting with your own licensed professional financial advisor.
(Featured image by Alankitassigments via Wikimedia Commons. CC BY-SA 4.0)


Bitcoin and Ethereum Slide as Market Pressure Builds Amid Strategy Concerns and Layer 2 Disruptions
Bitcoin fell below $60,000 with heavy ETF outflows, pressured by concerns over Strategy’s finances and its STRC stock decline. Ethereum...


AI Venture Builder Launches €600K Crowdfunding Round to Scale Secure AI Solutions
AI Venture Builder, an Italian-British firm developing AI applications and vertical startups, returns to CrowdFundMe with a equity campaign. After...


Gilead HSV Plan Could Transform Market Outlook
Gilead’s upcoming development plan for Assembly Biosciences’ HSV drugs could reshape the herpes market. ABI-5366 and ABI-1179 have shown strong...


Talentir Secures €4M to Transform Global Payouts
Talentir, an Austrian-Swiss fintech, raised €4 million led by Redstone to scale its AI-powered payout platform. Using stablecoin infrastructure, it...


Coastal Cities Lead as Heat Strains Italy’s Urban Livability
Italy’s 2026 Climate Livability Index shows coastal cities, led by Ancona, outperform inland areas as global warming intensifies. Adriatic locations...
 |
|
 |  |
 |
|
-

 Fintech1 week ago
Fintech and AI: Adoption Grows, but Profits Favor Agile Innovators
-

 Impact Investing4 days ago
Edison Accelerates Renewable Growth and ESG Impact in 2025
-

 Business2 weeks ago
SpaceX IPO Sparks Déjà Vu as Market Risks Loom and Gold Bulls Stay Hopeful
-

 Cannabis2 days ago
Spain Cannabis Laws: Private Use, Fines, and Grey Areas
You must be logged in to post a comment Login