Featured
Why Gold Continues to Struggle
Market just continues on higher with more new all-time highs. Risk stocks continue to rise. Even the DJI eked out a new high but is diverging with the DJT that remains well off its former highs. Expect more chop, chop market. We see no crash coming but could still see a pullback into August/September. Support points are noted. Gold continues to struggle but so far is holding its support zones.

It has been a weird choppy week as the S&P 500 quickly lost about 4% than in the next heartbeat gained it back and closed out the week making new all-time highs once again. All this despite diverging and deteriorating breadth, the McClellan Summation Index (ratio adjusted) aka RASI falling under 500, a diverging VIX, falling bullish percent index, falling number of stocks trading over their 200-day MA, and quickly rising call option buying once again. As we have often noted while the divergences are important and are a warning sign, they are not a guarantee that a top is in and the market can go higher in the face of many indicators deteriorating. However, eventually, it catches up to them.
S&P 500 and Stock Markets
When the economy was an agricultural one, August tended to be the best of the month of the year for stocks 1901-1951. Now that agriculture is merely an afterthought in the economy August is now the second-worst month of the year behind September. The Russian crisis of 1998 got underway in August and almost brought down the financial system. Saddam Hussein triggered a 10% decline in August 1990 when he invaded Kuwait. Last year saw a top in late August and a bottom in October as the S&P 500 fell 10.5%. And last year the divergences with the indicators were not as pronounced as they are today.
As to the economy, well it was a surprise to some that initial weekly claims jumped to 419,000 from 368,000 the prior week and a consensus forecast of 350,000. More people were looking for work and more applied for unemployment following the end of other benefits in a number of states. Housing starts in June were better than expected but then building permits were disappointed and were below consensus. Bond yields have backed up a bit as the U.S. 10-year is back up to about 1.30% from 1.20% the previous week. The 10-year regaining back above 1.40% might signal we have made a low. Above 1.60% new high yields are very probable.
Spreads on corporate debt are as low as we’ve ever seen and that makes it cheap for corporations to borrow. Result companies are borrowing more than ever often just for stock buybacks. Stock buybacks in turn help push up the stock market. The other result is that the rating agencies are lowering credit ratings when the world is swimming in BBB credit (lowest investment-grade bonds) and lower into the C’s and junk bonds. Borrowing just to do financial engineering is not a wise use of funds and it sets the market up for a big hiccup once the credit cycle runs its course. Homeowners too who are leveraging up just buy a house. Eventually, the “party” ends. Just like 2008. Only the leveraging today makes what was seen prior to the 2008 collapse look like a fairy tale.
The Delta variant of COVID-19 has been leaping so maybe it’s no surprise that once again the U.S. is leading the way in cases. This after falling to nearly 10,000/daily it has quickly ramped back up to over 55,000/daily mostly amongst the unvaccinated (99%) in what one calls red states. How that plays out going forward with threats once again of lockdowns and its subsequent impact on the economy is difficult to say. Floods in China in a major manufacturing hub of Zhengzhou is going to play more havoc with supply chains on top of the current problems with supply chains. Rising cases of the Delta variant are already causing problems and shortages in the U.K. and into the EU even though economic numbers have been decent in the EU of late.
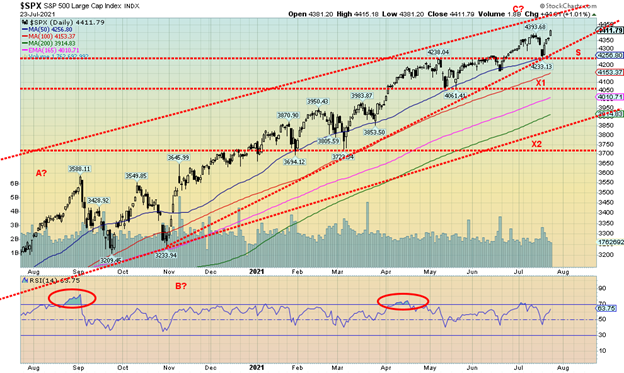
Our expectations into August are that the market can continue higher despite all the warning signs. But this past week’s hiccup has now set-up the 4,250 zone as support and a break of that level could swiftly lead to a fall to the next support zone near 4,050 with some interim support at 4,150. Under 4,050 things get dicier as the next stop could be down to 3,900. Below that the final good support zone is around 3,700 at which time the S&P 500 would be down roughly 15%. A sharp break under that level could set up a panic.
It’s increasingly difficult to buy this market up here, at least not until we get through the August/October period of seasonal weakness. No, it doesn’t mean the seasonal weakness is guaranteed but given the growing negative divergences, it is not wise to push them. Failure of the indices to confirm each other is another negative divergence. The Dow Jones Industrials (DJI) barely eked out a new all-time at the end of the week. However, the Dow Jones Transportations (DJT) is still down about 10% from its all-time high. We have noted that while the S&P 500 was making new highs the S&P 500 Equal Weight Index is still not making new all-time highs. That suggests to us a narrowing of the leaders taking the indices higher. Again, all these divergences are warning signs they are not a guarantee of a top.
As to the NASDAQ well, it did make new all-time highs once again. So, it was no surprise that some of the FAANGs did as well – Facebook, Google, and Microsoft joined the party. In looking at Microsoft it clearly has gone parabolic. Nvidia and Twitter were both up almost 8% on the week. It’s risk on.
As to how high could the market go, well potential targets for the S&P 500 could be up to 4,500/4,550. One could translate the concern about the markets to the TSX Composite as well even as the TSX did not make new all-time highs this week. We have noted that the market appears to becoming more defensive with a shift out of consumer discretionary stocks to consumer staples. While the shift hasn’t happened yet we note that the TSX Financials Index/TSX Gold Index (TFS/TGD) Ratio appears to be forming a potential top pattern. If correct that could imply that going forward golds will outperform financials.
July 31 is the deadline for dealing with the debt limit. With the Republicans prepared to block all attempts to fix the debt limit, the Treasury will be forced into emergency measures in order to ensure the bills are paid. It is estimated that these measures could take the U.S. into the October/November period before it gets serious and the risk of the U.S. defaulting becomes a potential reality. If that happened all sorts of mayhem could erupt on global financial markets.
If the trend is your friend, then the uptrend is where you have to be. But given all the growing negative divergences some caution is advised and awareness of break points becomes important.
This coming week the FOMC meets and the expectation is that there will be no change in either interest rates or QE. However, listen carefully to what the Fed has to say for clues about inflation and tapering. The expectation is that the Fed remains dovish on inflation and tapering for the time being. And they will continue QE given that they believe the economy is not as strong as some think it is and there is concern about the rising Delta variant. This week’s claims number was not good and economic numbers remain below peak levels of February 2020.
Gold, Metals and Commodities
Gold can’t get out of the way of itself. Or maybe it just can’t get out of the way of a rising US$ Index. For the second week in a row the US$ Index is up and now threatening to break out over 93. That suggests to us that we could see the US$ Index make new highs above the March 2021 high of 93.47. In looking at the pattern, however, we still view it as a large ABC flat up from the significant low seen in early January at 89.17. The A wave topped in March at 93.47 while the B wave bottomed in May at 89.52. Many see it as a double bottom. We see it as a large ABC corrective formation as none of the waves are impulsive (5 waves). The high for the US$ Index so far is 93.20. With the US$ Index closing barely up on the week under 93 it is possible that the US$ Index could fail here as well. It needs a weekly close over 93 to suggest new highs.
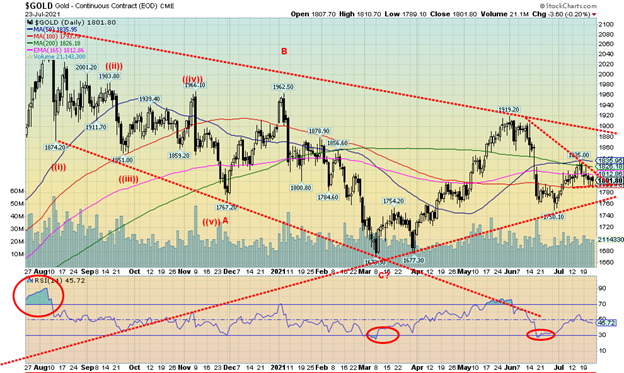
Result, gold is down for the second week in a row and silver is down for the third week in a row. All-in-all it is frustrating the gold bugs. That’s the bad news. The good news, at least for the moment, is that gold is holding above $1,790 and silver generally is holding above $25. Silver tested under $25 but nothing happened and it rebounded. We’ve always viewed that when something breaks under an important support zone and nothing happens that it is positive. But it can only do that so often then the support gives way. It’s like taking a battering ram to the door. Eventually the door breaks.
If gold breaks down under $1,790 then next up will be a test of the $1,750 low seen in June. A break of that level would be more dangerous as we would then go down to test the March low of $1,673. Silver support is $25 but under that level there is the March low near $23.75 and then down to $22 major support. Gold still needs to take out $1,820/$1,830 but above $1,850 we could see a test of $1,900. Silver needs to first regain $26 and $27 to suggest a move to $28. For the gold stocks the TSX Gold Index (TGD) has support at current levels but under 285 a return to the February low of 267 and probably lower would get underway. The TGD needs to regain above 315 and 325 to suggest higher levels.
Gold and silver are off their lows but risks remain to the downside until we start clearing levels above. Seasonally we have seen lows in August before a strong rally gets underway. But key remains the US$ Index that still looks higher in the short-term. The potential 31-month cycle low was made in March but the window for that low ranged from November 2020 to September 2021. We are still in that window but nearing its end. Lows in July or August have been seen before so we would not be surprised to see the start of a significant rally that could carry into October or later get underway. However, all of this is contingent on clearing the resistance zones. And of course, not breakdown in the interim. Until we clear the resistance hurdles the risk at the moment remains to the downside.
As to other commodities, oil has rebounded from last week’s sell-off. However, we continue to view the recent high as a potential top and this is the rebound. Note that the energy stocks remain weak as the ARCA Oil & Gas Index (XOI) fell on the week while the TSX Energy Index (TEN) was flat. We’d be surprised if new highs were seen for oil. However, natural gas (NG) did make new highs this past week. This period tends to be soft seasonally for both oil and gas.
Bitcoin Gold Ratio
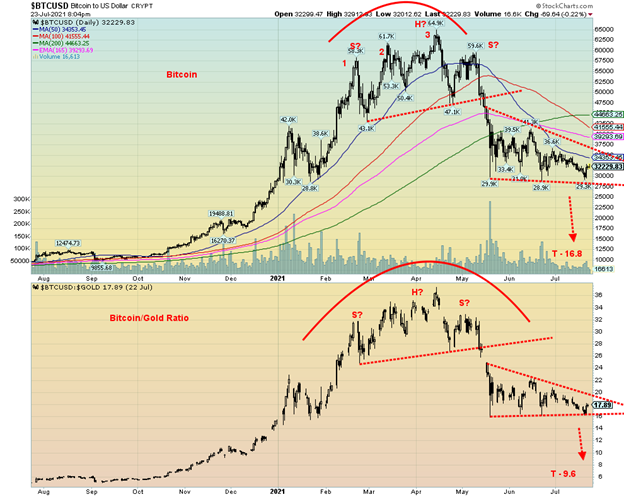
Both Bitcoin and the Bitcoin/Gold ratio appear to have formed a somewhat complex head and shoulders top. Following the first plunge, both Bitcoin and the Bitcoin/Gold ratio both formed what appears to be a descending triangle which is bearish. Bitcoin breaks down under 27,500 and projects down to 16,800 while the Bitcoin/Gold ratio breaks down under 16.45 and targets down to 9.6. Both are bullish for gold in relation to Bitcoin. It may well be that it is bullish for gold overall as well.
MARKETS AND TRENDS
| % Gains (Losses) Trends | ||||||||
| Close Dec 31/20 | Close Jul 23/21 | Week | YTD | Daily (Short Term) | Weekly (Intermediate) | Monthly (Long Term) | ||
| Stock Market Indices | ||||||||
| S&P 500 | 3,756.07 | 4,411.79 (new highs) | 2.0% | 17.5% | up | up | up | |
| Dow Jones Industrials | 30,606.48 | 35,061.55 (new highs) | 1.1% | 14.6% | up | up | up | |
| Dow Jones Transports | 12,506.93 | 14,756.07 | 2.8% | 18.0% | down | up (weak) | up | |
| NASDAQ | 12,888.28 | 14,836.99 (new highs) | 2.8% | 15.1% | up | up | up | |
| S&P/TSX Composite | 17,433.36 | 20,188.43 | 1.0% | 15.8% | up | up | up | |
| S&P/TSX Venture (CDNX) | 875.36 | 902.56 | (0.6)% | 3.1% | down | neutral | up | |
| S&P 600 | 1,118.93 | 1,318.56 | 1.6% | 17.8% | down | up (weak) | up | |
| MSCI World Index | 2,140.71 | 2,299.39 | (0.6)% | 7.4% | down | up | up | |
| NYSE Bitcoin Index | 28,775.36 | 32,490.39 | 1.9% | 12.9% | down | down (weak) | up | |
| Gold Mining Stock Indices | ||||||||
| Gold Bugs Index (HUI) | 299.64 | 258.93 | (2.3)% | (13.6)% | down | down | up | |
| TSX Gold Index (TGD) | 315.29 | 293.28 | (2.3)% | (7.0)% | down | down | up | |
| Fixed Income Yields/Spreads | ||||||||
| U.S. 10-Year Treasury Bond yield | 0.91 | 1.28% | (0.8)% | 40.7% | ||||
| Cdn. 10-Year Bond CGB yield | 0.68 | 1.23% | (1.6)% | 80.9% | ||||
| Recession Watch Spreads | ||||||||
| U.S. 2-year 10-year Treasury spread | 0.79 | 1.08% | 1.9% | 36.7% | ||||
| Cdn 2-year 10-year CGB spread | 0.48 | 0.76% | (6.2)% | 58.3% | ||||
| Currencies | ||||||||
| US$ Index | 89.89 | 92.93 | 0.3% | 3.4% | up | up | down | |
| Canadian $ | 0.7830 | 0.7950 | 0.3% | 1.5% | down | neutral | up | |
| Euro | 122.39 | 117.76 | (0.3)% | (3.8)% | down | down | up | |
| Swiss Franc | 113.14 | 108.76 | flat | (3.9)% | down | down | up | |
| British Pound | 136.72 | 137.51 | (0.1)% | 0.6% | down | up (weak) | up | |
| Japanese Yen | 96.87 | 90.46 | (0.5)% | (6.6)% | down | down | down | |
| Precious Metals | ||||||||
| Gold | 1,895.10 | 1,801.80 | (0.7)% | (4.9)% | down (weak) | neutral | up | |
| Silver | 26.41 | 25.23 | (2.2)% | (4.5)% | down | down (weak) | up | |
| Platinum | 1,079.20 | 1,061.40 | (4.3) | (1.7)% | down | down (weak) | up | |
| Base Metals | ||||||||
| Palladium | 2,453.80 | 2,662.40 | 1.0% | 8.5% | down (weak) | up | up | |
| Copper | 3.52 | 4.40 | 1.9% | 25.0% | neutral | up | up | |
| Energy | ||||||||
| WTI Oil | 48.52 | 72.07 | 0.7% | 48.5% | neutral | up | up | |
| Natural Gas | 2.54 | 4.03 (new highs) | 10.1% | 58.7% | up | up | up |
New highs/lows refer to new 52-week highs/lows and in some cases all-time highs.
—
(Featured image by PublicDomainPictures via Pixabay)
DISCLAIMER: This article was written by a third-party contributor and does not reflect the opinion of Born2Invest, its management, staff or its associates. Please review our disclaimer for more information.
This article may include forward-looking statements. These forward-looking statements generally are identified by the words “believe,” “project,” “estimate,” “become,” “plan,” “will,” and similar expressions. These forward-looking statements involve known and unknown risks as well as uncertainties, including those discussed in the following cautionary statements and elsewhere in this article and on this site. Although the Company may believe that its expectations are based on reasonable assumptions, the actual results that the Company may achieve may differ materially from any forward-looking statements, which reflect the opinions of the management of the Company only as of the date hereof. Additionally, please make sure to read these important disclosures.
David Chapman is not a registered advisory service and is not an exempt market dealer (EMD) nor a licensed financial advisor. We do not and cannot give individualised market advice. David Chapman has worked in the financial industry for over 40 years including large financial corporations, banks, and investment dealers. The information in this newsletter is intended only for informational and educational purposes. It should not be considered a solicitation of an offer or sale of any security. The reader assumes all risk when trading in securities and David Chapman advises consulting a licensed professional financial advisor before proceeding with any trade or idea presented in this newsletter. David Chapman may own shares in companies mentioned in this newsletter. We share our ideas and opinions for informational and educational purposes only and expect the reader to perform due diligence before considering a position in any security. That includes consulting with your own licensed professional financial advisor.


Mollie Expands Across EEA With €350M Investment to Strengthen European Payments Network
Fintech company Mollie has expanded into Croatia and Iceland, achieving full coverage of the European Economic Area. It has committed...


Trulieve NYSE Listing Signals New Era for Global Cannabis Industry
Trulieve’s NYSE listing marks a milestone for the cannabis industry, giving a major US producer access to institutional capital after...


Moroccan Bond Market Shows Mixed Signals as Primary Eases and Secondary Pressures Persist
The bond market shows a mixed trend, with cautious easing in the primary market as the Treasury raises limited funds...


Markets Diverge as Oil Falls, Rates Hold, and Inflation Persists
Markets reacted to a U.S.–Iran MOU and unchanged Fed rates, with oil plunging while energy stocks showed divergence. Equities fluctuated...


Cocoa Market Faces Mixed Trends Amid Rising Supply and Weak Demand
New York cocoa prices edged lower Thursday while London closed higher, with mixed but improving daily trends. West Africa’s main...
 |
|
 |  |
 |
|
-

 Impact Investing2 weeks ago
EU Approves €23B Italian Renewable Energy Plan to Boost Climate Goals
-
 Business12 hours ago
Markets Diverge as Oil Falls, Rates Hold, and Inflation Persists
-

 Biotech1 week ago
Advances in Biomarkers and Targeted Therapies Transform Kidney Care in Autoimmune Disease
-

 Fintech5 days ago
Trade Republic Brings Back Human Support and Launches Customer Council