Featured
Why the markets don’t care about the news
Could the NASDAQ reach 10,000 by 2020?

Markets popped higher this morning after a weekend of good news: The Donald and Xi Jinping have agreed to a temporary truce in the U.S.-China trade war. The Donald has eased trade restrictions on Huawei. And The Donald made nice with North Korea.
On Friday, I explained that markets were at that critical point where they could either roll over and die or zoom to the moon. Today’s market action shows we’re clearly following the Dark Window that I forecast back in January already. I hope you’re taking advantage of it.
I first mentioned the Dark Window opportunity in January. While I’ve updated you on the market’s progress along this scenario many times since then, it’s been a long time since I spelled out my forecast. So, in light of today’s market madness, let’s take a trip down memory lane and re-read an email I sent you on January 9th.
I’ve added some highlighted notes below to account for events we’ve seen since this was published.
How the Nasdaq could reach 10,000 in 2019
Who would have thought I would be forecasting that the Nasdaq could zoom to 10,000 this year? (Up until this point, I was known as the market bear with nothing but doom and gloom predictions)
Two things have changed my perspective in recent months: The Q4 2018 crash didn’t approach the typical 40% loss in the first two to three months, as was typical of most major bubbles… and my newer 90-Year Bubble Buster Cycle.
That 90-year Cycle is a “double variation’ of my proven 45-Year Innovation Cycle. It has marked the greatest bubble peaks and “resets” since the Industrial Revolution (1837 to 1842 and 1929 to 1932).
If the current correction doesn’t crash down much harder by early February – which doesn’t look likely at this point [and it didn’t] – then a final blow-off rally would be most consistent with past major bubbles, especially the ones that hit on this 90-year cycle.
What I’ve been looking at…
I’ve been looking at the bubble rallies on all the key indices: The S&P 500, the Dow, and especially the Nasdaq because it’s the lead bubble of the lot.
What I am noticing is that the best support on the final rallies since early 2009 come from a linear trend-line through the bottoms, but the best rally and upside targets come from exponential trend-lines through the tops.
Here’s my best chart for the leading Nasdaq:
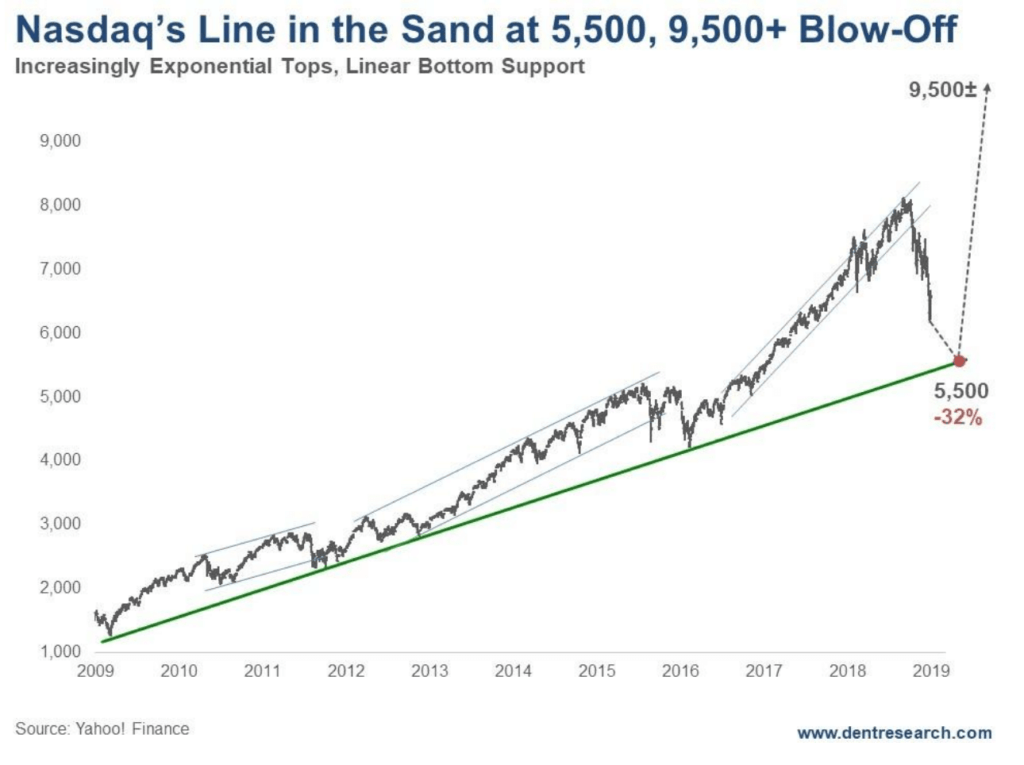
What this chart is telling us…
First, note that bottom linear trend-line. It comes through at around 5,500 in early February [and currently that line in the sand is 5,700 – 5,800 just ahead].
The same trend-line on the S&P 500 comes through around 2,300 currently and will be hit first, and hence, be the first warning, if broken, that this Nasdaq support line could be hit. Again, the Nasdaq is the trump card here.
Next, note the progressive nature of the rally. The first wave into 2011 was more normal. The next wave into 2015 was more exponential.
What does this mean?
If the markets can hold key support ahead, especially by early February, the next rally would project to around 9,500 on an exponential trend, or as high as 10,000 if it makes similar point gains to the last rally in 38% of the time. That takes us into late 2019/early 2020. (Of course, the markets did hold key support, and while they have had a hiccup here and there since January, they remain on track for this target on the Nasdaq by year-end.)
From the recent lows of 6,190, that’s a 53 percent to 62 percent gain. From the bottom trend-line of 5,500, if reached, that’s 73 percent to 82 percent!
If we can hold the 2,300 level on the S&P 500 in the next month, this bullish scenario becomes much more likely.
Should we hold the bottom trend-line on the Nasdaq, around 5,500 currently, it could still follow this extremely bullish scenario?
If the S&P breaks 2,300 substantially suggesting a top in late 2018, then it could just retest its highs, while the Nasdaq rings the big bell with major new highs, assuming it holds 5,500. That would also be consistent with past bubble tops.
One way or the other, 2019 looks to be very different than what many on Wall Street expect. It’s very likely to either be very bullish or very bearish. Not the middle ground they’re suggesting. And I’m still favoring the bullish scenario unless proven otherwise.
I’ll add that, over the last several months, stories in the mainstream media have shifted from being pessimistic to more greed oriented. I’m seeing with increasing frequency the call to get ready for the markets to deliver huge gains in short order. As you encounter these articles, just remember: you heard it here first.
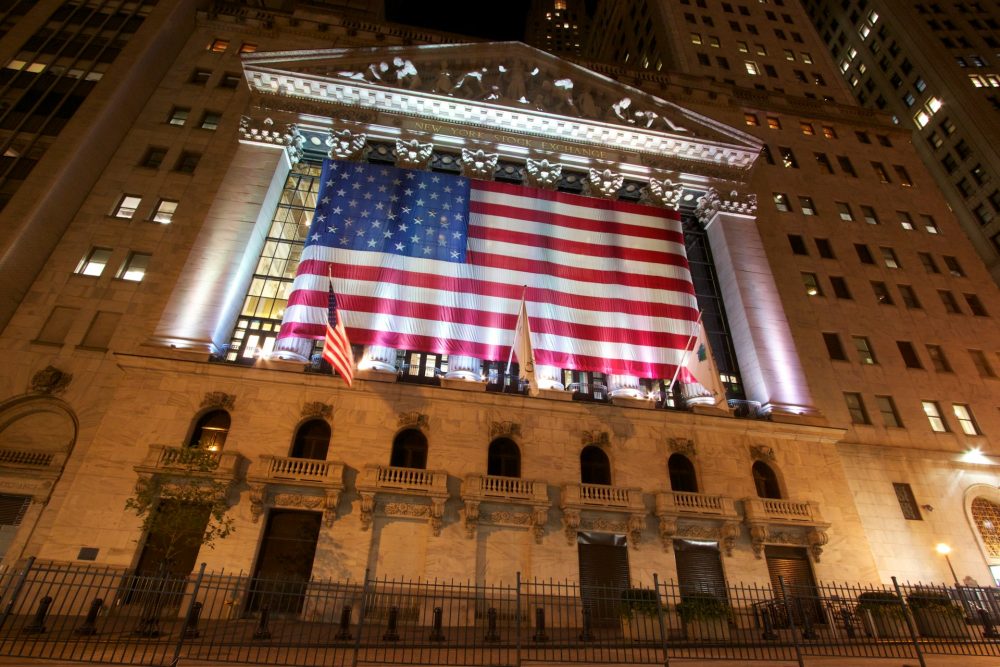
(Featured image by Lrodwman via Wikimedia Commons. CC BY-SA 4.0.)
—
DISCLAIMER: This article expresses my own ideas and opinions. Any information I have shared are from sources that I believe to be reliable and accurate. I did not receive any financial compensation for writing this post, nor do I own any shares in any company I’ve mentioned. I encourage any reader to do their own diligent research first before making any investment decisions.


PayPal’s Slowdown: From Fintech Leader to Low-Growth Dividend Stock
PayPal has shifted from fintech leader to low-growth, value-style stock, losing over 25% in market value and trading at a...


Tilray (TLRY) Falls as Bearish Momentum Persists Despite Marketing Push
Tilray (TLRY) fell 3.32% to $4.44, remaining below key moving averages and signaling continued bearish pressure. Despite a £1 million...


ESG Gap Persists as Firms Struggle to Link Sustainability to Financial Value
KPMG’s Global Survey shows a major gap between ESG awareness and financial integration. While 72% of managers understand sustainability strategies,...


Bitcoin and Ethereum Slide as Market Pressure Builds Amid Strategy Concerns and Layer 2 Disruptions
Bitcoin fell below $60,000 with heavy ETF outflows, pressured by concerns over Strategy’s finances and its STRC stock decline. Ethereum...


AI Venture Builder Launches €600K Crowdfunding Round to Scale Secure AI Solutions
AI Venture Builder, an Italian-British firm developing AI applications and vertical startups, returns to CrowdFundMe with a equity campaign. After...
 |
|
 |  |
 |
|
-
 Cannabis3 days ago
Trulieve NYSE Listing Signals New Era for Global Cannabis Industry
-

 Africa2 weeks ago
Remote Work Reshapes Sales Management: Key Lessons for Moroccan Leaders
-

 Biotech1 day ago
Gilead HSV Plan Could Transform Market Outlook
-

 Crypto1 week ago
Crypto Market Stays Stable as Bitcoin and Ethereum See Mild Declines