Featured
Why Treasury Bonds Are No Longer Seen as Safe Haven During Market Difficulties
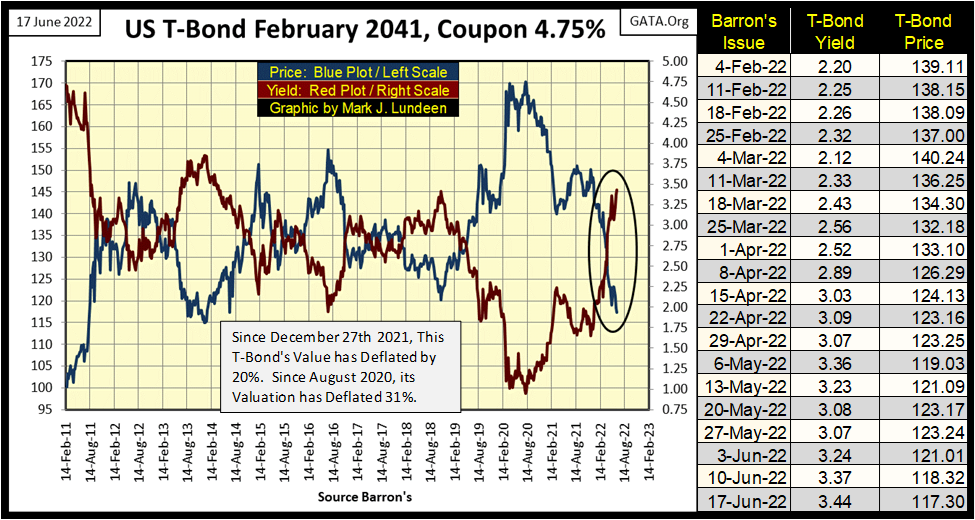
A big problem with the financial stocks, and major concern for the FOMC is the bear market in bonds continues unabated. Since last December, this T-Bond’s valuation has deflated by 20%. From its last all-time high of August 2020, its valuation is off a whopping 30%. Treasury bonds were once universally understood as a haven from the storm in past market difficulties. Not anymore.

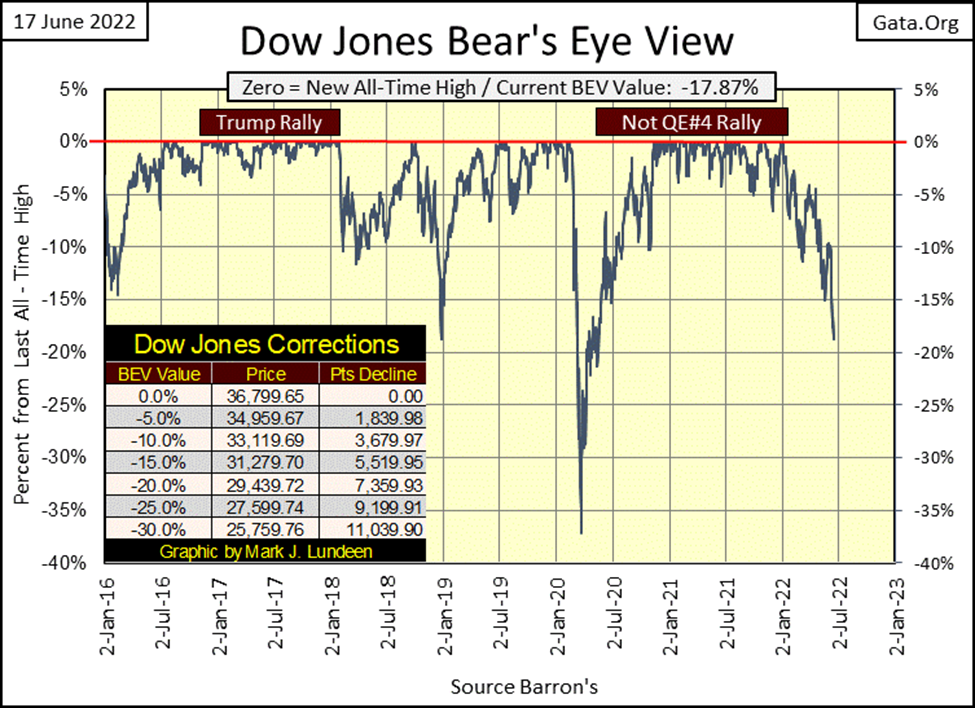
There is no polite way of saying it; the Dow Jones, and the rest of the stock market’s major market indexes appear to be entering a new phase of deflation. The week ended with the Dow Jones only 2.24% from breaking its BEV -20% line below.
A case may be made the Dow Jones is still in a correction within a context of a bull market advance. But in my opinion, by late summer that argument will lose followers. Once the Dow Jones breaks below its lows of March 2020 (BEV -37%), no one will doubt the stock market is in a major bear market decline.
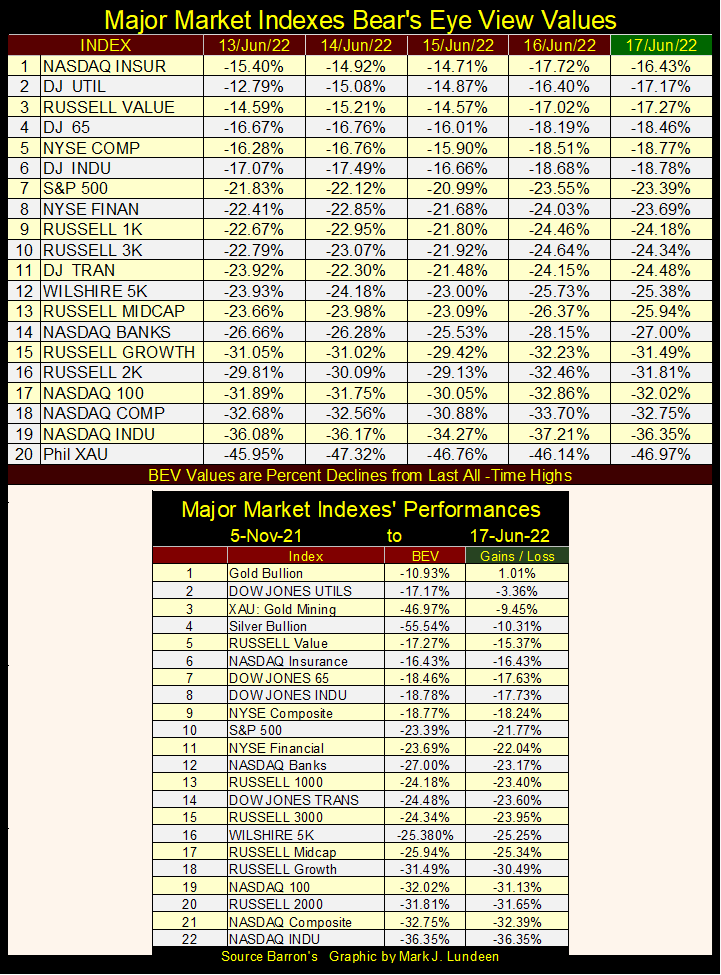
The market’s major indexes below are all snowballing their way deep into bear market territory. Only six of the twenty below closed the week above their BEV -20% lines, while six of the twenty closed the week below their BEV -30% lines.
As the summer progresses, it is very likely we’ll see some rebounds in the indexes below. In fact, I’d count on it. But for longer term, Mr Bear has big plans for the stock market, and the bulls won’t like it one bit!
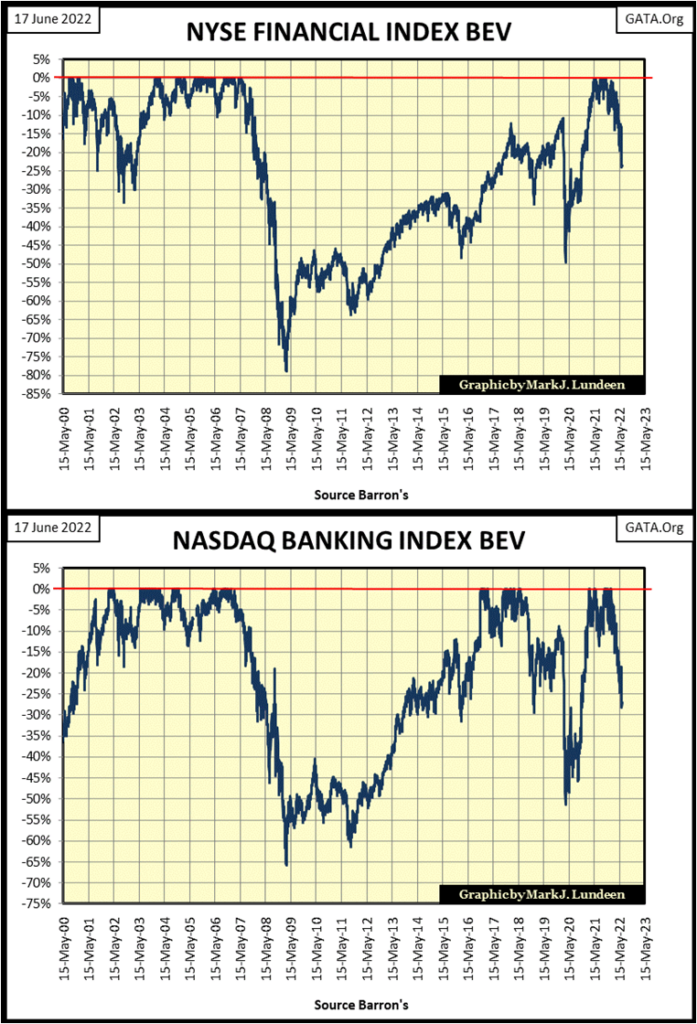
The financial indexes below are losing ground. The NYSE Financial index is at the threshold of breaking below its BEV -25% line, while the NASDAQ Bank index is about to break below its BEV -30% line. And if you compare their current declines with previous declines seen in their BEV charts, their current declines are steeper. Okay, not as steep as the panic selling of March 2020, but still, these indexes are deflating quickly.
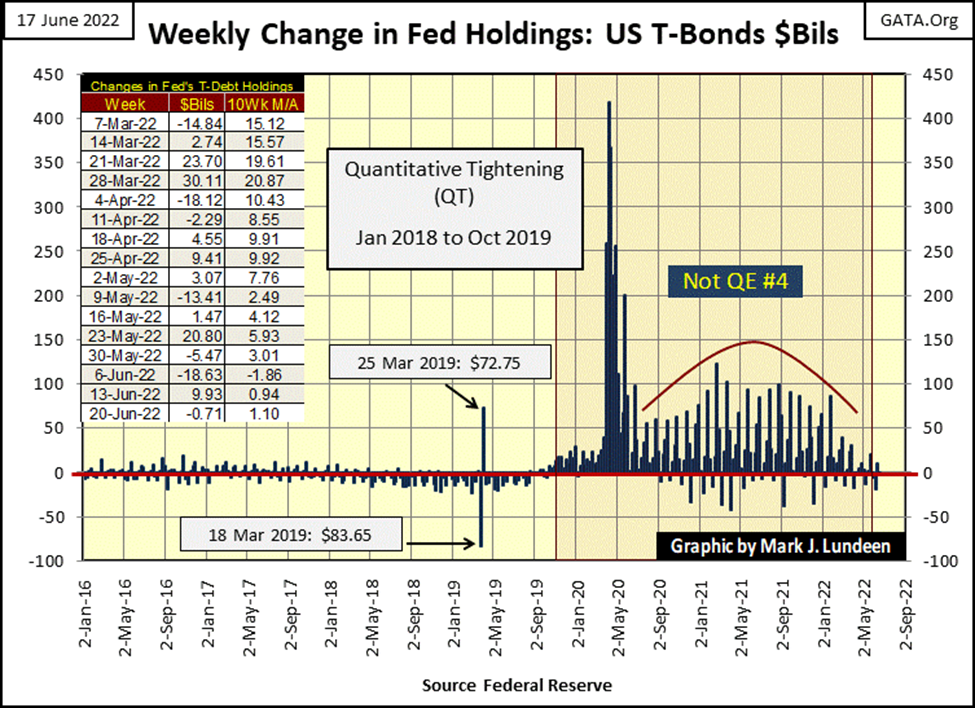
What’s the problem with the financials, and everything else trading in the stock market? The FOMC’s much promoted QT, that promised to withdraw $50 billion a month, month after month must be weighing on everyone’s mind, or should be.
So far, it appears the idiots at the FOMC are reluctant to pull their promised $50 billion of “liquidity” for the month of June. On June 6th they did pull a big $18.63 billion, but then they “injected” $9.93 of that back into the market the week after. This week they only withdrew $0.71 billion from the market. So, for the month, the idiots withdrew only $9.41 billion from their promised $50 billion for the month of June.
We still have two weeks left in June for them to pull out the remaining $40.59 billion. Should the stock market continue deflating, I doubt they’ll do that. But, this week the FOMC did increase their Fed Funds Rate to 1.58%, up from 0.83% the week before, which didn’t help the bulls.
Mortgage rates continue rising too. Mortgages closed the week at 5.78%, far above from where mortgages were seventeen months ago in January 2021: 2.65%. The squeeze on single family home valuations continues.
One is tempted to ask why are mortgage rates and bond yields rising. A better question to ask would be; how did they get so low?
A big problem with the financial stocks, and major concern for the FOMC is the bear market in bonds continues unabated. Since last December, this T-Bond’s valuation has deflated by 20%. From its last all-time high of August 2020, its valuation is off a whopping 30%. Treasury bonds were once universally understood as a haven from the storm in past market difficulties. Not anymore.
The US National Debt is just over $30 trillion. If you have the money, I’d wager you could buy the entire US national debt with slightly more than $20 trillion. Like the bond below, for a discount of about 30%. If you do have $20 trillion, I don’t recommend it as bond yields (Red Plot below) have lots more room to move to the upside, and bond valuation (Blue Plot) to the downside.
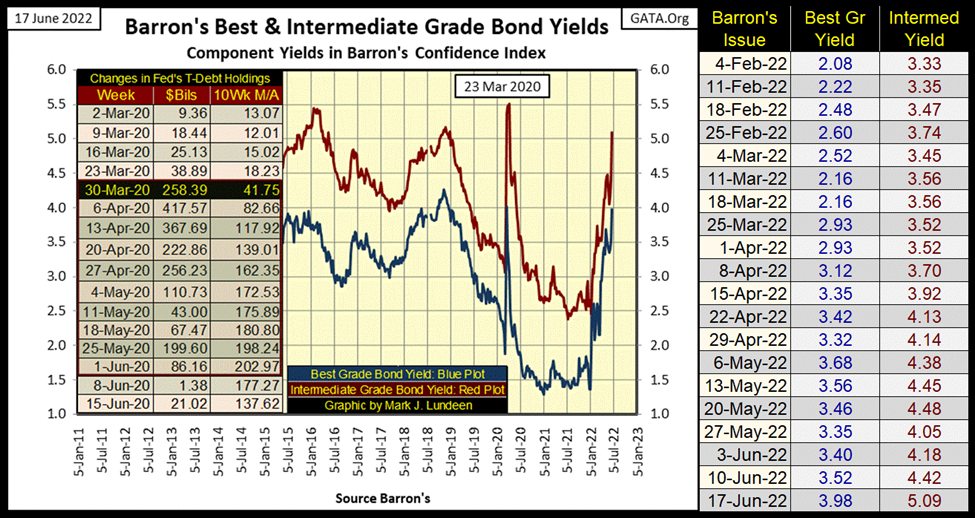
Barron’s Best & Intermediate Grade Bond Yields (below) continue their relentless rise. Not good for the pension & trust funds, as well as the insurance companies that hold them for reserves.
Something else that no one else is talking about, is the impact these rising bond yields must one day have; massive defaults somewhere in the hundreds-of-trillions of OTC derivatives market that made so much money for Wall Street when bond yields were in decline.
For decades Wall Street “wrapped” an interest-rate derivative around every bond they sold to the public as a form of insurance against the improbable event of rising bond yields (deflating bond prices). As rates and yields only went down, it was all profit and no risk to the banks.
But that was then, and this is now. That improbable market event, as seen below, is now. I doubt the big banks on Wall Street have the means of honoring their commitments to their counterparties when these derivatives come into the money. This exact thing happened before, during the sub-prime mortgage crisis of 2007-09. Had Washington not bailed Wall Street out with their QE-1, the big banks would have gone down for counterparty failure.
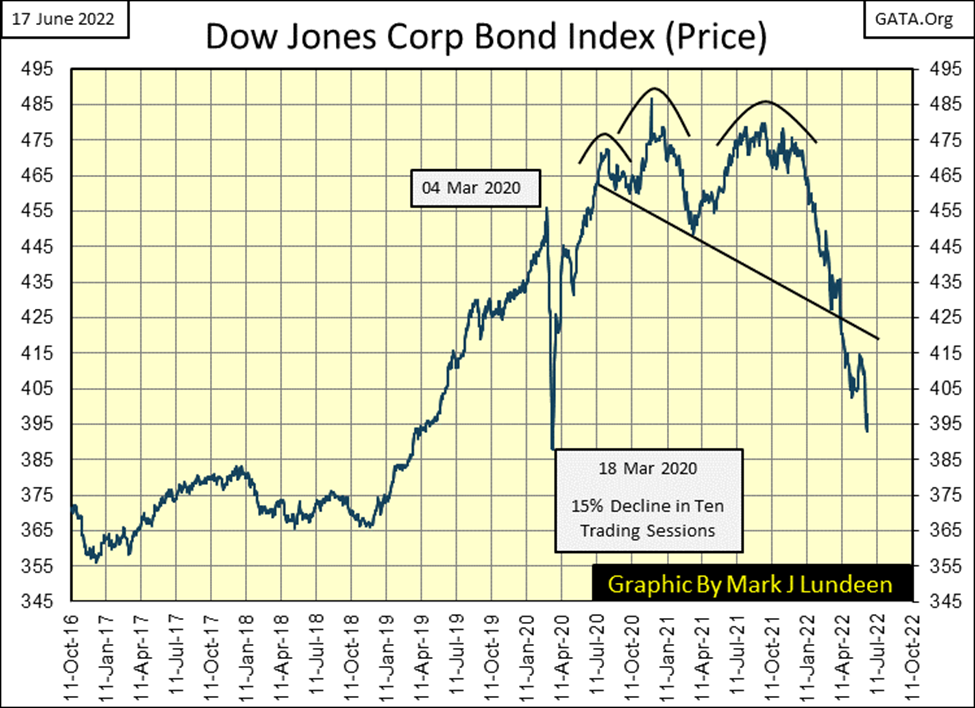
The chart above is for corporate bond yields. If you’re curious what is happening to corporate bond prices, here is a chart for the Dow Jones Corporate Bond Index (Price). This index’s 2020 high was 485; it closed this week at 398.35, a loss in valuation of 18%. Which oddly is less than the 30% deflation the T-bond market has endured since 2020.
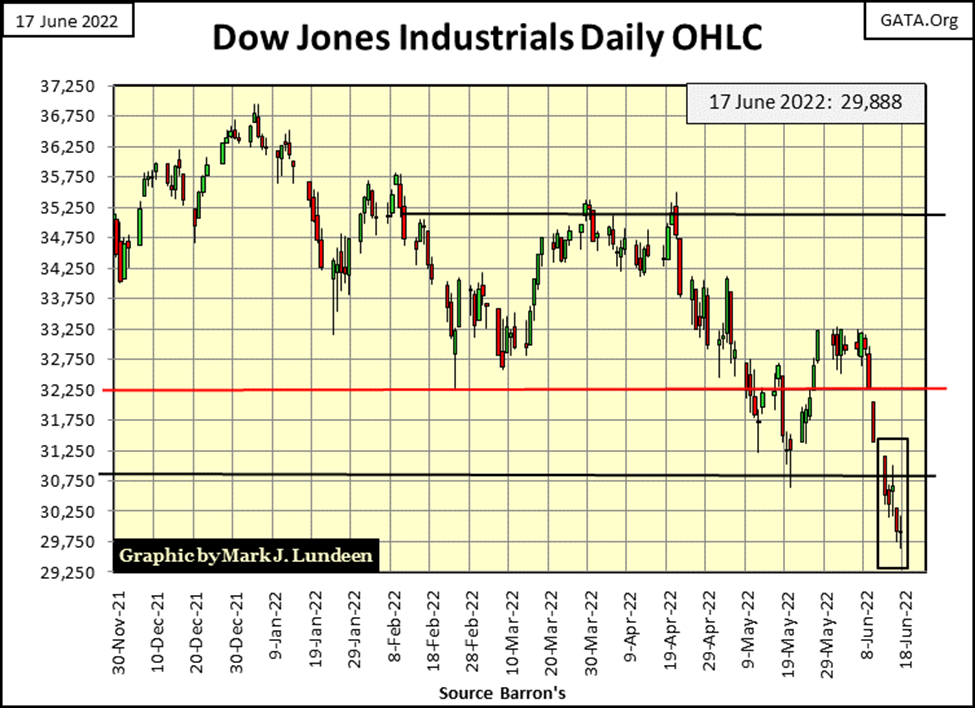
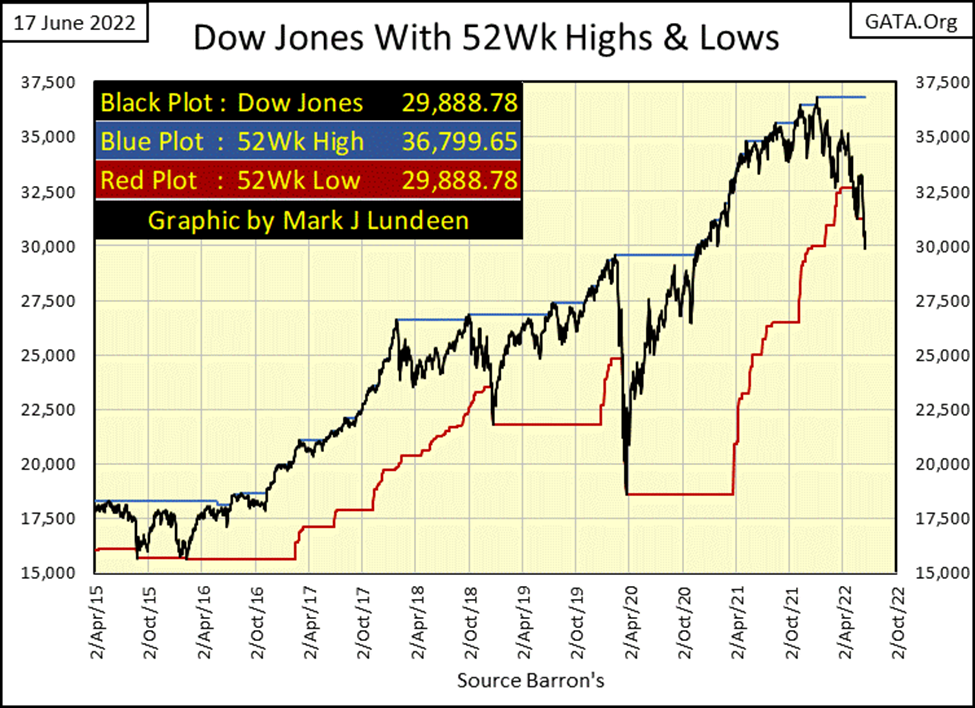
This week the Dow Jones broke below its lows of May in its daily bar chart below. That plus the Dow Jones closed below its 30,000 level on Thursday and Friday, far from its last all-time high of 36,799 on January 4th of this year.
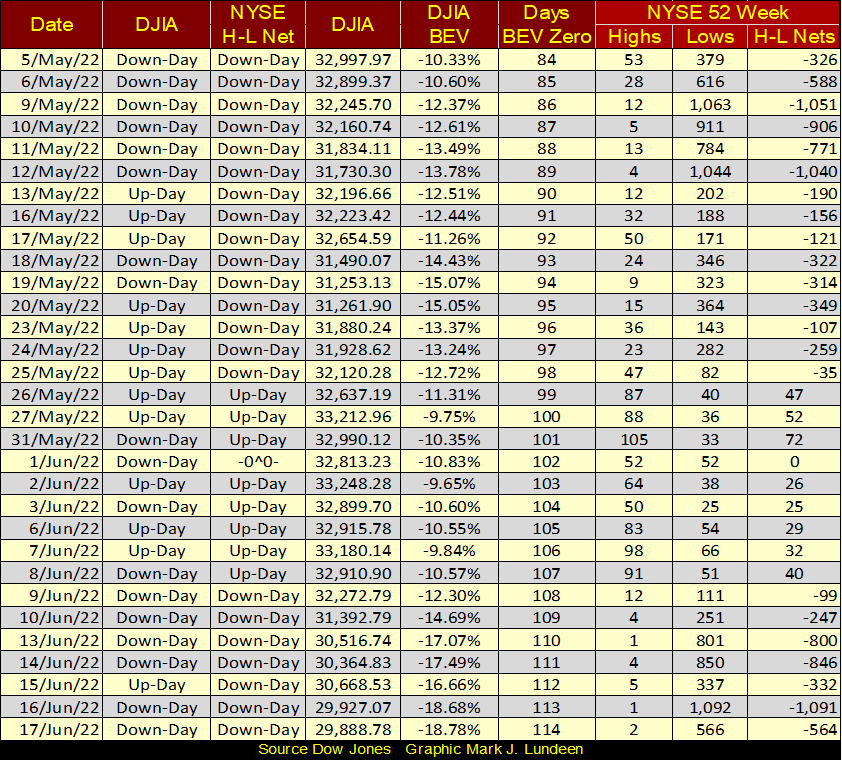
This week the Dow Jones resumed making new 52Wk Lows (below).
It’s not just the Dow Jones making new 52Wk Lows. On Thursday this week, the NYSE saw a 52Wk H-L Net of -1,091, and a H-L net of -564 on Friday. Actually, all this week the NYSE was producing an overwhelming abundance of new 52Wk lows. That string of positive 52Wk H-L nets spanning from May 26th to June 8th is appearing more and more like a bear-market anomaly.
Commodity prices have stabilized a bit in the table below, but the bull market in commodity prices still has a good way to go. The day is coming when we’ll see plenty of BEV Zeros, and closings within scoring position (closings within 5% of a new all-time high) in the table below.
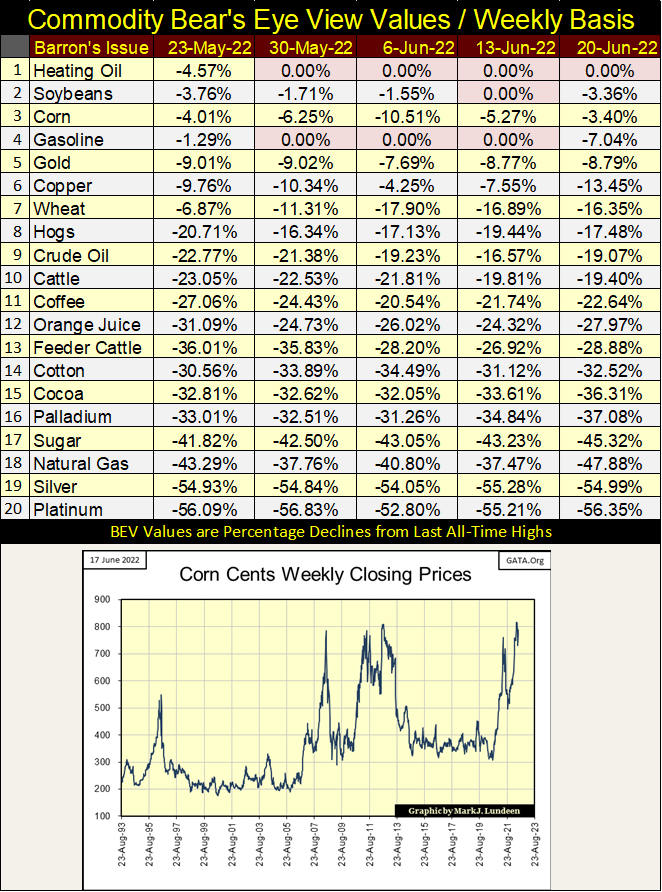
Corn at 2000 ($20) a bushel? Give it time.
What is a step sum? It’s the sum total of all the up and down steps a market makes over time, with daily advances equal to +1, and daily declines equal to -1. In other words, it’s a single item Advance – Decline line. An amazing fact, to me any way, is how many down days occur in bull markets, and how many advancing days a bear market sees. Come market advances or declines, the market sees about as many up as down days.
To see exactly what that means, the Dow Jones step sum at week’s close was 1,602. This sum is derived by subtracting the down days for the Dow Jones from its up days, since the NYSE’s first day of trading for the 20th century; 02 January 1900. The specifics for the daily ups and downs for the Dow Jones for the past 122 years are seen in the little table below.
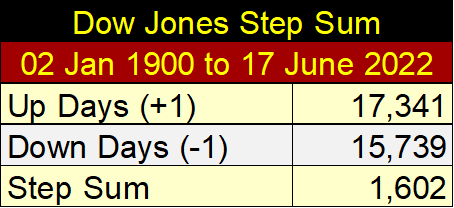
On 02 January 1900, the Dow Jones closed at 68.13. This week it closed at 29,888, an advance of over 29,000 points, all because since 02 January 1900, the Dow Jones had daily advanced 1,608 more times than it declined. Okay, its not that simple, as one has to take in to account how much the Dow Jones advanced on its up days, and declined on its down days. Something I have neither the statistical skills or mental patience to deal with.
No matter, taken at face value these numbers are amazing; that since 02 January 1900, the Dow Jones has advanced over 29,000 points with only a net of 1,602 daily advances, of the 33,080 NYSE trading sessions of the past 122 years.
So, what does this data of the daily ups and down of the Dow Jones tell us about the market? Analyzing this data for a long time, I’ve concluded the step sum is an indicator of a market’s expectations for the future; whether or not on the whole, if the people who * DAILY TRADE * in the market are net bullish or net bearish.
Typically, a market’s step sum (market expectation) is coupled to its price action (market reality). Market valuations rise, and so does its step sum. Market valuations deflate, and so does its step sum. But not always, as sometimes a market’s expectations decouple from its market reality.
Last week I published a chart of the step sum-bear box that formed in the Dow Jones during the Great Depression Crash, where from April 1930 to April 1931 (the bear box), the bulls refused seeing things Mr Bear’s way. I published this chart again this week (below).
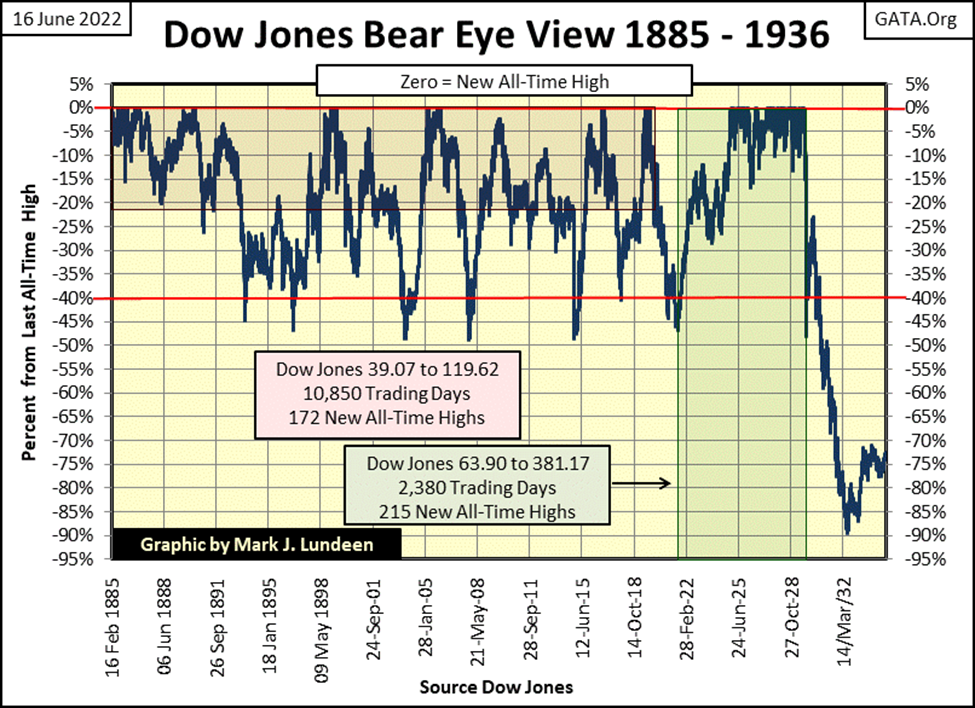
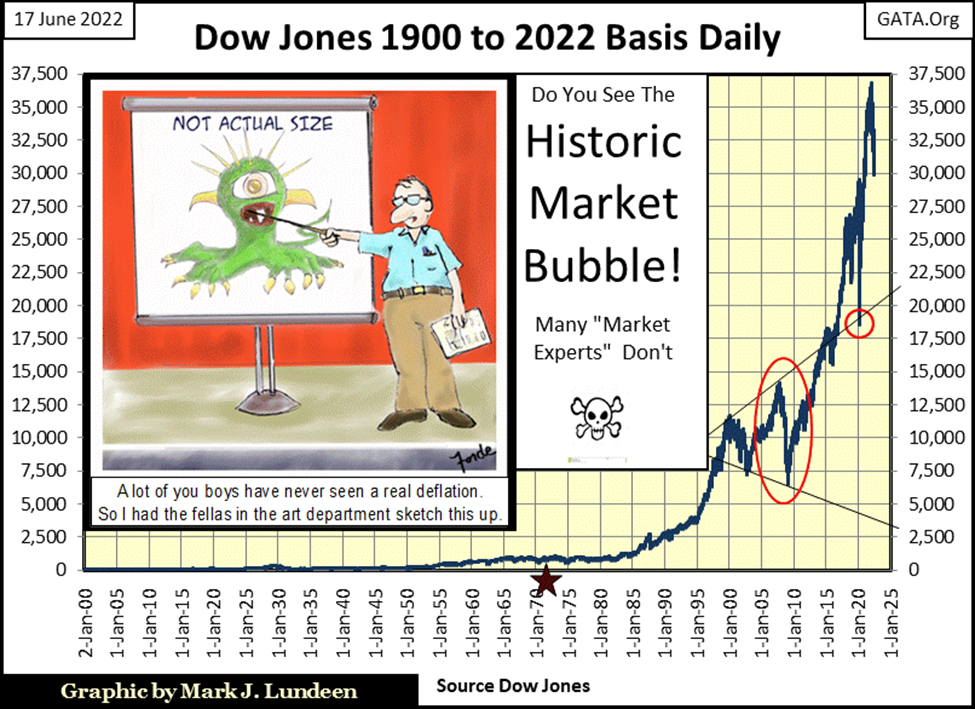
In the early stages of the Great Depression Crash; why were the bulls’ so wrong? Since the Dow Jones was first published in February 1885, it had seen six bear markets, with none of them seeing the Dow Jones decline by 50% from their last all-time highs (see BEV Chart below). In the early 1930s, the possibility of seeing the Dow Jones deflate by 90% in the next few years must have been inconceivable to most seasoned investors. Such things just didn’t happen.
For darn good reason, the smart money of 1930 believed the bottom was in, or near at hand. So, during the one year seen in the step sum bear box below, the bulls were buying on market weakness; meaning following a down day in the market, the bulls entered the market buying bargains trading at the NYSE. As seen by the Dow Jones step sum (market expectations) refusal to follow the Dow Jones itself (market reality) down, from April 1930 to April 1931.
Following April 1931, one by one the bulls figured out something very wrong was happening in the stock market. That the inflation in market valuations during the Roaring 1920s bull market (courtesy of the Federal Reserve’s easy monetary policy) was being deflated by Mr Bear, and there was nothing anyone could do about it. Oh, they didn’t think of the market in those terms. But they ultimately realized buying stocks at the NYSE was a mug’s game, so they left with the little, if any money, and dignity they still had, and didn’t come back.
The bulls, now converts to the bear’s side of the market, stopped buying on market weakness, and began selling into market strength to close out their massive losing positions, resulting in the step sum collapsing, recoupling to the Dow Jones in the chart below. Both Dow Jones’ market expectations and market reality bottomed in the summer of 1932, and then bounced. Signaling the pent up selling by the distressed bulls of the 1920s bull market was exhausted, and was once again safe to buy stocks.
Bear boxes, as seen below, don’t always happen during bear markets. They are actually rare market events. But another year long bear box formed in the Dow Jones during the 2007-09 subprime mortgage bear market. But it was very different from the 1930-31 bear box, as seen below.
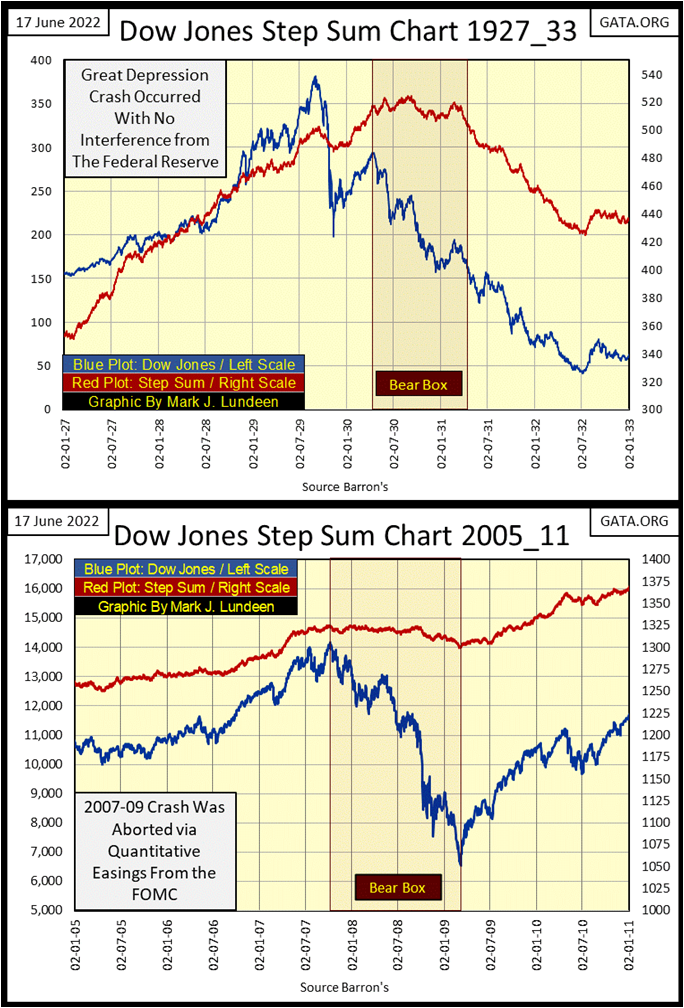
What was different from the early 1930s box, was the 2007-09 bear box’s step sum (above) never collapsed, never recoupled with its bear market reality. I believed it would have collapsed, along with much deeper declines in market valuations had the market been left to its own resources.
But Dr. Bernanke (Fed Chairman) came to the bulls’ rescue with his implementation of his first quantitative easing (QE-1). He “stabilized market valuations” by flooding the financial system with hundreds-of-billions of dollars of pure monetary inflation.
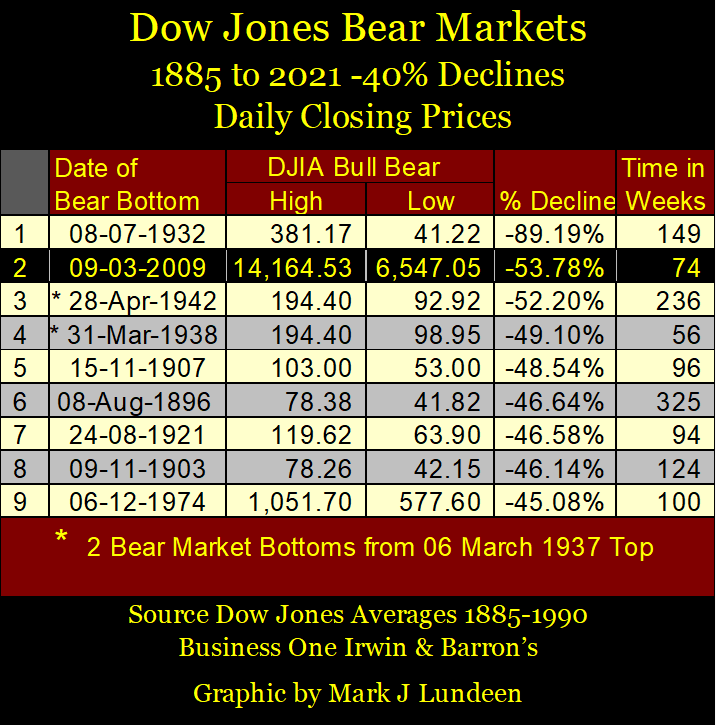
The second deepest bear-market percentage decline since 1885 (#2 in table below) was aborted before term, as the FOMC refused to allow the Dow Jones to deflate below 54% from its previous bull market high seen in October 2007.
The FOMC’s market intervention solved none of the underlying problems the American financial system had, so they are still with us, becoming chronic. Bond yields became chronically low since 2009, a situation that makes the current increase in yields so hazardous to financial institutes and the Federal Reserve itself.
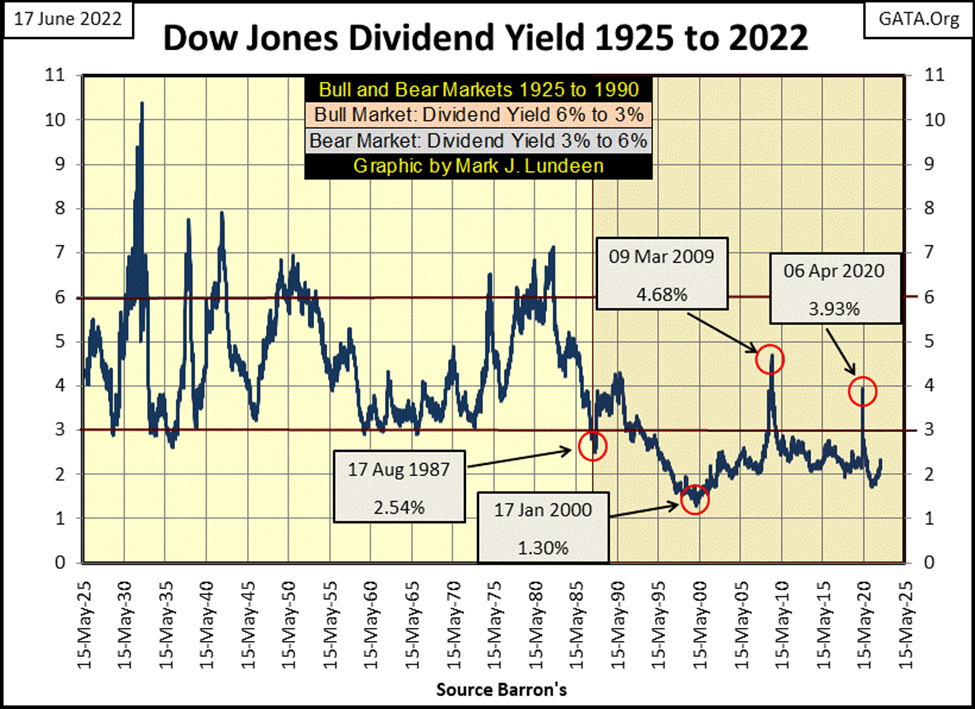
Dow Jones’ (my proxy for the broad stock market) dividend yields have been chronically low since 1987, again due to “monetary policy” dictated by the FOMC.
At the top of the NASDAQ High-Tech Market bubble in January 2000, the Dow Jones was so overvalued it yielded a pathetic 1.30% (chart below). Since then, any time the Dow Jones has yielded something over 3% (again; chart below), rising dividend yields (deflating share prices) became a major medical emergency, requiring massive “injections of liquidity” to “stabilize” the FOMC’s patient (the stock market).
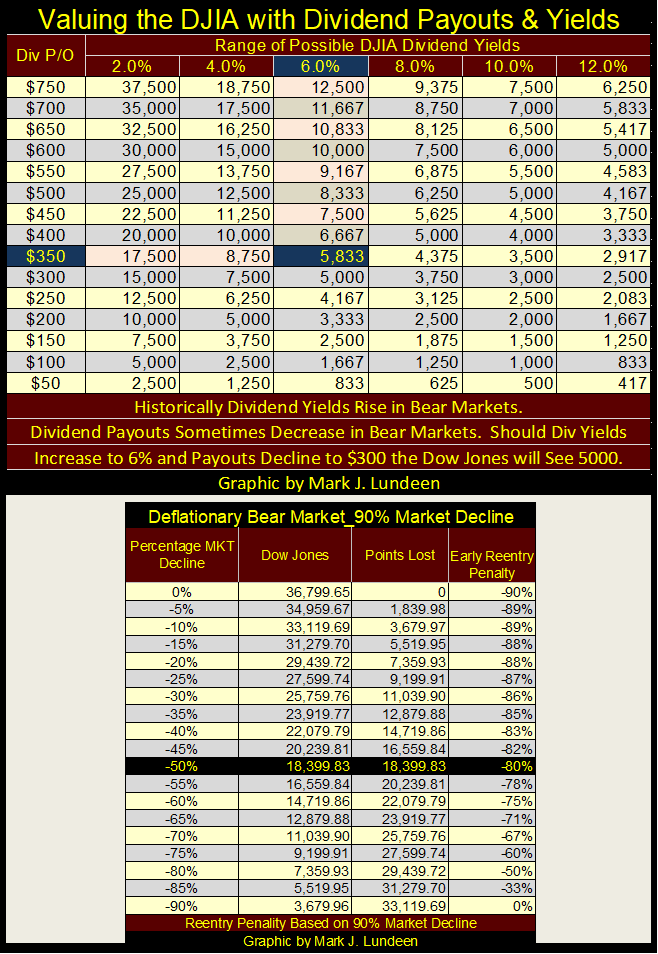
This chart below plotting dividend yields for the Dow Jones going back to 1925, is evidence enough proving the market has major difficulties ahead of it. Like it or not, one day in the future the Dow Jones, for the first time in forty years, we’ll see its dividend yielding over 6%, most likely something over 8%. The impact that will have on stock market valuations will be stunning.
Currently, with the Dow Jones dividend payout at $697, a yield of 6% would deflate the Dow Jones to 11,616, a bear market decline of 68.4%. Or in Bear’s Eye View terms; a BEV of -68.4% from its last all-time high of 36,799 from last January 4th.
But the above assumes payouts for the Dow Jones are not reduced. However, in big deflationary bear markets, such as the one now bearing down on us, dividend payouts are almost always reduced by a large percentage. Corporations struggling to stay in business routinely cut, or completely eliminate their dividend payouts as a matter of survival.
As seen in the table below, should payouts for the Dow Jones sink to $350, with a 6% yield, the valuation for the Dow Jones would deflate to 5,833, a bear market decline of 84%.
But with bond yields fated to increase to double-digits, so too will the dividend yield for the Dow Jones in a worst-case scenario. The table below calculates the valuation for the Dow Jones at the given dividend payouts and yields.
Yep, the table below tells a sad, sorry story of what happens when so many, place so much trust in the corrupt hands of bunch of a idiots dictating “monetary policy” at the FOMC. But don’t forget, it was our elected officials, who in 1913 created our infernal Federal-Reserve System.
With all that said, what is happening with the Dow Jones in its current bear box below? As you can see, it’s coming along just fine, in a bearish sort of manner.
Keep in mind things could change. The step sum could begin collapsing next week. A step sum of 1590 would pretty much close this box. Then, there is always the possibility that the Dow Jones could turn around, and recouple with its step sum. Should that happen, this box would become invalid (fail), and we may see the Dow Jones making new all-time highs in the months to come.
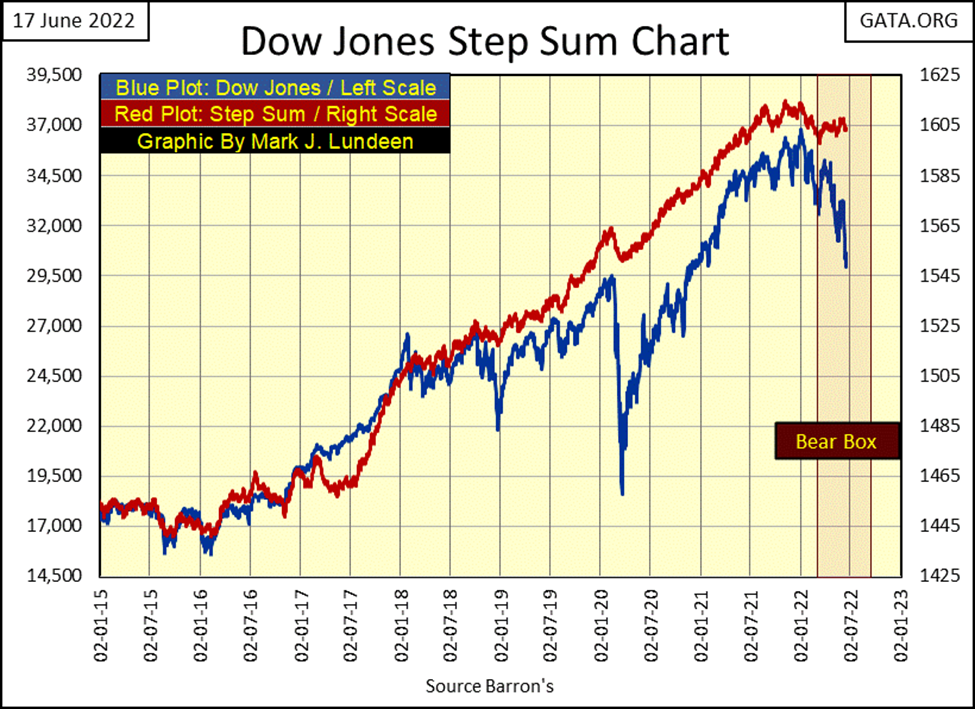
As things now stand, I believe the Dow Jones’ last all-time high of January 4th (36,799), will prove to be what is called in Bear’s Eye View terminology: its Terminal Zero (TZ), the last all-time high of a bull market advance.
As the current bull market began in August 1982 (chart below), a bull market advance that took the Dow Jones from just under 800, to 36,799 forty years later, all due to the “monetary policy” of the idiots in the FOMC, I suspect we’ll see a historic bear box formation in the coming months, maybe lasting a year or more.
An important aspect of all bear boxes is the market psychology of the bulls; that no matter how far the market has fallen, they keep coming back to buy more. As in April 1930, where the bulls had no reason to expect a massive 89% market decline was upon them, I believe today’s bulls see things that way too.
And the bulls I’m talking about are the idiots at the FOMC; bulls with unlimited funding due to their ability to create as many dollars, as many trillions-of-dollars they deem necessary to “stabilize market valuations.” No doubt about it, these idiots are some bad-ass dudes who have earned their street credibility up and down Wall Street. BUT, in the second half of 2022 are they able to take on Mr Bear in up close and personal, hand-to-hand combat?
This will be the fight of the 21st century: the former self-proclaimed “Masters-of-the-Universe” Vs Mr Bear in a stupendous cage match, with only one of them walking out alive.
* The smart money is betting on Mr Bear. *
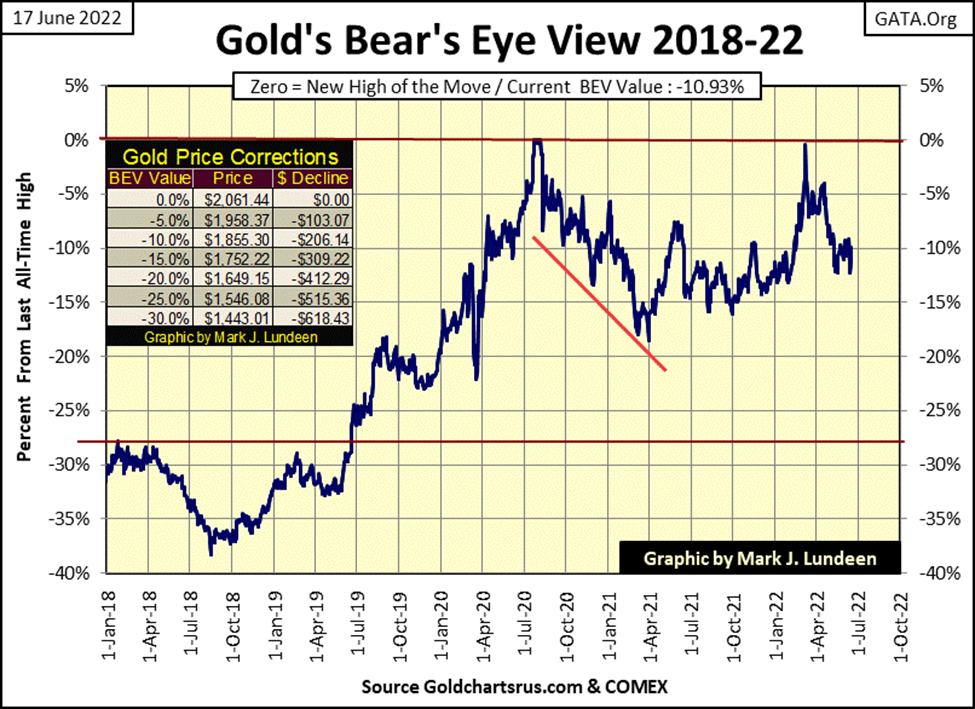
Let’s look at gold’s BEV chart. The first thing that comes to my mind when looking at the chart below, is how much more bullish gold’s BEV chart is when compared to the Dow Jones’ BEV chart above.
I can’t say when gold will be making new all-time highs in the chart below. But I can say since October of last year, gold has refused to break below its BEV -15% line. At the close of this week, that is something the Dow Jones can’t say.
As bond yields continue rising, and valuations in the stock market continue deflating, it will become ever more difficult for the COMEX goons to keep the price of gold below its last all-time high.
Gold’s step sum chart below also looks positive. Sure, there is a bear box in effect in the gold market. And bear boxes are places where bulls go to do damage to themselves – but not always. And in gold’s case below, I think the bulls may be correct by continuing buying on market weakness.
I inserted two trend lines in the chart below. Since January 2021, neither gold’s step sum or price plots have broken below them, and that is a big positive. Go back up to the Dow Jones’ step sum chart. It doesn’t look anything like gold’s step sum chart below.
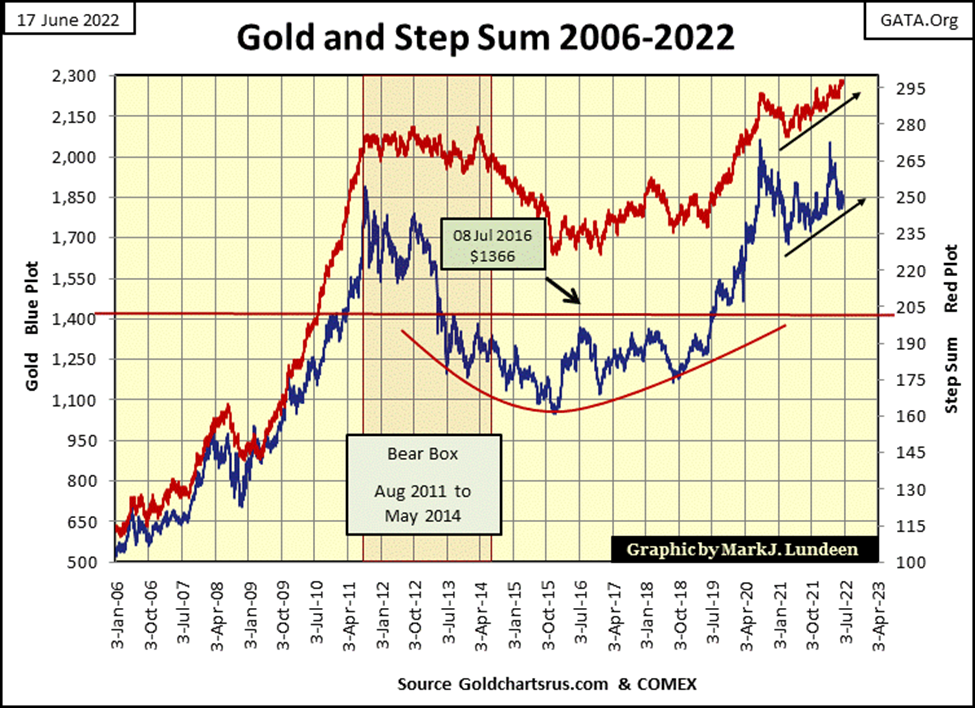
In the past couple of weeks, these step sum tables below have really assisted in seeing the bear boxes in both gold and the Dow Jones. From May 13th, gold’s step sum was 291, the Dow Jones’ at 1602. At this week’s close gold’s step sum was up six steps, to 297, while the Dow Jones remained unchanged at 1602.
Now look at their prices. From May 13th, with gold closing at $1811, to this week on Tuesday, where it closed at $1808. What a bummer! But the bulls didn’t care, as in a bear box, bulls always rush in to buy on market weakness. Gold closed the week at $1836, but it closed Thursday at $1856.
Buying on market weakness in a bear box usually proves to be a bad idea. But this time in the gold market, with deflating market valuations for financial assets and real estate, and concerns of rising interest rates and CPI inflation, and the bloodbath now occurring in the crypto currencies like bit-coin, I see the bulls’ logic of buying gold on market weakness.
* Go Bulls Go! *
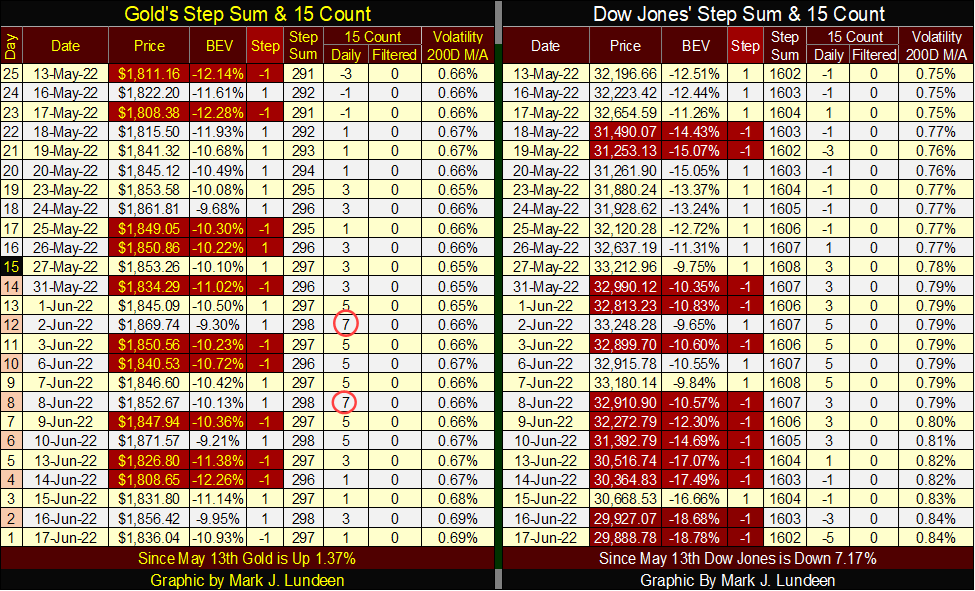
Now look at the Dow Jones side of the table above. Since May 13th, its step sum may have remained at 1602, while oscillating up and down for the past five trading weeks. But the price of the Dow Jones itself is down 2308 points since May 13th.
If the Dow Jones is to continue its bear box, the market is going to require some real idiots to come back in and start “scooping up all the bargains” now trading on Wall Street. And idiots with unlimited deep pockets is what the FOMC has in abundance. My hunch for the next few weeks is we’ll see the stock market rebound before Mr Bear continues his claw back on market valuations sometime in July and August.
But what do I know about what the next few weeks will bring? I’m still out of this market, sitting high above the playing field in the cheap seats, drinking beer and eating peanuts as the bulls and bears continue to slug-it-out below. I’m just a guy enjoying the show, and what a show it is.
__
(Featured image by Tumisu via Pixabay)
DISCLAIMER: This article was written by a third party contributor and does not reflect the opinion of Born2Invest, its management, staff or its associates. Please review our disclaimer for more information.
This article may include forward-looking statements. These forward-looking statements generally are identified by the words “believe,” “project,” “estimate,” “become,” “plan,” “will,” and similar expressions. These forward-looking statements involve known and unknown risks as well as uncertainties, including those discussed in the following cautionary statements and elsewhere in this article and on this site. Although the Company may believe that its expectations are based on reasonable assumptions, the actual results that the Company may achieve may differ materially from any forward-looking statements, which reflect the opinions of the management of the Company only as of the date hereof. Additionally, please make sure to read these important disclosures


The German Biotech Industry Faces Funding Crunch Despite Market Stability
German biotech held steady in 2025 but faces ongoing financing pressures, according to EY-Parthenon and BIO Deutschland. Total capital fell...


Argentina Legalizes Cannabis Seed Sales Under New Regulatory Framework
Cannabis seeds purchase becomes legal in Argentina under INASE Resolution 260/2022, allowing open acquisition but keeping cultivation illegal without Reprocann...


Côte d’Ivoire Cocoa Price Crisis: Record Decision Turns into Market Breakdown
Three weeks before the 2025 election, Côte d’Ivoire set a record cocoa price of 2,800 FCFA/kg, based on its pricing...


Transition to a Sustainable Economy as a Strategic Global Shift in a Fragmented World
The sustainable transition is entering a decisive phase where climate, nature, resources, and social systems are converging into a single...


Bitcoin and Ethereum Stabilize as Markets Watch ETF Flows and Institutional Moves
Bitcoin and Ethereum are stabilizing early in the week, with BTC near $63,000 and ETH around $1,650, though ETF outflows...
 |
|
 |  |
 |
|
-

 Crypto2 weeks ago
DeFi Hacks Surge in 2026, Exposing Major Security Weaknesses in the Crypto Industry
-

 Business6 days ago
TopRanked.io Weekly Affiliate Digest: What’s Hot in Affiliate Marketing [+ The Best Affiliate Program Directory on the Internet]
-

 Crowdfunding1 week ago
Spain’s Crowdfunding Sector Surges as Real Estate and SME Financing Expand
-
 Cannabis19 hours ago
Argentina Legalizes Cannabis Seed Sales Under New Regulatory Framework