Markets
Numbers and predictions – Will Dow Jones Bear’s Eye View (BEV) soon stagnate?
Making 32 new all-time highs in the past 77 NYSE trading sessions, or seeing a new all-time high in 41% of the daily closings since the November election is simply historic market action.
Dow Jones Bear’s Eye View (BEV) may soon end its string of new all-time highs and come to stagnation.
The Dow Jones Bear’s Eye View (BEV) chart below is so weird. Immediately after the November 8th Presidential elections, the Dow Jones leaped up to a new all-time high (0.00% / BEV Zero line) and has stayed within 1.21% of being a new all-time high for the past four months (Red Oval). Making 32 new all-time highs in the past 77 NYSE trading sessions, or seeing a new all-time high in 41% of the daily closings since the November election is simply historic market action.
© Mark Lundeen
How much longer can this go on? I don’t know about you, but after four months of this, I’m getting bored with it. Reason tells me we’re closer to the end of this amazing string of new all-time highs than to its beginning. That plus the FOMC, after eight years of zero interest rates, is finally seeing the necessity of increasing their Fed Funds Rate. Now that Donald Trump is president, it seems the dudes making “monetary policy” now feel an obligation of popping the bubble they’ve inflated in the stock and bond markets.
Those policy dudes always make it sound as if they’re above politics. That “monetary policy” is always driven by economic data. But that’s ridiculous. Obama is a commie-community organizer from the South Side of Chicago, the part of town that’s now seeing a blood bath of gang violence. That’s something the guys at the top of the economic food chain could respect. Trump, on the other hand, wants the prosperity of the 1950s to be restored to America’s middle class, and that’s something they cannot allow.
Here’s a chart plotting the Fed Funds Rate and the US Long Bond Yield going back to 1995. The FOMC sets the Fed Funds Rate as they “execute monetary policy.” And each time the Fed Funds Rate (Blue Plot) was increased above the Long Bond Yield (Red Plot), a bubble in the financial markets began deflating. First the NASDAQ High-Tech bubble in 2000, then the Sub-Prime Mortgage bubble in 2007.
The “policy makers” kept their Fed Funds at near zero for the entirety of the Obama Administration – eight years. We can be sure that isn’t going to happen during the Trump Administration. They won’t come out and publicly admit it, but the FOMC has finally found the motivation to once again invert the yield curve by increasing their Fed Funds Rate above the yield of the US Long Bond, knowing full well the bearish consequences of doing so. I know it has to be done sometime. But the FOMC’s timing of popping this bubble is off by about six years.
My readers will not want to own stocks or bonds when that happens! And we may see the financial markets begin deflating before the yield curve actually inverts.
© Mark Lundeen
So, how are the banks doing? Like the Dow Jones, apparently since the November election, they can only do one thing – go up in valuation. Well, it’s about time. After having trillions of dollars “injected” into their balance sheets, the Federal Government altered accounting standards to maintain a fiction of solvency, and have every stock tout on Wall Street extol their virtues; should we be surprised these banks are finally going up?
© Mark Lundeen
But things are not right with the big banks. Former Fed Governor, Kevin M. Warsh retired from the Federal Reserve in March 2011. After five years at the Fed, he obviously felt the need to come clean, which he did in the May 2011 issue of Central Banking.
“Market participants, for example, need a clearer, better understanding of large financial institutions to be good policemen themselves. But the financial statements, the annual reports, the 10Ks, the 10Qs of the largest banks around the world tell us so little about their true risks. If you spend a few hours reading the financial statements of Wal-Mart or Proctor & Gamble, then you would understand their business and financial statements reasonably well. It is virtually impossible to do so for the largest global banks.”
– Kevin M. Warsh, member of the Federal Reserve Board of Governors February, 2006 – March, 2011. Quote from May 2011 issue of Central Banking (pages 32-40)
This quote is six years old. However if anything, things for the big banks have become worse with the passage of time. The people managing these financial institutions are predators who have good reason to believe they’re above the law, and they act accordingly.
Here’s the chart for the Retailers. They’ve been one of the best performing groups since 1989. But this amazing growth has gone hand in hand with the expansion of consumer debt. If the number of ads I see on the television for attorneys specializing in personal bankruptcy is any indication, as a class, consumers in 2017 are in trouble. The retailers won’t be far behind.
© Mark Lundeen
Now let’s look at the gold miners. Compared to the Dow Jones, the banks and retailers above, and just about anything else, the gold mining stocks have done little since 1989. During the past three decades, the plot below has been contained between 25 and 145. Compare that performance with the banks and retailers above.
That’s not to say the precious metals miners haven’t had their days since January 2001. They’ve seen excellent advances that placed them near or at the top in the Dow Jones Total Market Groups, as we saw last year. But there has always been something preventing them from seeing the superb – long term advances most other groups in the DJTMG have enjoyed since 1989.
© Mark Lundeen
So, what’s the problem with the gold and silver miners? That’s simple; gold, silver and their mining shares don’t directly benefit from the inflation flowing from the Federal Reserve. By design; stocks, bonds and real estate do. What drives precious metal assets valuations up is DEFLATION (big bear markets) in stocks, bonds and real estate.
Take a look at how the gold miners performed in the aftermath of the NASDAQ High-Tech (2001-06) and sub-prime mortgage (2008-2011) bubbles. It was during these times the gold miners became a top performing stock group. Had Greenspan in 2000, and again with Doctor Bernanke in 2008 not practiced bear-market interruptus with their massive “injections of liquidity” and interest rate manipulations, the gold mining chart above would have a completely different appearance today in March 2017!
Fear not, the day is coming when rising bond yields and interest rates will once again do what they have always done; motivate capital to flee from deflating financial assets into gold, silver and their mining shares. The bear market in stocks and bonds coming our way is going to be historic, and for that reason, I expect so too will be the bull market in gold, silver and their miners.
Since the 1913 passage of the Federal Reserve Act, money has become political. Once the dollar was a metallic standard; a statutory defined weight of gold or silver. Paper money was a debt payable in gold or silver. But after the inflation of the 1920s went bust in the 1930s, all that was to change.
Instead of removing the Federal Reserve Notes circulating in the economy, and directing the Justice Department to prosecute members of the FOMC and their accomplices in the New York banking establishment, FDR, exactly like Obama seventy-six years later, bailed the bankers out at the expense of everyone else. Whereas Obama allowed the Federal Reserve to implement their quantitative easing programs, FDR in 1934 devalued the dollar from $20.67 to $35.00 an ounce of gold; an overnight 70% devaluation of the US dollar.
The sorry history of the US dollar from 1925 to today is on view in the following chart. The US Treasury gold reserves, in dollars (Red Plot) and paper dollars issued into circulation (CinC / Blue Plot) are plotted below.
Economists always claim that rising valuations in the financial markets are “economic growth.” No, it’s not. Bull markets on Wall Street are just as much inflationary events as is rising consumer price inflation. Whether the economy sees “growth” in asset valuations, or “inflation” in consumer prices depends on where the inflation seen below flows to – Wall Street or rent and food prices.
One thing is for sure; since 1925, monetary inflation flowing from the Federal Reserve System has been unrelenting.
© Mark Lundeen
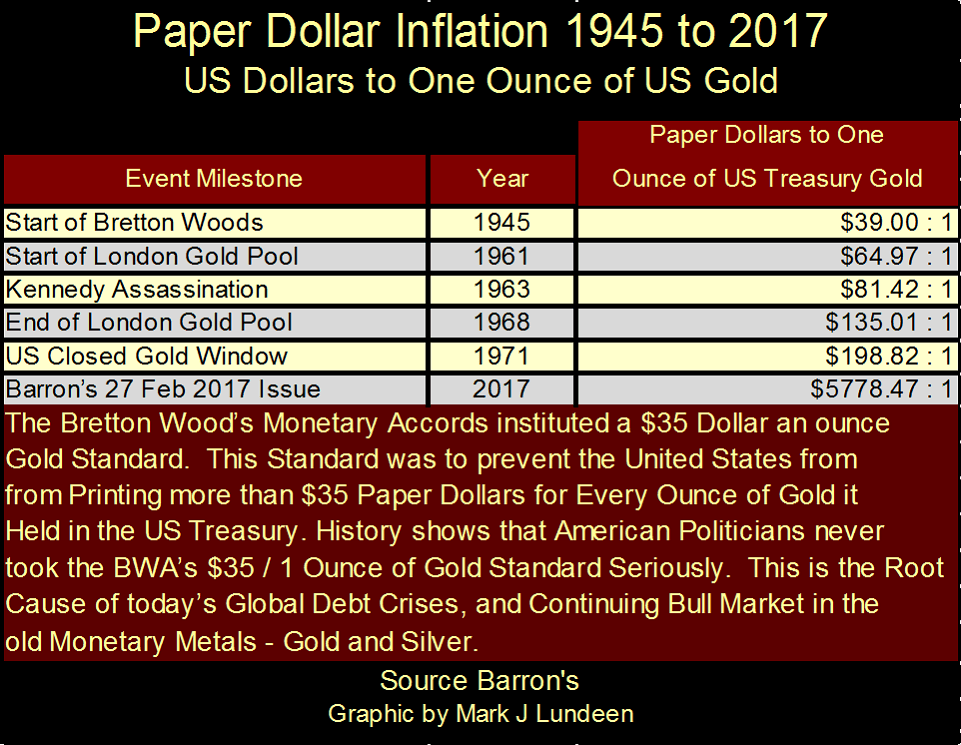
From 1945 to 1971, the US dollar was officially valued at 35 paper dollars / one ounce of gold held in the US Treasury’s gold reserves. In other words; by law, the US Treasury wasn’t to issue more than 35 paper dollars for each ounce of gold held in its reserves. But like contracts the Federal Government makes with the public, it finds keeping its own laws impossible. By the time President Nixon suspended the Bretton Woods’ $35 gold peg in 1971, the US Treasury had issued 198.82 paper dollars for each ounce of gold held in its gold reserve. See table below.
Currently, there are 5,778.47 paper dollars in circulation for each ounce of US Treasury gold.
© Mark Lundeen
Only a few old geezers from the Baby-Boom Generation still squawk about this today. In the days to come, I’d be surprised if the Millennials (those born from 1977 to 1995) don’t receive a personal, one on one lesson on inflationary “monetary policy” by Mr. Bear in the coming years.
—
DISCLAIMER: This article expresses my own ideas and opinions. Any information I have shared are from sources that I believe to be reliable and accurate. I did not receive any financial compensation in writing this post. I encourage any reader to do their own diligent research first before making any investment decisions.
Featured Image by Wagner T. Cassimiro “Aranha” via Flickr / CC BY 2.0


Temenos to Acquire Additiv to Boost AI Wealth Management
Temenos is acquiring Zurich fintech Additiv to strengthen its digital wealth management and expand AI-driven financial orchestration. Additiv’s platform connects...


EFPIA Warns Limited SPC Reform Could Weaken EU Pharma Competitiveness
EFPIA supports the EU Biotechnology Law and a 12-month SPC extension but warns the current proposal is too limited. A...


EU Approves €23B Italian Renewable Energy Plan to Boost Climate Goals
The European Commission approved Italy’s €23 billion aid scheme to boost renewable energy and meet 2030 climate goals. Supporting wind,...


Institutional Bitcoin Buying and LiquidChain Presale Signal Market Optimism
Institutional Bitcoin buying, like Strategy’s 1,550 BTC purchase, signals confidence, stabilizes prices, and may trigger bullish momentum. Meanwhile, infrastructure projects...


The German Biotech Industry Faces Funding Crunch Despite Market Stability
German biotech held steady in 2025 but faces ongoing financing pressures, according to EY-Parthenon and BIO Deutschland. Total capital fell...
 |
|
 |  |
 |
|
-

 Fintech1 week ago
Revolut Begins Controlled India Rollout Targeting Massive UPI Payments Market
-

 Crypto2 weeks ago
Crypto Market Mixed as Bitcoin and Ethereum Slip Amid Rising Volatility
-

 Biotech2 days ago
TG Therapeutics Advances Subcutaneous Briumvi With Strong Trial Results and Rising Sales Momentum
-

 Crypto1 week ago
Altcoins Show Mixed Performance as Bitcoin Weakens
You must be logged in to post a comment Login