Featured
Do years ending in seven have a negative effect on stock markets?
Are years ending in seven a curse for the stock markets? Well, the record is not good. Panics, crashes, and financial crises have been frequent.

Ok, maybe it is not fair to call years ending in seven a curse. But years ending in seven have had a checkered record. Since 1830, the Dow Jones Industrials (DJI) has recorded nine up years and nine down years ending in seven. Years ending in seven have the second worst year record for the DJI. The leader or, in this case, the biggest loser is years ending in three. Its record is nine up years and ten down years. As to the biggest winner, well, that honor goes to years ending in five with a record of sixteen up years vs. three down years.
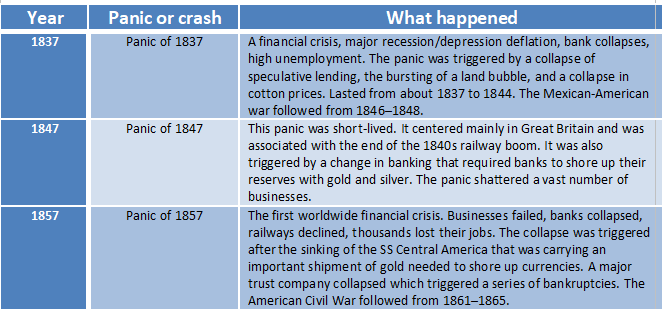
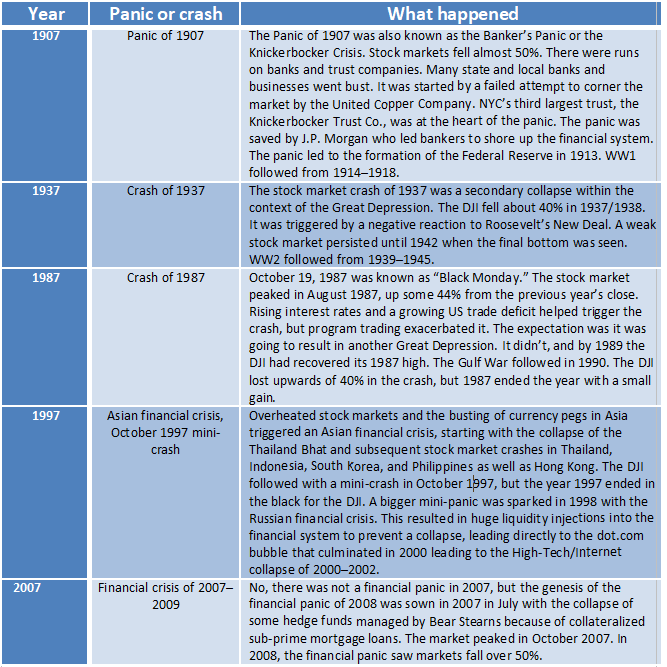
Years ending in seven are the leader in one category. They have the most losses totaling 20% or more. The total is four. 1857 saw the DJI lose 31%, in 1907 the DJI was down 37.7%, in 1917 the DJI dropped 21.7%, and finally, in 1937 the DJI fell 32.8%. Years ending in seven have also been, overwhelmingly, associated with stock market panics and crashes. Note the following:
© David Chapman
An interesting side note to the above panics dating from the 19th through to the 21st century was the famous tulip mania panic which ended in 1637 after four years of sharply rising tulip prices. There was also a panic in 1797 after the collapse of a land speculation bubble in 1796. Numerous merchant firms collapsed in both the US and Britain. Panics and crashes are words that could easily be associated with years ending in seven.
Gold too seems to respond to years ending in seven. While gold’s free trading history commenced only in the 1970s, it is interesting to note that of thirteen times gold saw gains of 20% or more in a year, three of them occurred in years ending in seven—1977, 1987, and 2007. And while gold has had only four years where it lost more than 20%, one of them naturally occurred in a year ending in seven—1997. Gold thus far in 2017 is up around 12%. Could gold see another 20% plus gain in 2017? Time will tell. So far, every year ending in seven since the 1970s has seen gold make a 20% or more move up or down.
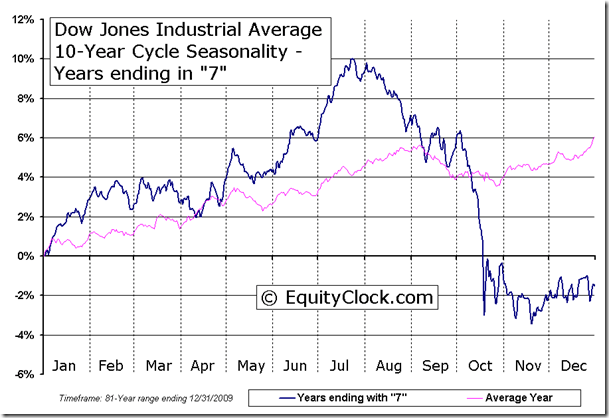
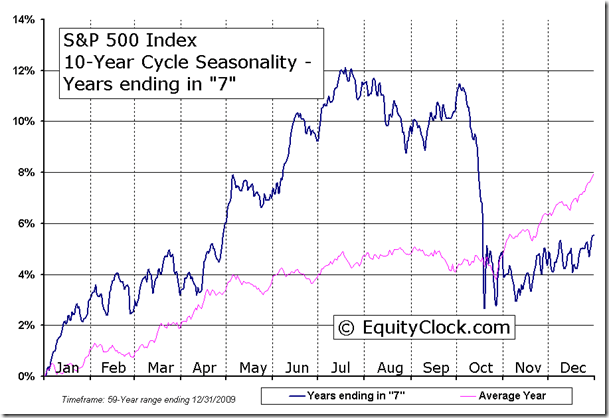
Given the years ending in seven and their propensity for panics and crises, it might not be a surprise that seasonality also plays a role. According to research carried out by Don Vialoux and Jon Vialoux of Equity Clock and Timing the Market the markets’ ten-year cycle seasonality for years ending in seven is quite negative. The two charts below draw this phenomenon quite nicely.
(Source)
(Source)
The pink line on both the DJI and S&P 500 chart is normal seasonality for an average year. Markets tend to rise in the early part of the year until May and then over the next four months the markets tend to be choppy (sell in May and go away?) August tends to see tops and the market sells off and is weak into October/November before regrouping and starting another rise into the first few months of the New Year. Remember, seasonality is an observation over a long period and there are years where it might not work.
But when the seasonality is applied to years ending in seven, things have a tendency to get “nasty” following the July/August top. It ends up being a free fall into the October/November period. Again, this is not an “every year ending in seven” occurrence. But there is strong tendency for the markets to react negatively in years ending in seven. Given our history of panics, crashes, and financial crisis in years ending in seven the seasonality of years ending in seven does not seem to be much of a surprise.
So here we are in a year ending in seven in August and we have two world leaders threatening to blow each other and the world to smithereens. Madmen we say? Time will tell. But if the tale of the tape is correct, expect a market sell-off that could take us into October/November before we find a low. The sell-off may already be underway.
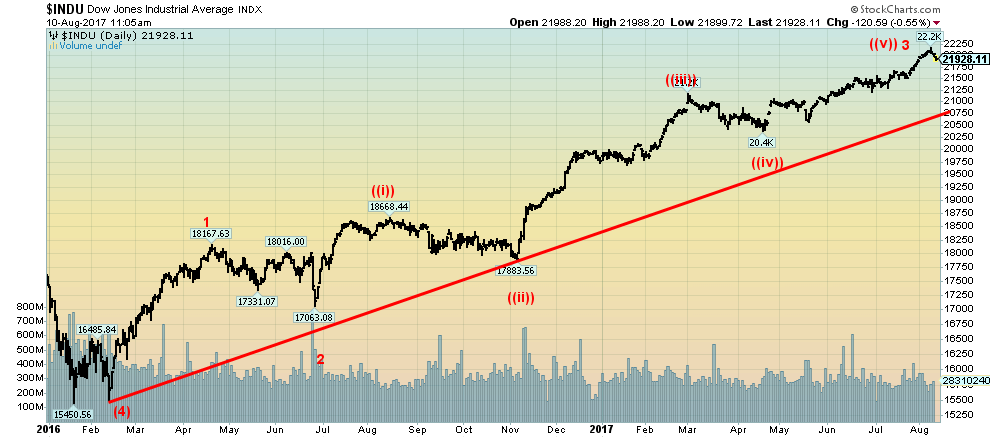
If our wave count is correct, this should only be a minor wave 4 up from the February 2016 low. The February 2016 low was, we believe, an intermediate wave (4) up from the major low of March 2009. Intermediate wave (2) was the 2011 EU crisis. If this is correct, then we know we are now in intermediate wave (5). Following a correction now for wave 4 we should then have one more run-up to new highs. That could be a blow-off top that carries us into the first quarter of 2018. But it could also be a feeble rise to a small new top or a double top scenario as we saw in 2007 following the initial breakdown in July of that year. We presume it would get underway with an easing of world tensions and the madmen not blowing each other (and us) to smithereens. Saner heads prevail (we hope). Once the fifth wave is complete, however, a major bear market could well get underway. But that is not expected until sometime in 2018.
(Source)
A normal correction now could take us down to at least 21,165 or the uptrend line from the February 2016 low currently near 20,750. A worst-case scenario could drop us to 19,525, the Fibonacci 61.8% retracement level of the move from the November 2016 low to the recent top. Something bigger would be in play if we took out the top of wave 1 at 18,167. But we doubt that at this time. It is, however, a consideration.
We also note that this is the first year of the Presidential cycle and the first year tends to be the weakest in the four-year Presidential cycle. Not helpful is the failure to see any major legislation since Trump took office in January, the looming US debt limit, budget and tax reform that also could prove difficult to pass given the record to date. Add in the ongoing conflict with North Korea that is grabbing the headlines and the markets could see a rough ride into the fall.
So, are years ending in seven a curse for the stock markets? Well, the record is not good. Panics, crashes, and financial crises have been frequent. The seasonality is negative, more negative than average seasonality. One might even say the market reaction is “the same as it ever was.”
—
DISCLAIMER: This article expresses my own ideas and opinions. Any information I have shared are from sources that I believe to be reliable and accurate. I did not receive any financial compensation in writing this post, nor do I own any shares in any company I’ve mentioned. I encourage any reader to do their own diligent research first before making any investment decisions.


Advances in Biomarkers and Targeted Therapies Transform Kidney Care in Autoimmune Disease
New biomarkers and targeted therapies are reshaping the management of kidney damage in autoimmune diseases like lupus and vasculitis. Experts...


Bitcoin Rises on Iran Deal as Crypto Markets React to AI and SpaceX News
Bitcoin rose above $65,000, gaining about 5% as a tentative Iran war agreement boosted markets. ETFs still show weekly outflows....


Rising Inflation, Fed Uncertainty, and Market Excess Amid War and SpaceX Mania
Rising inflation, driven by war, debt, and money growth, puts the Fed in a difficult position ahead of its meeting....


SpaceX IPO Sparks Déjà Vu as Market Risks Loom and Gold Bulls Stay Hopeful
The author compares the 2000 AOL Time Warner merger to SpaceX’s planned IPO, warning it may signal a market top....


The TopRanked.io Guide to 2026’s Biggest and Best Affiliate Opportunities
Want to earn affiliate commissions on literal billions of dollars worth of revenue? Then this week, we've got something special...
 |
|
 |  |
 |
|
-

 Crypto2 weeks ago
Cardano in Decline as Hoskinson Distances Himself Amid Growing Uncertainty
-
 Markets2 hours ago
Rising Inflation, Fed Uncertainty, and Market Excess Amid War and SpaceX Mania
-
 Markets1 week ago
Jobs Strength Triggers Market Reversal as Inflation and Rates Take Focus
-

 Markets2 weeks ago
Cotton Prices Decline Amid Improved Weather and Market Uncertainty
You must be logged in to post a comment Login