Featured
A Look at all the Recessions Since 1970: Three Hard Landings Stand Out
This past week saw a spectacular “rebound” “relief” rally. Could it turn into a summer rally? Just as the Fed with fear of rising interest rates has helped trigger the current market drop, thoughts of a recession turn the stock market more bullish on expectations down the road of lower interest rates and more QE even if it is a year away.

Recession seems to be on the tip of everyone’s tongue. We don’t have to predict a coming recession. Seems every well-known economist, executive, or billionaire is predicting the same. Robert Shiller (Nobel laureate, Yale University), Jamie Dimon (CEO JP Morgan Chase), Carl Icahn (billionaire financier), and David Rosenberg (economist) are amongst many we read predicting a recession. The World Bank has waded in, saying recession is unavoidable. As a trader, we could argue that the trade is getting crowded. Even Fed Chair Jerome Powell is now warning about a recession.
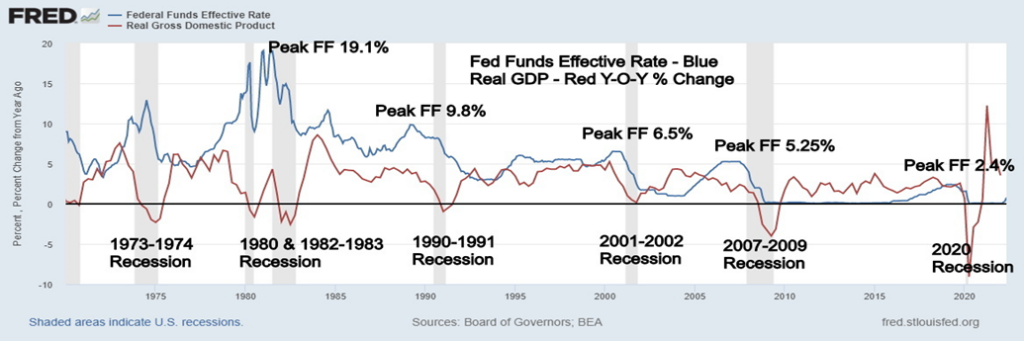
We have noted that every time inflation rose over 5% a recession usually followed. Every recession since 1970 has been preceded by Fed hiking interest rates. Note that every recession since then has seen Fed Funds peak at a lower level. Today Fed Funds are at 1.75% with expectations that the Fed will hike another 75 bp in July and another 50 bp in September. That would take Fed Funds to 3.00% higher than where it was before the short but steep pandemic recession in 2020. In technical terms, that is a breakout to the upside.
Add in the fact that quantitative tightening (QT) is also happening as the Fed drains the financial system of some of the largesse handed out after the March 2020 pandemic collapse. Famed technical investor and wealth management advisor Leon Tuey recently noted (June 17, 2022 – “Recession is on Everyone’s Mind”) that if the Fed raised interest rates three consecutive times it triggered Edson Gould’s “Three Jumps and a Tumble Rule.”(Edson Gould, influential stock forecaster, dubbed the Wizard of Wall Street; 1902–1987). The only place where you can be assured you won’t hear of predictions of a recession are from politicians. Why? Because that could set off a panic.
Well, we now qualify for three jumps as the Fed hiked 25 bp in March, 50 bp in May, and 75 bp in June. Add in the coming July and September rate hikes and that could trigger a big tumble. But one of our favorite indicators (and a favorite indicator for many others) of a narrowing yield spread has not yet occurred. The current 2-year U.S. treasury note less the 10-year U.S. treasury note spread is currently at +9 bp while the 3-month U.S. treasury bill less the 10-year U.S. treasury note spread is currently +151 bp. We need to see those two to turn negative to suggest that we are actually nearing a recession.
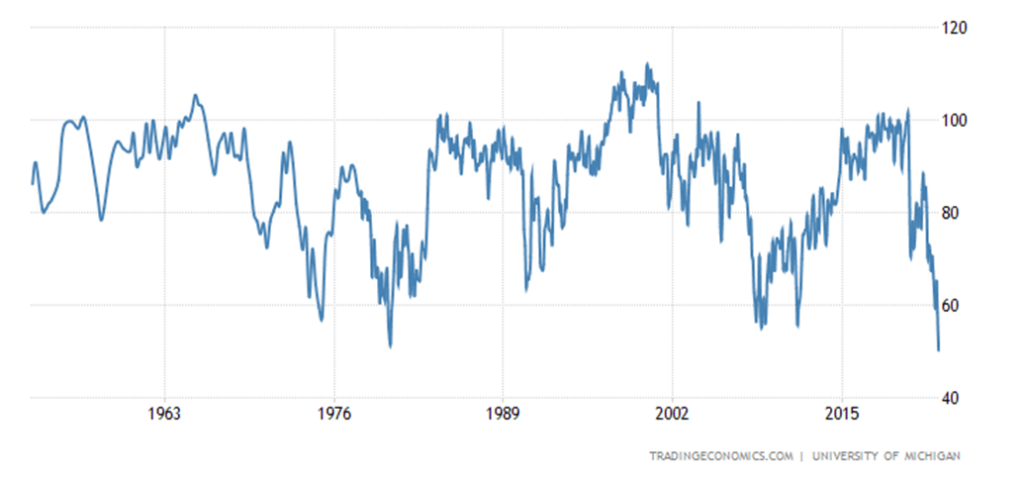
Consumers, however, have turned negative. The latest Michigan Consumer Sentiment Index came in at 50.2%, a record low. (See chart on the next page.) The market had expected a reading of 58. And we are not even officially in a recession yet. High gasoline prices are, no doubt, weighing on many as they are the most visible of inflationary signs. Now comes the attempt to bring down gasoline prices by cutting Federal taxes and encouraging states to do the same. Setting aside the fact that it won’t do that much for the price of gasoline at the pump, the real problem is high demand and little supply because of problems at refineries. Refinery capacity is down 5.4% since 2019. They are already at full capacity. The solution? Reduce demand or increase supply. The latter is difficult with full capacity. Have they examined the supply side? But that’ll require increased capacity at refineries or more refineries.
Jerome Powell himself acknowledges that, by hiking rates to combat inflation, employment could eventually take a hit. That inflation is a monetary phenomenon pushed by the explosive growth of money and debt since the Great Recession and that the most recent inflation is also a function of major supply disruptions due to the pandemic and helped by the lockdowns in China along with the war in Ukraine and sanctions on Russia. The Fed cannot do anything about the latter. And much of the debt is now being monetized by the increase in inflation.
But to get inflation back to 2% and unemployment rising to only 4.1% would, as Powell notes, still be a historical low for unemployment. The problem is, in the past, it has taken a lot more to push inflation down and the pain on the unemployment lines does get higher than 4.1%. The U.S. needs unemployment to be higher, say above 5%, to bring inflation down. Meanwhile, the Fed is targeting higher rates in both July and September. But will we see signs by that time that unemployment is rising?
U.S. Michigan Consumer Sentiment Index 1960–2022
It’s not as if talk of a recession is for the U.S. only. The EU is in worse shape. The EU is still barely recovering from the hit they took during the pandemic. What’s worse, the war in Ukraine is now starting to bite with sanctions on Russia and tit-for-tat cut-offs of Russian oil and gas that threaten to see Germany, in particular, fire up coal plants once again. Inflation at 8.8% is at its highest since the early 1980s. The EU’s trade deficits are becoming wider. Business and consumer confidence is sliding rapidly. Many see the EU as being closer to recession than the U.S.
The U.S. has been through eight recessions since 1970, roughly one every 6.5 years. On average, they have lasted eight months. Peak unemployment has averaged 9.1%, while GDP has fallen on average 4.3%. Our table on the next page shows official recessions as defined by the economists. We also note how steep GDP fell and where official unemployment (U3) peaked. We note as well the national debt at the outset of the recession and at the end of the recession. Two recessions were what we could term soft landings: 1969–1970 and 2001. The 1990–1991 recession was higher, but still only saw a decline of 1.4% for GDP. Steep recessions with 10% plus unemployment were seen in 1981–1982, 2007–2009, and 2020. Three recessions saw a decline in GDP in excess of 3%: 1973–1975, 2007–2009, and 2020. The biggest decline and the highest unemployment were the short but steep 2020 recession.
A recession now is the culmination of years of excessive money and debt growth, along with the whammy of supply disruptions and war and sanctions along with rising interest rates. With global debt over $300 trillion, more than double what it was during the Great Recession, the fallout of debt collapse could be brutal. We could be faced with a sovereign debt crisis led by Russia and Ukraine. But parts of the EU, parts of Asia (Sri-Lanka), and Africa are also facing debt collapse. Corporations are also shaky with 57% of U.S. corporations rated BBB, one level above junk. An AAA rating is as rare as the dodo bird. With rising interest rates, housing
bubbles are about to burst. The most vulnerable to bursting are where the biggest bubbles have been—the top five being New Zealand, Czech Republic, Hungary, Australia, and Canada. All face potential drops of 20% or more.
U.S. Recessions 1970–2022
| Recession | Period range | Duration (months) | Time since previous recession (months) | Peak unemployment | GDP decline, peak to trough | National debt, start of period ($billions) | National debt, end of period ($billions) |
| Recession 1969–1970 | Dec 1969–Nov 1970 | 11 mths. | 8 yrs., 10 mths. | 6.1% Dec 1970 | -0.6% | $368.2 | $389.2 +5.7% |
| Recession 1973–1975 | Nov 1973–Mar 1975 | 1 yr., 4 mths. | 3 yrs. | 9.0% May 1975 | -3.2% | $460.6 | $509.7 +10.7% |
| Recession 1980 | Jan 1980–Jul 1980 | 6 mths. | 4 yrs., 10 mths. | 7.8% July 1980 | -2.2% | $845.1 | $907.7 +7.4% |
| Recession 1981–1982 | Jul 1981–Nov 1982 | 1 yr., 4 mths. | 1 yr. | 10.8% Nov 1982 | -2.7% | $971.2 | $1,197.1 +23.3% |
| Recession early 1990s | Jul 1990–Mar 1991 | 8 mths. | 7 yrs., 8 mths. | 7.8% Jun 1992 | -1.4% | $3,143.8 | $3,465.2 +10.2% |
| Recession early 2000s | Mar 2001–Nov 2001 | 8 mths. | 10 yrs. | 6.3% Jun 2003 | -0.3 | $5,773.7 | $5,943.4 +2.9% |
| Great Recession | Dec 2007–Jun 2009 | 1 yr., 6 mths. | 6 yrs., 1 mth. | 10.0% Oct 2009 | -5.1% | $9,229.2 | $11,545.3 +25.1% |
| Pandemic Recession | Feb 2020–Apr 2020 | 2 mths. | 10 yrs., 8 mths. | 14.7% Apr 2020 | -19.2% | $23,201.4 | $26,477.2 +14.1% |
Note: Increase in S&P 500 since Dec 1969 to April 2020 – 3,063%
Increase in Gold since Dec 1969 to April 2020 – 4,741%
Increase in National Debt Dec 1969 to April 2020 – 7,090%
Increase in GDP Dec 1969 to April 2020 – 1,776% = Almost $4 of debt for every $1 of GDP.
Another recession now, or more likely into 2023, could prove to be quite destabilizing. After all, what the previous recessions have shown is that lowering interest rates to zero and flooding the financial system with bundles of money (or helicopter money, as some call it) only works for so long. But it sets off bubbles—stocks, housing, everything as it did after the massive increase in money and debt following the Great Recession.
Numerous sentiment indicators are registering fear to extreme fear. Last week the CNN Money “Fear and Greed Index” fell to 11. Today it has jumped back to 28 only at the fear level, thanks to a big up day in the stock markets. But anyone believing the current stock market decline is over should think again. A final bottom will be seen when no one wants to own stocks. We may be primed for a relief rally, something we have noted before. Eventually, we believe that the stock market will decline 50% plus from the highs of January 2022 before a final bottom is seen. The bond market remains dubious. With inflation at 8% and the 10-year U.S. treasury note just over 3%, the negative spread is still too high. The risk of defaults in the bond market are growing as the higher rates rise (prices fall as they move inversely to rates).
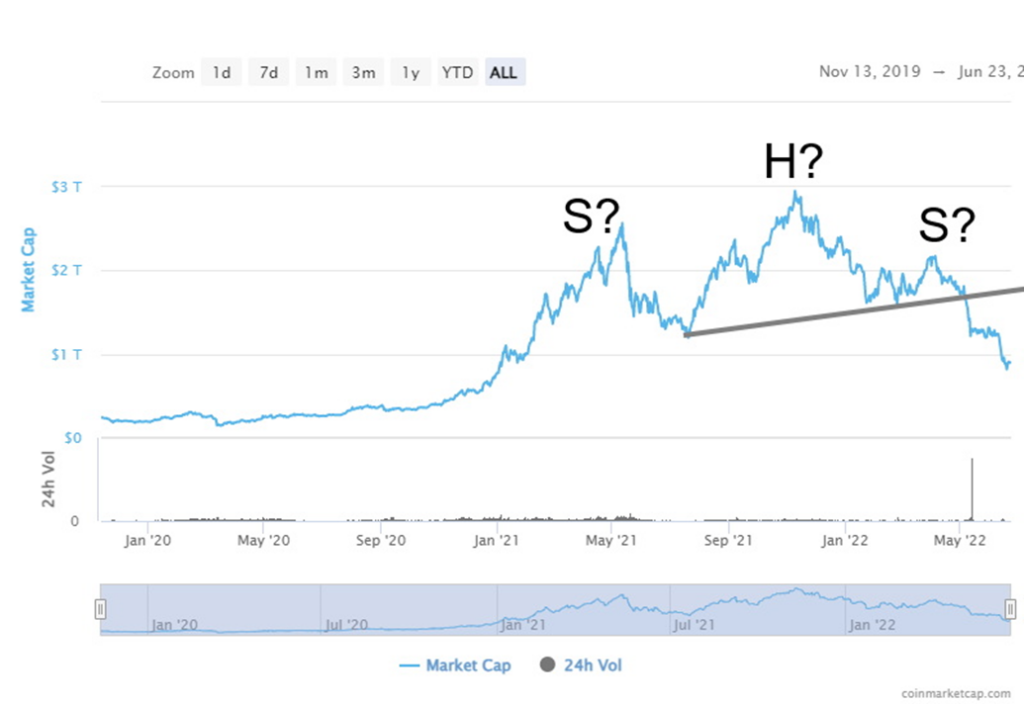
Other markets potentially have more downside. The crypto market has crashed. Indeed, as our chart below shows, it is downright scary. The chart of the market cap of the cryptos shows what appears as a huge head and shoulders top pattern. The breakdown projects that cryptos could fall to zero. While that is unlikely, it does suggest that cryptos could fall further, even if a relief rally develops. The same could hold true for meme stocks, SPACs (special purpose acquisition companies), and NFTs (non-fungible tokens), many of which are already down 25% to 75%. In March 2021 an NFT titled Everydays – the First 5000 Days sold for $69 million at Christies. All bubbles eventually burst (see Tulipomania 1634–1637, DJI 1923–1929, NASDAQ 1994–2000). We have been witnessed the bubble of all bubbles over the past decade. Everything reverts to its long-term mean, which suggests that the S&P 500 has a long way to go to reach its final low.
Market Cap of Crypto Market 2020–2022
They are now running out of bullets. U.S. national debt, already the highest in the world at $30.5 trillion, can only be expanded for so long. Money supply M1 is over $20 trillion and all debt in the U.S. exceeds $90 trillion 30% of all global debt. As long as the U.S. dollar remains the world’s reserve currency, the U.S. can maintain some control over the rising debt. Rising inflation helps monetize the U.S. national debt. But U.S. dollar hegemony is under attack, particularly now from China and Russia as they work with the BRICS to create an alternative to the U.S. dollar. Currency wars lead to economic wars lead to real wars. That has been shown historically and today is no different.
Chart of the Week
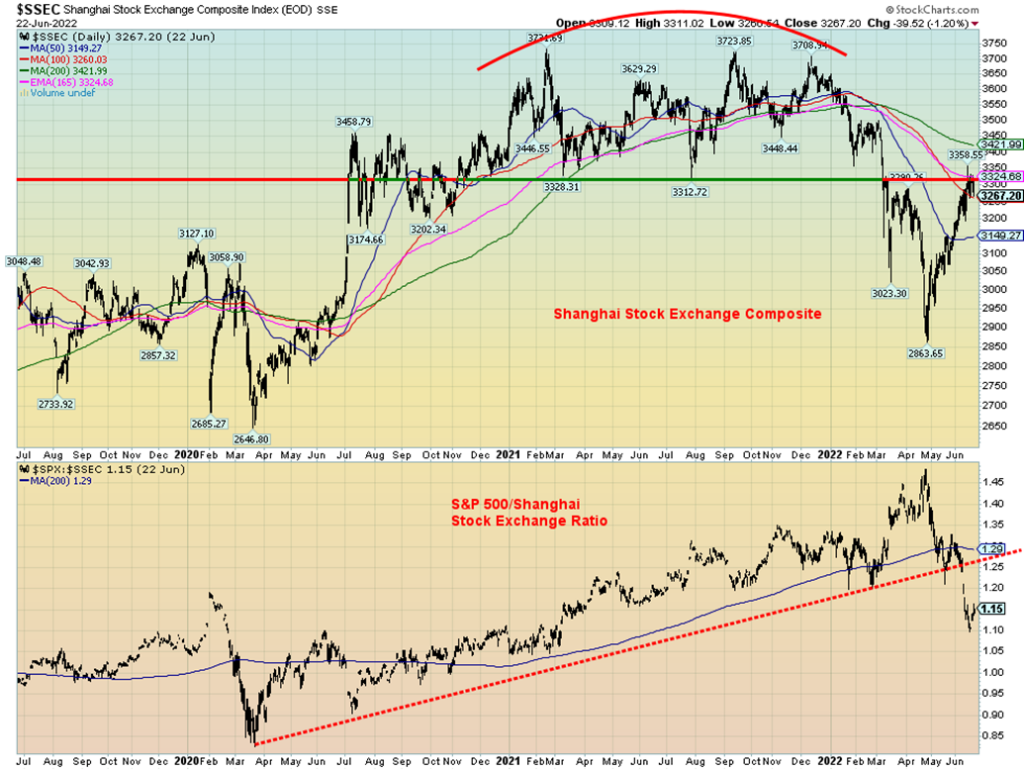
China’s Shanghai Stock Exchange Index (SSEC) has been one of the better-performing markets of late. The SSEC is up already some 16% from the April low. In the same time frame, the S&P 500 is down about 8%. The result is the SPX/SSEC ratio has fallen sharply recently, breaking an uptrend line from the March 2020 low and falling
below the 200-day MA. Expect this relationship to change. With the S&P 500 showing signs of recovering and starting a rebound/relief rally, the expectation is, at least over the next month or two, the S&P 500 could outperform the SSEC. This is not to suggest that the SSEC is about to fall, but it is now clearly running into a band of resistance that stretches from current levels near 3,300 up to 3,400. The SSEC has performed despite the lockdowns. But it was most likely anticipation of removal of the lockdowns that helped spark the SSEC to the upside. With lockdowns easing the reasons to be long, the SSEC will hinge more on China’s performance going forward.
Canada Inflation 1920–2022
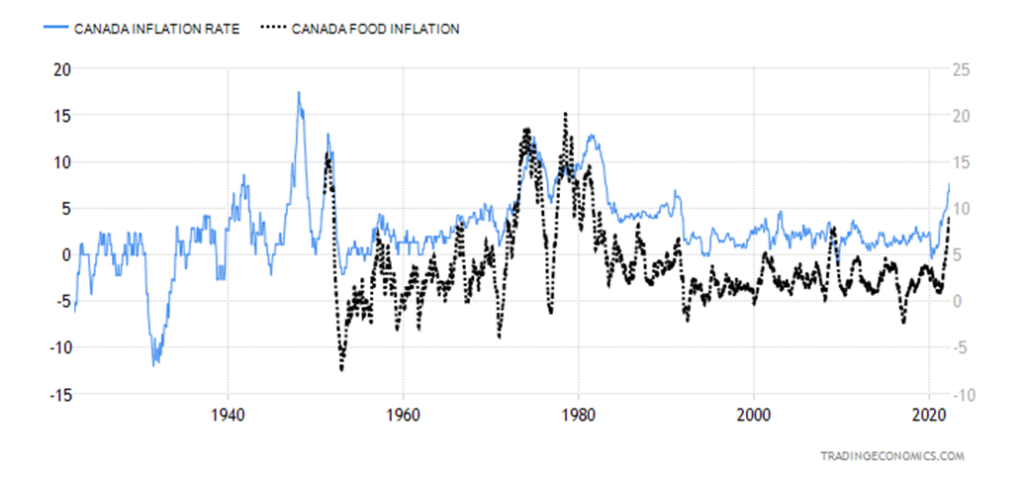
Canada’s inflation leaped to 7.7% in May 2022 above the expected gain of 7.3%. It is the highest recorded inflation since January 1983. Driving inflation higher were transportation (+14.6% – includes 48% rise in gasoline prices), food (+8.8% includes 9.7% increase for groceries), and shelter (7.4% as mortgage rates rise). The core inflation rate excluding food and energy rose 6.1% vs. a forecast of 5.9%. Goods are rising mostly due to supply disruptions. Note the spike in inflation in the 1940s. That was due to the post-war surge in demand. The biggest decline was seen during the Great Depression.
Markets & Trends
| % Gains (Losses) Trends | ||||||||
| Close Dec 31/21 | Close Jun 24/22 | Week | YTD | Daily (Short Term) | Weekly (Intermediate) | Monthly (Long Term) | ||
| Stock Market Indices | ||||||||
| S&P 500 | 4,766.18 | 3,911.74 | 6.5% | (17.9)% | down | down | neutral | |
| Dow Jones Industrials | 36,333.30 | 31,500.68 | 5.4% | (13.3)% | down | down | neutral | |
| Dow Jones Transports | 16,478.26 | 13,540.30 | 5.2% | (17.8)% | down | down | up (weak) | |
| NASDAQ | 15,644.97 | 11,607.62 | 7.5% | (25.8)% | down (weak) | down | neutral | |
| S&P/TSX Composite | 21,222.84 | 19,062.91 (new lows) | 0.7% | (10.2)% | down | down | up | |
| S&P/TSX Venture (CDNX) | 939.18 | 647.33 (new lows) | 1.1% | (31.1)% | down | down | down (weak) | |
| S&P 600 | 1,401.71 | 1,152.32 | 5.2% | (17.8)% | down | down | neutral | |
| MSCI World Index | 2,354.17 | 1,872.55 (new lows) | (0.6)% | (20.4)% | down | down | down (weak) | |
| NYSE Bitcoin Index | 47,907.71 | 21,147.15 | 3.4% | (55.9)% | down | down | neutral | |
| Gold Mining Stock Indices | ||||||||
| Gold Bugs Index (HUI) | 258.87 | 238.02 | (1.5)% | (8.1)% | down | down | neutral | |
| TSX Gold Index (TGD) | 292.16 | 280.56 | (2.7)% | (4.0)% | down | down | neutral | |
| Fixed Income Yields/Spreads | ||||||||
| U.S. 10-Year Treasury Bond yield | 1.52% | 3.14% | (2.8)% | 106.6% | ||||
| Cdn. 10-Year Bond CGB yield | 1.43% | 3.33% | (2.4)% | 132.9% | ||||
| Recession Watch Spreads | ||||||||
| U.S. 2-year 10-year Treasury spread | 0.79% | 0.08% | 33.3% | (90.0)% | ||||
| Cdn 2-year 10-year CGB spread | 0.48% | 0.20% | 42.9% | (58.3)% | ||||
| Currencies | ||||||||
| US$ Index | 95.59 | 103.96 | (0.5)% | 8.8% | up | up | up | |
| Canadian $ | .7905 | 0.7740 | 0.8% | (2.1)% | down | down | neutral | |
| Euro | 113.74 | 105.55 | 0.5% | (7.2)% | neutral | down | down | |
| Swiss Franc | 109.77 | 104.33 | 1.2% | (5.0)% | up | down | down | |
| British Pound | 135.45 | 122.80 | 0.5% | (9.3)% | down | down | down | |
| Japanese Yen | 86.85 | 73.97 (new lows) | (0.2)% | (14.8)% | down | down | down | |
| Precious Metals | ||||||||
| Gold | 1,828.60 | 1,830.30 | (0.6)% | 0.1% | neutral | neutral | up | |
| Silver | 23.35 | 21.13 | (2.1)% | (9.5)% | down | down | neutral | |
| Platinum | 966.20 | 903.70 | (2.9)% | (6.5)% | down | down | neutral | |
| Base Metals | ||||||||
| Palladium | 1,912.10 | 1,854.30 | 3.1% | (3.0)% | down | down | down (weak) | |
| Copper | 4.46 | 3.74 (new lows) | (6.7)% | (16.2)% | down | down | up (weak) | |
| Energy | ||||||||
| WTI Oil | 75.21 | 107.62 | (0.3)% | 43.1% | down | up | up | |
| Nat Gas | 3.73 | 6.28 | (9.5)% | 68..4% | down | up (weak) | up | |
New highs/lows refer to new 52-week highs/lows and, in some cases, all-time highs.
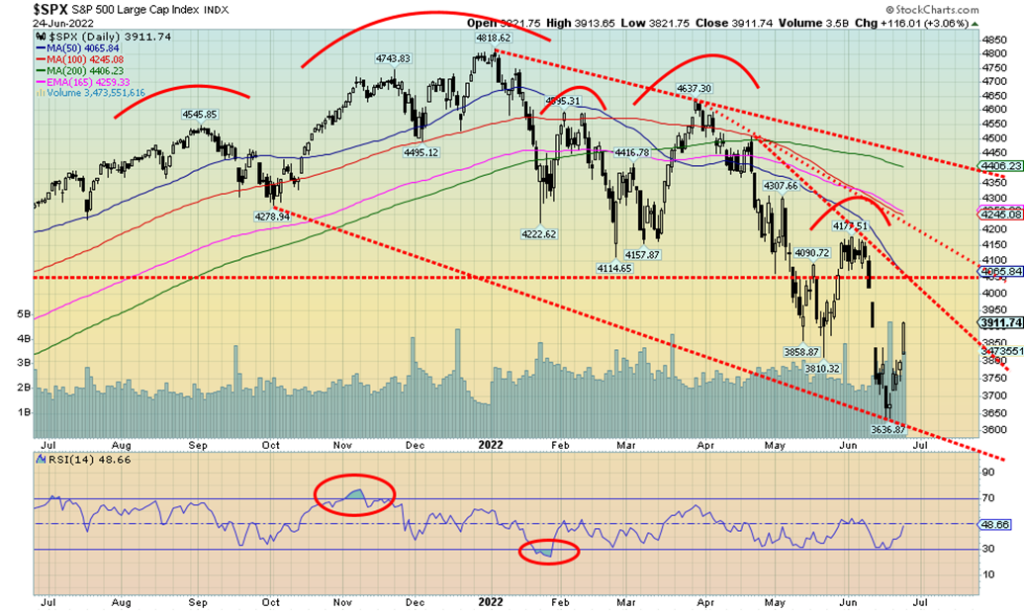
If the previous two weeks were the weeks from hell, this past week was the week from heaven as markets rebounded. Seems perverse, but then stock markets tend to forecast ahead. The markets were falling because of fear of higher interest rates. Now they are rallying because, while higher interest rates are still being forecast, the talk everywhere is of recession. A recession means that the Fed might lower interest rates and bring back quantitative easing (QE). This is odd, considering that QT is now what the Fed is doing. The gains this past week were superb. The S&P 500 was up 6.5%, the Dow Jones Industrials (DJI) was up 5.4%, the Dow Jones Transportations was +5.2%, and the NASDAQ gained 7.5%. The S&P 600 small-cap was up 5.2%. Nobody made fresh 52-week lows. Okay, Berkshire Hathaway did, but then BRK. A finished the week up 3.5%. But nearly everybody now made their lows last week June 17. Friday’s move this week was the icing on the cake. Okay, not much of a cake yet. The S&P 500 could be forming a descending wedge triangle. A burst above 4,050 could suggest a move then to 4,600 and the April high. A normal 50% retracement of the decline could take the S&P 500 to 4,225 while a Fibonacci 61.8% retracement would take it to 4,365. So, regaining 4,600 would help suggest that maybe new highs are possible?
In Canada, the TSX Composite, dragged down by Energy and the Material stocks, could muster only a 0.7% gain. The TSX Venture Exchange (CDNX) was up 1.1%. However, before rebounding both Canadian indices made fresh 52-week lows. In the EU, the London FTSE was up 2.8% and the Paris CAC 40 was up 3.2% but the German DAX, weighed down by energy concerns, fell 0.1%. In Asia, China’s Shanghai Index (SSEC) was up 1.0% while the Tokyo Nikkei Dow (TKN) gained 2.0%. The MSCI World Index lost 0.6% after falling to fresh 52-week
lows. Bitcoin recovered a bit, up 3.4%, but like everything else the cryptos look oversold and due for at least a bounce. As we noted earlier, we believe they have a lot further to fall.
Fear was in the air as the previous week’s CNN Fear and Greed Index fell to 11—extreme fear. It closed Friday at 28—just fear. Other indicators have been diverging or have hit extremes usually associated with lows. We believe we are on the cusp of a tradeable summer rally. For investors, it may be more of a time to restructure.
As we have noted, we are away next weekend so will not be putting out a report. The following week is the July 4 holiday which bookends the weekend with Canada’s July 1 holiday. So, expect subdued trading into the holiday weekend. Trading in July doesn’t usually pick up again until past July 6. That means we might also see some consolidation in the market after this week’s sharp gains. But then we’d also see no new lows.
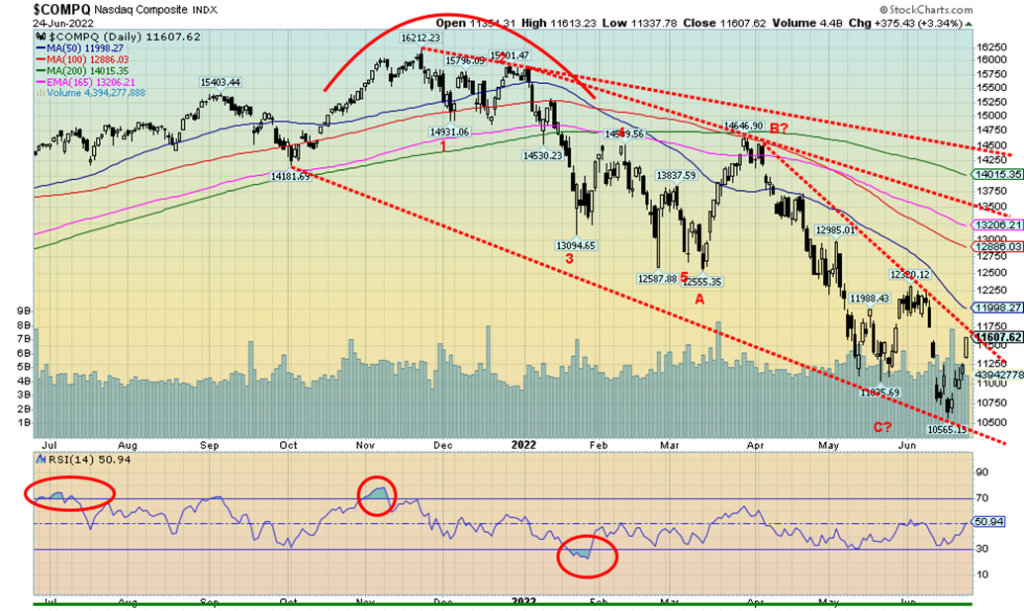
The NASDAQ along with the other indices enjoyed a strong up week, suggesting that we may have hit a temporary bottom. The NASDAQ gained 7.5% on the week. The NASDAQ now sits just below a breakout of what might be a descending wedge triangle. If the wedge triangle is correct, a firm breakout above 11,725 could project the NASDAQ to rise to 14,600 and the late March high. That would be just above the 200-day MA, currently at 14,015. The FAANGs enjoyed a good week with Meta up 3.9% after hitting fresh 52-week lows, Apple gaining 7.7%, Amazon up 9.6%, Netflix jumping 8.7%, Google +9.9%, Microsoft +8.1%, Tesla +13.4%, Twitter +4.3%, Baidu +8.2%, Alibaba +15.0%, and Nvidia +7.9%. Still Meta, Netflix, and Nvidia all
remain in super bear territory, down well over 40% in 2022. Strong bounce, but will it have any legs or just peter out like so many of these sudden up moves? If the summer rebound is correct, then we’ll bust above that descending wedge and head for 14,600. If we fail and fall back under 11,000, new lows could lie ahead.
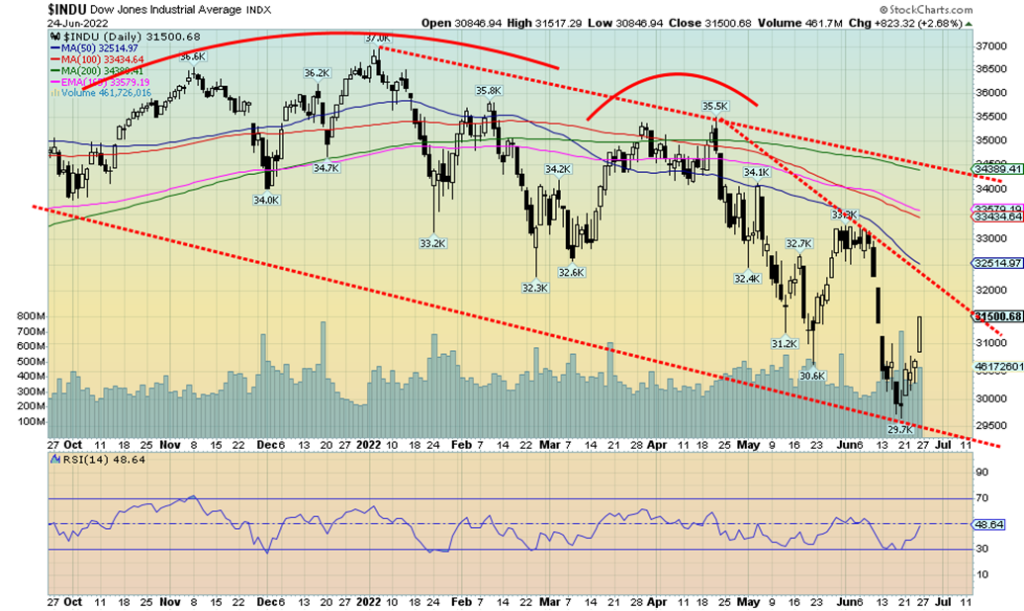
The 823-point gain for the DJI on Friday pushed it into the top 20 gains ever at number 17. However, the almost 3% gain on the day doesn’t even register for the top 20 percentage gains on a day. However, as with the other indices, there is a chance here that we have seen at least a temporary bottom and that we might embark on summer rally that carries us into July/August. The key area the DJI needs to regain is above 32,500. If the DJI can do that it gives credence to the summer rally and retracing upwards of half the decline is possible. That point is at 33,302. Even better would be a two-thirds retracement taking us to about 34,200. That would be just below that downtrend line from the January top. The line represents the 200-day MA, currently at 34,390. A real outside shot would be to retrace just above the April high of 35,490, but we can’t tell that yet. We believe we are poised for a summer rebound, but to do so we must not go back down and take out 31,000. If that happens, new lows lie ahead.
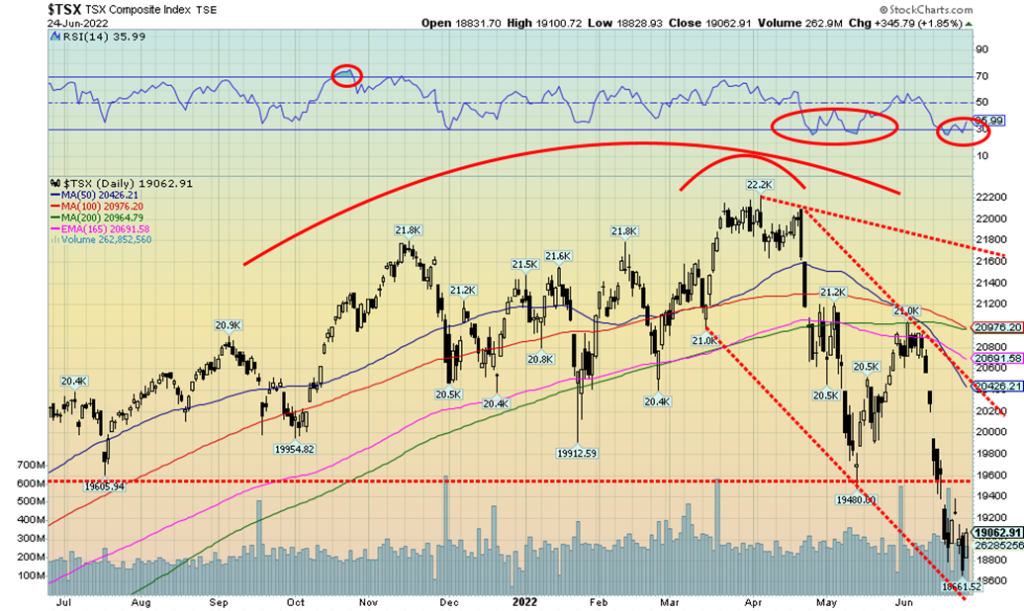
The TSX fell precipitously into what we believe might at least be a temporary low. We appeared to have fallen to a bottom of a channel. The TSX fell to 52-week lows this past week but, in the end, managed to eke out a gain of 0.7%, thanks to the 1.9% gain on Friday. The TSX Venture Exchange (CDNX) did the same, hitting fresh 52-week lows, then rebounded on Friday, gaining 1.1% on the week. The TSX recorded oversold levels with the RSI under 30 this past week and we now appear to be rebounding from those levels. Leading the way down this past week was Energy (TEN) which dropped 4.6%. Financials (TFS), which are the largest component of the TSX (Energy is the second-largest), lost 0.7% this past week. With those two down they were a drag on the index, offsetting the 10.4% gain for Information Technology (TKK) and the 10.4% gain for Health Care (THC). Five of the sub-indices were down on the week. The other three were Golds (TGD) down 2.7%, Metals & Mining (TGM) off 3.8%, and Materials (TMT) down 4.2%. Good gains were seen in Telecommunications (TTS) up 4.2%, Consumer Discretionary (TCD) +3.9%, Consumer Staples (TCS) +3.2%, Industrials (TIN) +3.9%, and Utilities (TUT) +2.9%.
As we noted, the TSX fell to what appears to be the bottom of a channel. Regaining 19,600 would be positive but above 20,000 we would feel even better. However, the TSX needs to regain back above 20,400 to suggest that it could be breaking out to the upside. We think the TSX has completed an ABC pattern down from the March highs. That would complete the A wave of a higher degree. Could this be the start of the B wave of a higher degree? Only breaking out over 20,400 would confirm that we are on our way up to form the B wave. The B wave should retrace above that last high at 21,000 as well. Support appears to be good, down to 18,600.
10-year Treasury Bond/Canadian 10-year Government Bond (CGB)
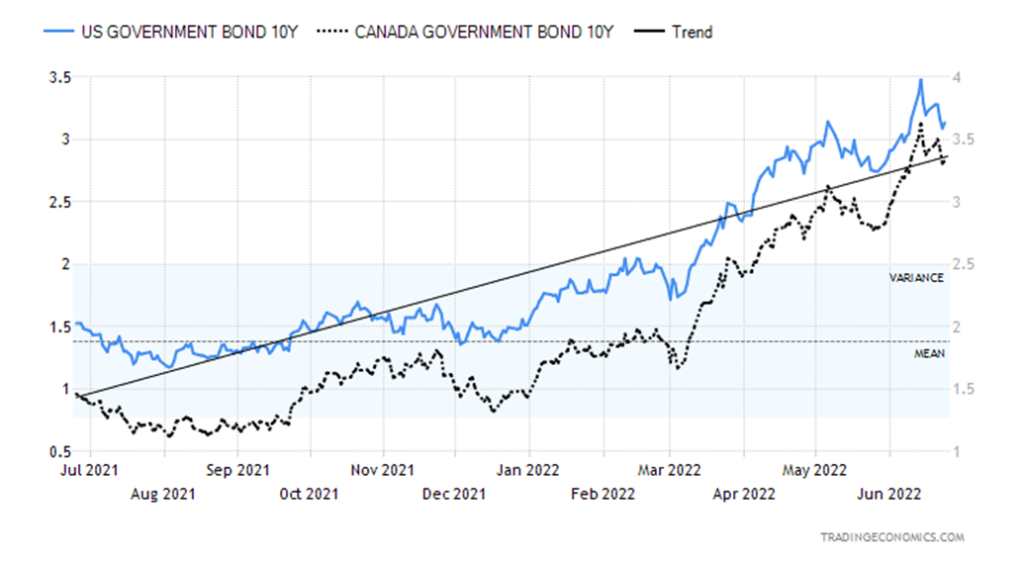
Thoughts of recession helped lower bond yields this past week. A drop below 3% for the U.S. 10-year treasury note would convince us that a probable (if temporary) high was in. The 10-year fell to 3.14% this past week from 3.23% the previous week. The Canadian 10-year Government of Canada bond (CGB) also fell to 3.33% from 3.41%. Despite the drop in the bond yields (prices that move inversely to yields rose), the 2–10 spread in the U.S. widened slightly to 8 bp from 6 bp. It did the same in Canada as it rose to 20 bp from 14 bp. Since the 2–10 spreads have not as yet turned negative we cannot predict, despite all the talk, that a recession is imminent.
Probably the worst number out this past week was the Michigan Consumer Sentiment Index that fell to 50 below the previous 58.4 but largely on consensus. If the consumer is losing confidence, that potentially spells trouble for retail sales, the housing market, and more. Still, new home sales remain strong, up 10.75% in May which beat the consensus of a decline of 1% and last month’s decline of 12%. Existing home sales were also slightly stronger than the consensus, coming in down 3.4% vs. an expectation of a 5% decline. Jobless claims rose again this time to 223,500, up from 219,000 the previous week and above the consensus 215,000. The PMI (manufacturing) flash was 52.4 vs. 57 and below the consensus 56. Below 50 the economy is flashing recession. The Fed expressed concerns about an impending inflation, but that also depended on which governor was speaking. Powell was more circumspect, recognizing that high interest rates triggered by the Fed could spark a recession.
This coming week we get durable goods, expectation of a 0.3% decline, pending home sales expected to fall 4.5% following a 3.9% decline the previous month, the Case-Shiller home price, plus the Richmond and Dallas manufacturing indices. The Q1 final GDP is out as well with it expected to remain at negative 1.5%. Watch for the PCE price index for Q1 as well, with an expectation of 7%. Personal Income and spending are out on Thursday. Watch the Chicago PMI on Thursday as well, expecting a reading of 59.1. The ISM manufacturing numbers are out on Friday (https://tradingeconomics.com/calendar).
Recession talk is in the air, but the 10-year note only suggests to us that a top might be in if we fall back below 3%. Otherwise, the risk remains to higher yields.
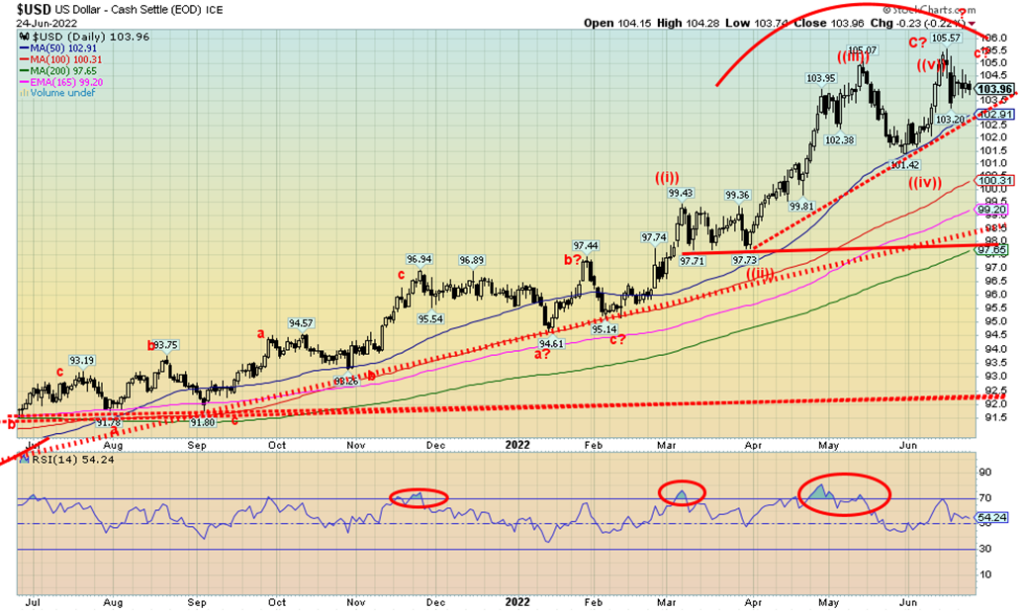
The US$ Index backed off slightly this past week, falling 0.5%. Fears that a recession might set in as the Fed hikes interest rates helped weaken the US$ Index. Other currencies rose against the US$. The euro was up 0.5%, the Swiss franc continues to be an EU safe haven, gaining 1.2%, the pound sterling was up 0.5%, but the Japanese yen continued its woes, losing about 0.2% to once again fresh 52-week lows. The yen is being driven lower by the actions of the BOJ who is keeping a lid on the main bank rate and keeping interest rates low by an aggressive $81 billion bond purchase this past week. The Japanese 10-year government bond (JGBs) that had spiked to 0.35% fell abruptly back to 0.21%. The Canadian dollar was up 0.8% on the week. The US$ Index made a slightly higher high at 105.57 above the 105.07 seen in April. That doesn’t quite qualify as a double top, but we now should watch 103 support. If that breaks, then the US$ index could fall to 100. A breakdown under
the recent low of 101.42 could, in theory, then project down to 97.25. We’re not holding our hopes on that unless we see evidence. But below 101.42 a top would be confirmed. However, as long as the US$ Index can hold above 103, then the odds shift once again to the upside and we could see new highs. A pattern we are familiar with is what we call three thrusts to a high. In the pattern we have a high, then a pullback, followed by a higher high, then another pullback, but the previous low holds and then we thrust once again to another higher high. Could this be the developing pattern? A break of 103 would end thoughts of another higher high thrust.
Are Russia and China along with the other BRICS countries (Brazil, India, South Africa) brewing up a new reserve currency? That’s the gist of stories we read this week that they were indeed looking at creating their own reserve currency from a basket of currencies of the BRICS. This past week there was a BRICS forum held via video link centered in Beijing. The new reserve currency would also challenge the IMF’s SDR. There is no doubt the use of the U.S. dollar globally is waning. As well the U.S. dominates the IMF. The idea behind this is to break U.S. dollar hegemony. It would allow the BRICS to build their own sphere of influence outside the U.S. dollar. The Russian ruble has been sanctioned to death and Russian banks banned from SWIFT. This makes the creation of an alternative all the more urgent because others fear it could happen to them if the U.S. is peeved at them for some reason or other. SDRs, on the other hand, are led by the U.S. dollar but also include the euro, the pound sterling, the Japanese yen and more recently the Chinese yuan. A new currency could attract reserves from other disaffected countries with the U.S. especially those in South Asia, Africa and the Mid-East. Bizarrely the Russian ruble despite sanctions has become the strongest currency in 2022. It’s a spit in the eye of U.S. sanctions.
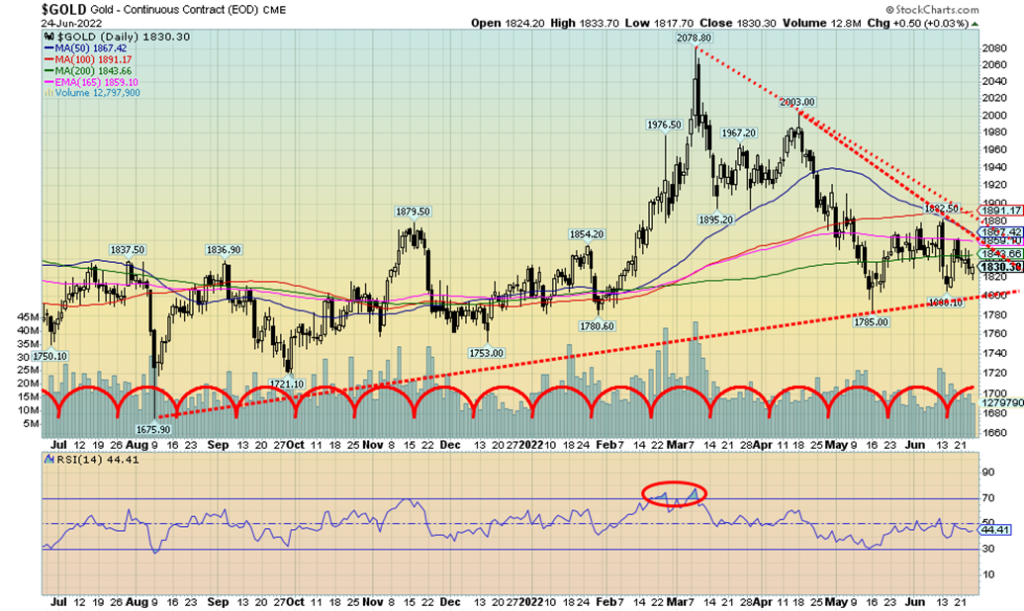
Fear of rising Fed rates continues, coupled with a still strong US$ Index. Ongoing talks of a recession helped gold recover on Friday as it closed up 50 cents. One thing is the range for gold is getting tighter and that weighs in its favor as the slightly higher lows hint that the move should be to the upside. But one cannot eliminate the downside. $1,800 looms as key support and a break to new lows below $1,785 would trigger further declines towards the December low of $1,753 and even the August low of $1,675. Gold does break out first over $1,860 and then over $1,890. Still, we’d continue to use $1,900/$1,920 as the key area to break out over to confirm the low. Otherwise, the risk remains to the downside with $1,800 being key.
This past week gold fell 0.6%, silver was down 2.1%, and platinum dropped 2.9% but palladium gained 3.1%. Copper had a terrible week on fear of recession as it fell 6.7% to fresh 52-week lows. The gold stock indices didn’t fare as well as the Gold Bugs Index (HUI) dropped 1.5% while the TSX Gold Index (TGD) was off 2.7%. The good news for gold is it remains up on the year by 0.1%.
Gold bullion may be considered an inflation hedge, but higher interest rates make it more expensive to hold it. Where the opposite takes hold is recognizing that the aggressive Fed hikes could spark a hard landing recession, which would be positive for gold. If that perception takes hold, then gold will rise. Or if gold becomes a haven as confidence is lost in the government. The ongoing January 6 hearings may help in that respect as does the reversal of Roe vs. Wade by the U.S. Supreme Court. Confidence is being lost in Supreme Court because of it. This may actually be positive for gold.
Fears that gold could rise because of a recession are preventing gold from falling right now. There was a small divergence this week as silver fell below its June 14 low of $20.84 but gold held above its June 14 low of $1,806. It is possible that the May low of $1,785 is now a key low and we’ll get a rise from here. We just need to plough through the resistance above.
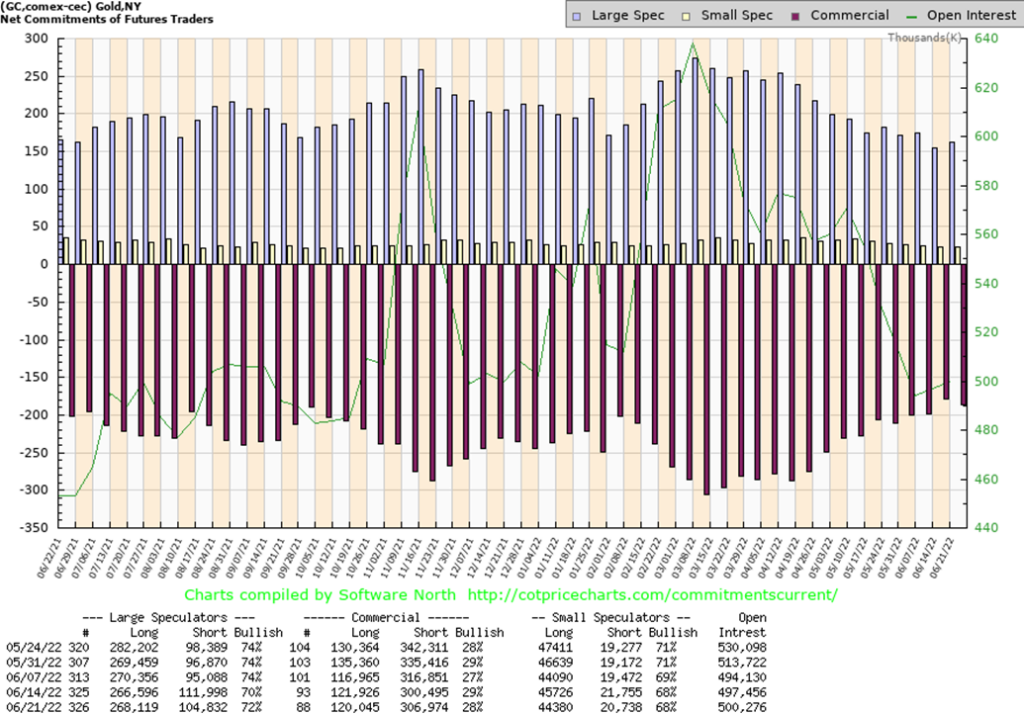
The gold commercial COT (bullion companies, banks) slipped slightly this past week to 28% from 29%. Long open interest fell close to 2,000 contracts while short open interest rose over 6,000 contracts. The large speculators COT (hedge funds, managed futures, etc.) rose to 72% from 70% as they added about 2,000 longs while shedding upwards of 7,000 shorts. Total open interest rose about 3,000 contracts. This is an odd response to what was a down week, although it doesn’t include the last two days of this past week. The COT is still okay, but it’s disappointing it slipped back.
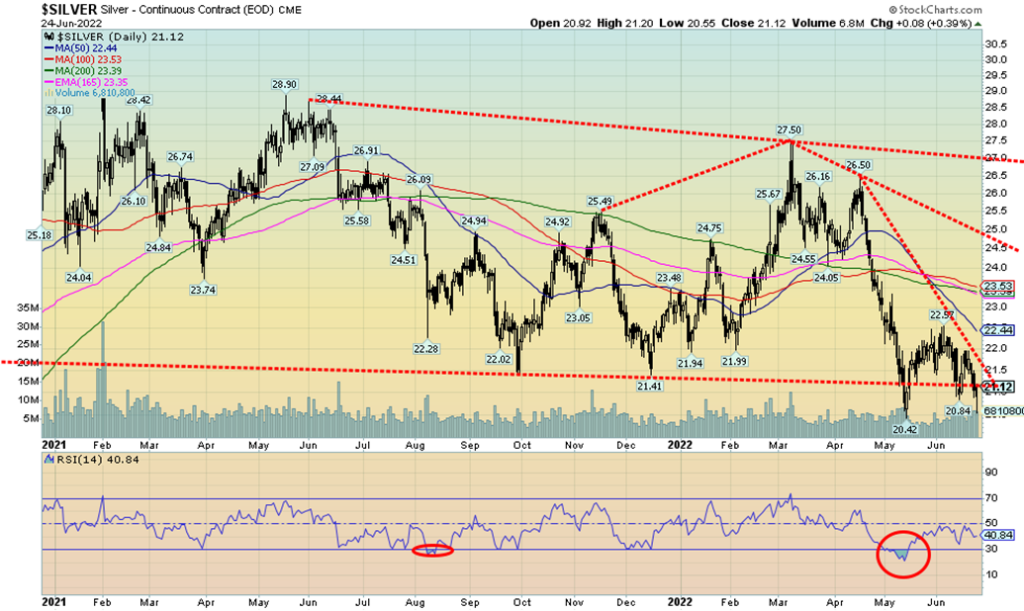
Silver managed to retrieve itself from falling far on Friday and by the end of the day eked out a tiny 8-cent gain or 0.4%. On the week, it didn’t save silver as it fell 2.1%. While we can’t swear that Friday might have been a low, we’re pleased that silver prices tried to break to the downside, then failed, reversed, and closed marginally higher. On the charts it is appearing as a potential test of the $20.42 low seen in May. The low Friday was $20.55. It now sets up the possibility of a double bottom. But the breakout point is above $23. If that occurs, then targets could be up to $27 and that major breakout line at the top. The pattern that silver has formed is a familiar one and it should result in a rebound rally. But until we regain, say, at least above $22, the risk remains to the downside. Above $22, the odds improve for a run to the double bottom breakout and bigger resistance near $23.50. Small divergence this past week, as well as silver, fell below its June 14 low at $20.84 but gold did not break below its June 14 low of $1,806.
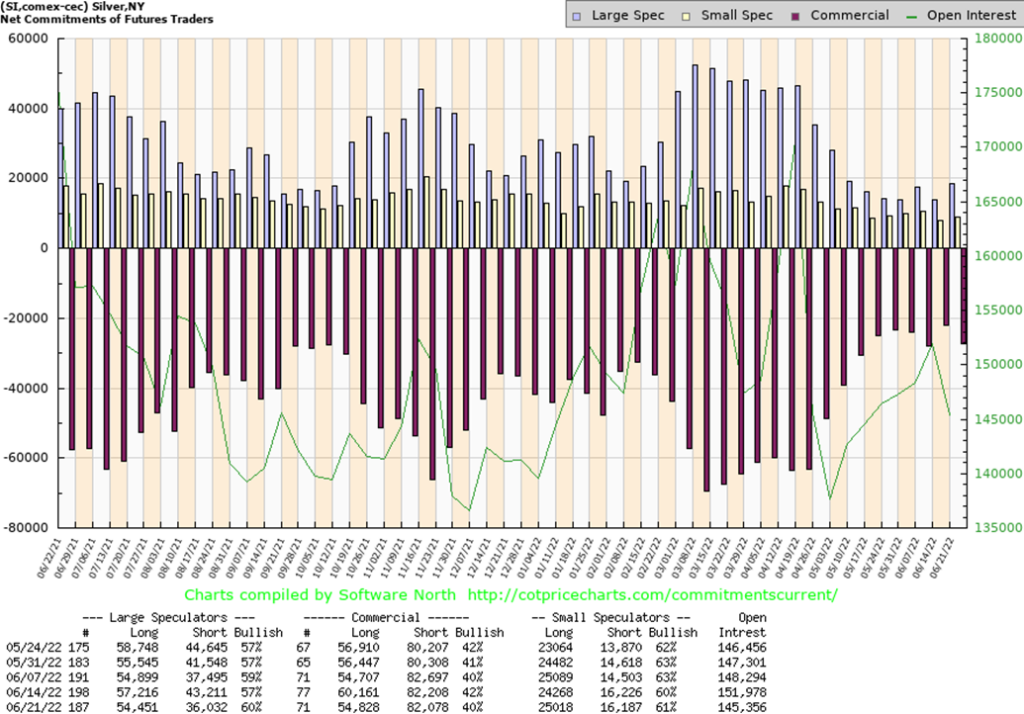
As with the gold COT, the silver commercial COT slipped back to 40% this past week from 42%. Longs fell by over 5,000 contracts while shorts were largely unchanged. The large speculators’ COT rose to 60% from 57% as even they shed longs by about 3,000 contracts but also shed shorts by about 7,000 contracts. Overall, open interest fell by over 6,000 contracts on a down week. As with the gold COT, we still view the silver COT as positive but the drop is of at least some minor concern.
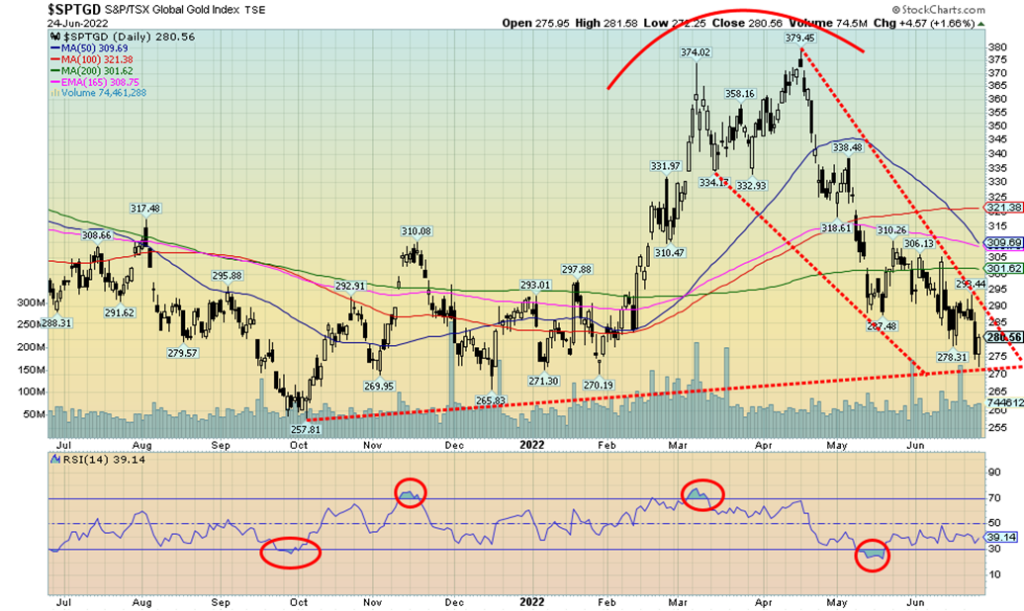
We are seeing rumblings of a possible bottom for the gold stocks but, given we have no official buy signals nor any confirmation of a low, we can only say even we’d be speculating that we’ve made a bottom. Most indicators are registering positive divergences on the dailies and the monthly RSI for the TGD above has fallen to around the 50 level, neutral. This past week the TSX Gold Index (TGD) fell 2.7%; however, on Friday the index made a new low for the move, then reversed and closed higher up 1.7% on the day. The TGD left a nice bullish reversal on the charts. The Gold Bugs Index (HUI) did the same but only lost 1.5% on the week. So far, the TGD held key support near 270. Above 298 we’d get a buy signal and above 305 we’d get some confirmation of a low. What’s key is that 270 level as a breakdown; under it would have set up a test of the September low near 258. We’re optimistic that we may have hit a bottom but clearly need some confirmation. Above 298/300 would go a long way to suggest that the low is in for a summer rebound. A major rise would not get underway until we rose above 325 as a minimum. But now very important for 258/270 to hold on any further pullback.
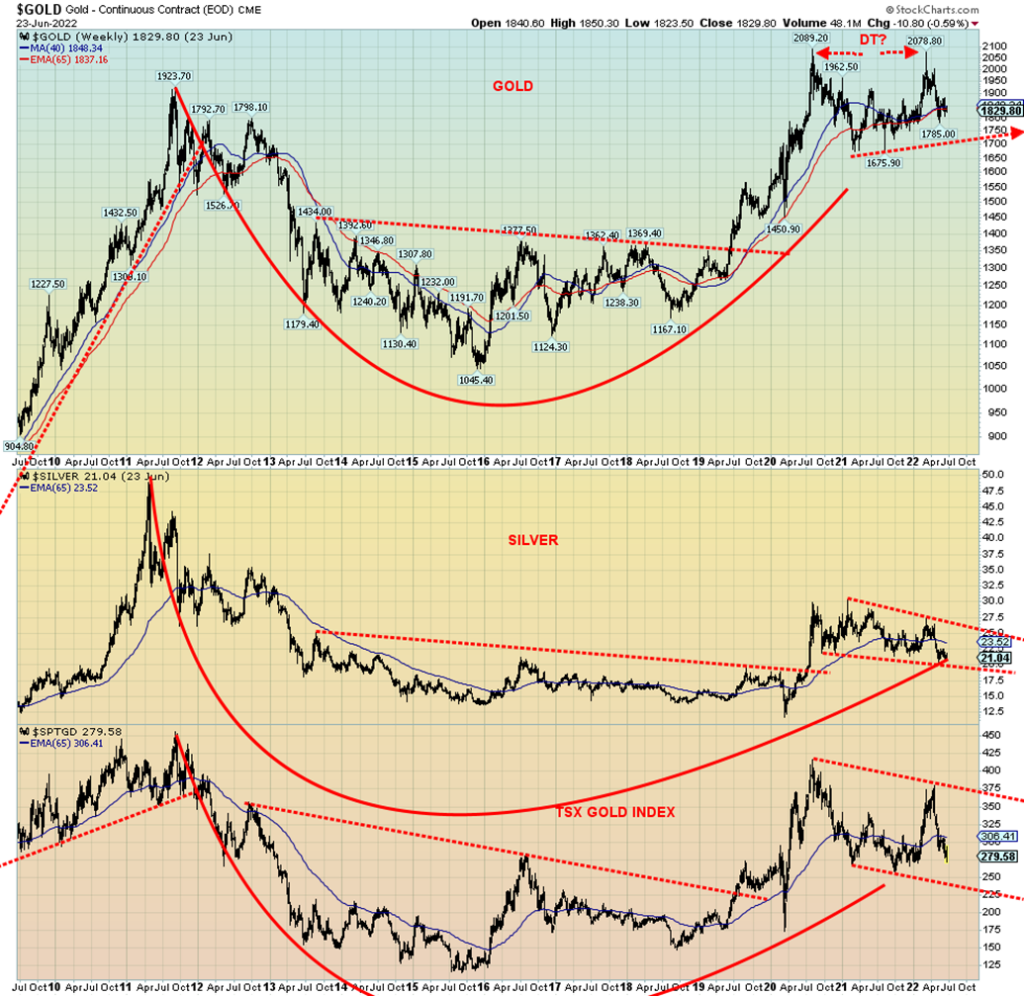
Here’s a long-term weekly chart of gold, silver, and the TSX Gold Index (TGD). Many have talked about the cup and handle pattern that has formed on all three. The cup is that long period between 2011 to 2019 before they broke out of the pattern. What has been forming ever since is what appears as the handle. But in looking at them there are some concerns. First is the potential double top pattern on gold near $2,080/$2,090. If it is true, a breakdown under $1,725 could in theory point to a collapse near $1,300. We could argue that silver
could be forming a descending triangle. A breakdown under $20 could in theory point to a collapse down to $10. The TGD actually looks not bad as it just appears to be forming a nice bear channel. Currently, its bottom is near 225. With gold, we have often mentioned the 7.83-year cycle and the 23.5-year cycle as coming due over the next few years. This is why any rebound now needs to be monitored carefully. A failure to see new highs for gold and silver could set up the collapse we’ve noted. This is not to question why would this happen but to state the technicals are giving us this potential interpretation. Once the low is in place, however, a huge rally could develop as loss of confidence in government intensifies.
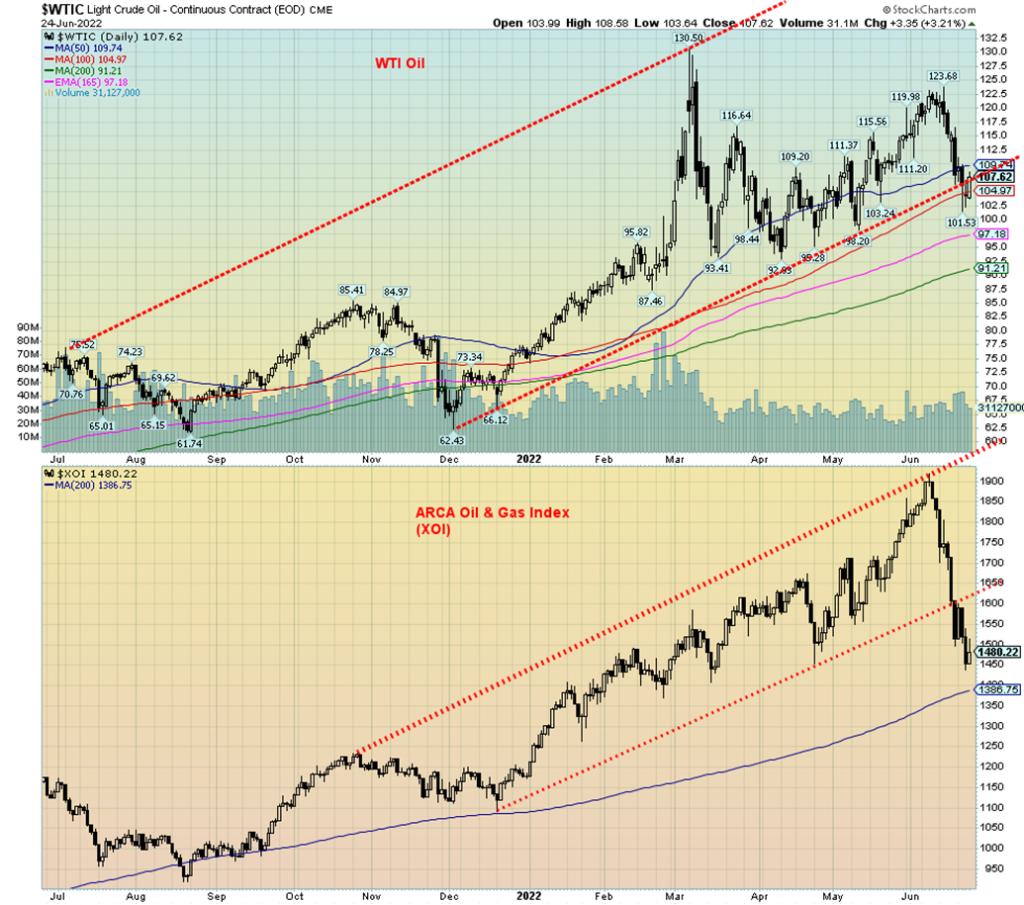
Continued fears of a recession that could kill or at least slow demand weighed once again on the oil market this past week. However, by Friday WTI oil recouped some of those losses and ended the week down only 0.3%. The supply glut continues in the U.S. for natural gas (NG), even as in the EU they remain supply challenged. On the week NG fell 9.5% but EU NG at the Dutch Hub rose 9.1%—two very different directions. Disruptions dominate as the EIA couldn’t release its report because of electricity problems, it seems. But data was pointing to a big stock build, which would help pressure prices lower for WTI oil. Brent crude also fell this week, off 0.4%. The energy stocks continued their recent correction as the ARCA Oil & Gas Index (XOI) lost 2.3% while the TSX Energy Index (TEN) dropped 4.6%.
The EU is in an increasingly difficult position with regard to Russian gas. Already there are threats that all gas will be cut off to the EU. Germany is considering firing up coal plants again. But if the EU is seeking other gas supplies, they will find there just isn’t enough. With Russian coffers brimming with rubles and others willing to pay rubles for their oil and gas, Russia is seeing a drop but, so far, not a significant one. Their problem is not on the export side; it’s on the import side where they are having difficulty sourcing supplies of technology, etc. that they imported and need.
Technically, WTI oil appears to have broken the uptrend line from the early December low. However, it is not yet a serious breach and WTI is trying to find support at the 100-day MA. More serious would be a breakdown under $98 as that could send prices down to $90 support. Not so the energy stocks as the XOI has broken its uptrend line firmly. Good support is coming up near 1,380 the 200-day MA. NG has fallen 35% from its high only two weeks ago. It has firmly broken support lines. Currently, it is trading near its 100-day MA but more likely could fall to the 200-day MA near $5.60, possibly this coming week.
Seasonally, both oil and gas are entering their down periods. NG’s period is February to June and during this period just past NG jumped almost 150% from its February low to the June top. Oil and the XOI follow a similar pattern. The XOI’s period is December to July. From December to its June top the XOI gained over 70%. It seems that the seasonally weak period is coming to the forefront. Unless something breaks, we’d expect this softness to continue into July. The only threat we’ve been reading about is possibly an attack by Israel against Iran. That could set off oil prices once again. The hurricane season is also getting underway.
Oil perks up again over $115 and could once again challenge the highs over $124. Otherwise, the recent rise to $123.68 is looking more like a corrective rather than the start of another leg to the upside.
Copyright David Chapman, 2022
__
(Featured image by via Unsplash)
DISCLAIMER: This article was written by a third party contributor and does not reflect the opinion of Born2Invest, its management, staff or its associates. Please review our disclaimer for more information.
This article may include forward-looking statements. These forward-looking statements generally are identified by the words “believe,” “project,” “estimate,” “become,” “plan,” “will,” and similar expressions. These forward-looking statements involve known and unknown risks as well as uncertainties, including those discussed in the following cautionary statements and elsewhere in this article and on this site. Although the Company may believe that its expectations are based on reasonable assumptions, the actual results that the Company may achieve may differ materially from any forward-looking statements, which reflect the opinions of the management of the Company only as of the date hereof. Additionally, please make sure to read these important disclosures
__
(Featured image by Chris Liverani via Unsplash)
DISCLAIMER: This article was written by a third party contributor and does not reflect the opinion of Born2Invest, its management, staff or its associates. Please review our disclaimer for more information.
This article may include forward-looking statements. These forward-looking statements generally are identified by the words “believe,” “project,” “estimate,” “become,” “plan,” “will,” and similar expressions. These forward-looking statements involve known and unknown risks as well as uncertainties, including those discussed in the following cautionary statements and elsewhere in this article and on this site. Although the Company may believe that its expectations are based on reasonable assumptions, the actual results that the Company may achieve may differ materially from any forward-looking statements, which reflect the opinions of the management of the Company only as of the date hereof. Additionally, please make sure to read these important disclosures
David Chapman is not a registered advisory service and is not an exempt market dealer (EMD) nor a licensed financial advisor. He does not and cannot give individualised market advice. David Chapman has worked in the financial industry for over 40 years including large financial corporations, banks, and investment dealers. The information in this newsletter is intended only for informational and educational purposes. It should not be construed as an offer, a solicitation of an offer or sale of any security. Every effort is made to provide accurate and complete information. However, we cannot guarantee that there will be no errors. We make no claims, promises or guarantees about the accuracy, completeness, or adequacy of the contents of this commentary and expressly disclaim liability for errors and omissions in the contents of this commentary. David Chapman will always use his best efforts to ensure the accuracy and timeliness of all information. The reader assumes all risk when trading in securities and David Chapman advises consulting a licensed professional financial advisor or portfolio manager such as Enriched Investing Incorporated before proceeding with any trade or idea presented in this newsletter. David Chapman may own shares in companies mentioned in this newsletter. Before making an investment, prospective investors should review each security’s offering documents which summarize the objectives, fees, expenses and associated risks. David Chapman shares his ideas and opinions for informational and educational purposes only and expects the reader to perform due diligence before considering a position in any security. That includes consulting with your own licensed professional financial advisor such as Enriched Investing Incorporated. Performance is not guaranteed, values change frequently, and past performance may not be repeated.


Bitcoin Stalls Near $60K as Strategy Moves, ETFs Outflow, and EU MiCA Rules Take Effect
Bitcoin hovers near $60,000 with ETF outflows, while Strategy boosts reserves, sells BTC, and raises dividends to reassure investors. Ethereum...


Cannabis Dominates Global Drug Use: Trends, Risks, and Shifting Markets
Cannabis remains the world’s most widely used illicit drug, with 256 million users in 2024, surpassing all others combined. Growth...


Italy Approves First Hydrogen-Powered Train for National Rail Network
ANSFISA has approved Italy’s first hydrogen-powered train, the Alstom HMU214, for use on the Brescia–Iseo–Edolo line. Capable of 140 km/h,...


Cotton Market Weakness Persists Despite Brief Rebound
Cotton prices fell to new lows last week before a modest rebound. USDA data shows crop conditions remain worse than...


Eli Lilly Hits $1 Trillion Valuation Amid Strong Bullish Momentum
Eli Lilly stock hit a record high, surpassing $1 trillion market value after strong product demand. Shares surged over 7%,...
 |
|
 |  |
 |
|
-

 Markets1 week ago
Cocoa Market Faces Mixed Trends Amid Rising Supply and Weak Demand
-

 Africa6 days ago
Bank of Africa Expands Sino-African Trade Partnerships in Beijing
-
 Biotech2 weeks ago
Bavarian Biotech Sector Expands with Record Funding and Startup Growth in 2025
-

 Africa2 days ago
BOAD Approves Major Funding Boost to Drive West African Development