Featured
A Look at Dow Jones Bear Markets 1885 to 2021
Regular readers of my work know I’m focused on what I call extreme-market events, not just because they are important, but as they are easy to identify and analyze. For example; days of extreme-market volatility, or Dow Jones 2% days. A Dow Jones 2% day occurs when the Dow Jones moves (+/-) 2% from a previous day’s closing price.

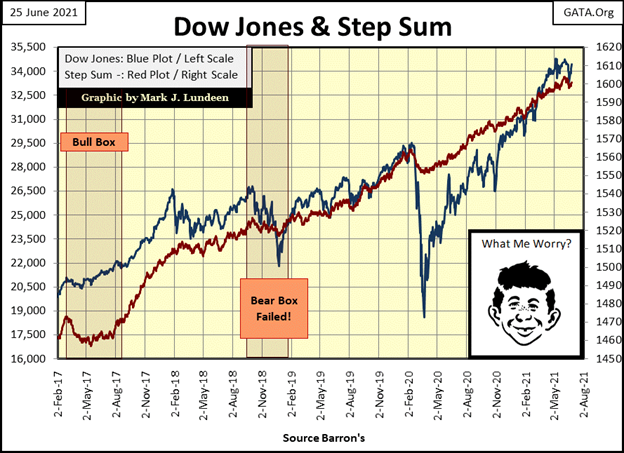
Last week, I was concerned the stock market was at a critical juncture, that maybe Mr Bear was coming back to have his way with the Dow Jones. What difference a week can make, or in the case of the Dow Jones’ BEV -5% line below, what little difference a week made.
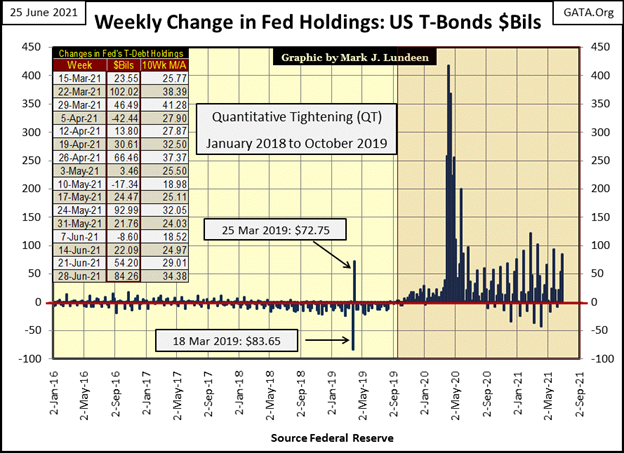
The Dow Jones has been above its BEV -5% line since early last November, or in scoring position for making new all-time highs. At the close of this week, that remains to be true. I’m a bit surprised, but I shouldn’t be as the FOMC “injected” another $84 billion into the financial system this week. Before January 2008, the FOMC typically “injected” $3 billion * A MONTH * into the financial system to inflate their High-Tech and Sub-Prime Mortgage bubbles. Now it takes tens of billions of dollars a week just to maintain current market valuations.
The major market indexes below have also recovered this week. Last week new BEV Zeros (0.00% / new all-time highs) were few, and last week closed with many of these indexes below scoring position (-4.99%). This week saw market valuations inflate nicely; with six indexes at new all-time highs and eleven others closing the week in scoring position.
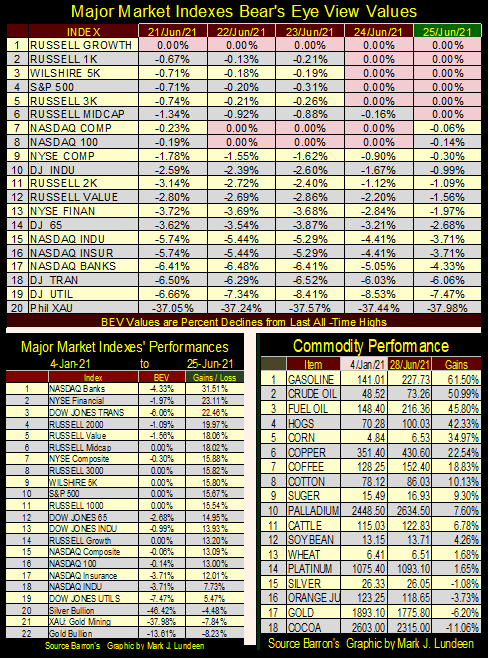
For the performance tables above, I’ve adjusted its basis date from 23 March 2020, the bottom of the -38% decline, to 04 January 2021 to see how things have gone so far in 2021. For the major market indexes, they’ve advanced nicely so far this year, most with double-digit percentage gains. The only downers so far in 2021 have been gold, silver and the XAU.
But when looking at how commodity prices have moved so far in 2021 (right table), that’s a bit odd. 2021 is the second year of big gains in commodity prices. Energy price increases have doubled that of the best performing stock indexes seen above. This contradicts the Department-of-Labor’s low CPI numbers.
Knowing this, one would have expected bond yields to have begun rising as stock market valuations deflate. But so far that hasn’t happened. What also hasn’t happened are valuations in precious metal assets benefitting from the torrents of “liquidity” flowing from the FOMC (chart below). Patience in 2021 remains a virtue when it comes to things gold and silver.
Here’s the chart (below) that led me astray last week; the Dow Jones in daily bars. Look at the inverted bowl topping formation under the red curve. If the Dow Jones was to have a big decline in the following week, one would think it would begin after such a top.
But it was not to be, as seen in the five following daily bars from this week in the black oval. This is why its not prudent to be too specific on one’s bearish comments in a market, where the bulls can literally pull unlimited billions-of-dollars out of their posteriors to fix market valuations as they see fit.
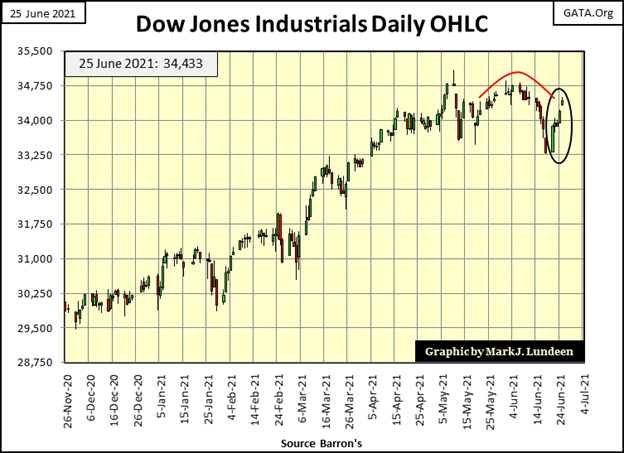
So, what are we to conclude from the Dow Jones’ escape from the grasping claws of Mr Bear seen this week? That the “policy makers” are unbeatable? They were this week, but there comes a week when things will play out differently.
Greg Hunter at USA Watchdog interviewed Michael Pento recently. Michael, for decades has commented on the malfeasance practiced daily by the Federal Reserve’s FOMC. In the USA Watchdog interview below, once again he did not disappoint. Michael is predicting a major-market event (bear-market event) sometime in the next year, possibly beginning this autumn, or coming spring for my Australian readers.
A reoccurring theme in Michael’s market commentary is the FOMC’s abusive practices in the debt markets; where since the Greenspan Fed, ample credit at “attractive rates” has motivated governments, corporations and individuals to dangerously over leverage their balance sheets.
If you want to know more about Mr. Pento’s comments in his one-hour interview above, you should click the link and get it straight from the source, as what I want to do this week is a review of Dow Jones Bear Markets since 1885. It’s important my readers see the potential for damage to their net worth in the pending bear market.
I’ll start off with two views of the Dow Jones since it was first published in February 1885, in the graphic below (two charts down). The top chart is the Dow Jones as published, which thanks to monetary inflation flowing from the Federal Reserve, has rendered the data into nothing, for the first 100-years of Dow Jones history in the chart. Where’s the Great Depression Bear Market?
I’ve placed two trend lines in the upper chart along the Dow Jones tops for the Dot.Com and Sub-Prime Mortgage bubbles and their associated bear-market bottoms. Since 2015 the Dow Jones has soared far above the upper-trend line, deep into the hyper-inflated valuations investors “enjoy” today.
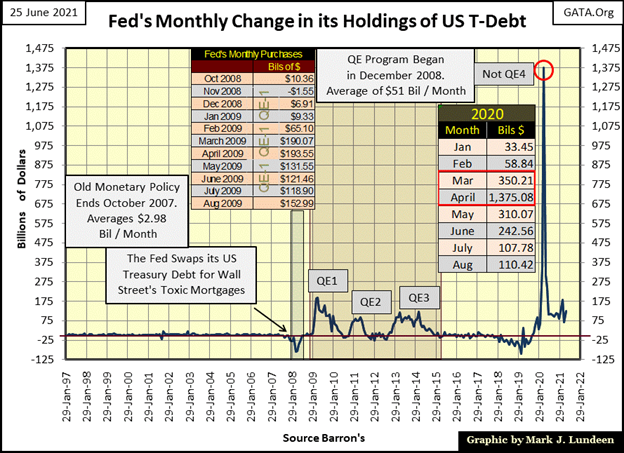
It’s notable that following last March’s -38% bear market bottom piercing this upper-trend line (Red Circle), the FOMC injected massive amounts of “liquidity” into the market with their Not QE-4. This suggests members of the FOMC, in their timing of their historic plus 1.38-trillion-dollar injection in April 2020 (Chart Below), were also watching this data.
But who knows? And if they were, they’d never admit it. Still, that is what happened; when the Dow Jones broke below the upper trend line, the FOMC “injected” 1.38 trillion dollars into the financial system in a single month.
Take a moment to study this chart. This graphic alone is enough to motivate investors to place some distance between their investment funds and the stock and bond markets, as well as take on as much exposure to precious metal assets as they can sleep with.
If there is to be a Big-Bear Market event sometime in the coming year, and I believe there will be, it will be interesting seeing the FOMC’s reaction to the Dow Jones once again breaking below the upper trend line in the chart below. Will a second break below this line trigger their Not QE-5? Like me, my readers will have to wait to see.
The trend line along these bear market bottoms is also interesting. I don’t guarantee my work, as I can’t see into the future. But, this lower trend line suggests the bottom in the next bear market could be below 5,000 for the Dow Jones. If so, that would be at least an 85% bear market bottom from the Dow Jones’ last all-time high of 34,777.
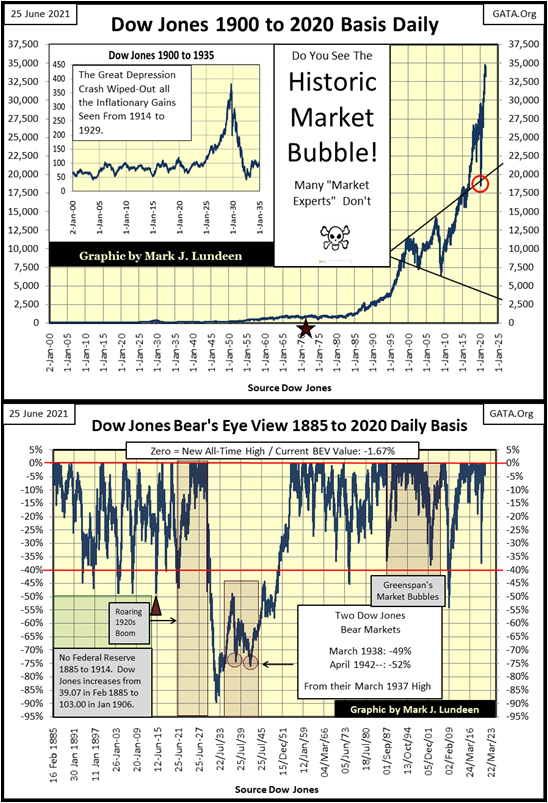
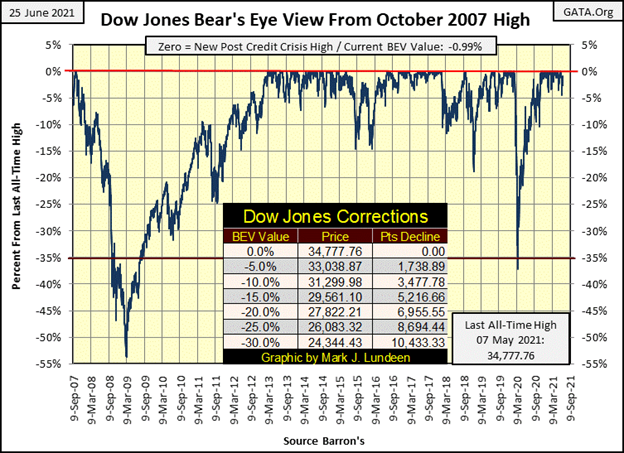
A more comprehensive view of the past 136-year history of the Dow Jones is seen in its Bear’s Eye View (BEV) of daily closings since February 1885 to this week’s close (chart above). The BEV takes any market data series and compresses it into a range of only 100%;
- 0.00% is a new all-time high, (aka BEV Zero),
- -100.00% is a total wipeout in valuation,
- and everything in between as Mr Bear claws back the bulls’ capital gains.
So, what you’re seeing above are new all-time highs and percentage claw backs by Mr Bear for the past 136 years of Dow Jones’ history. The BEV chart has a red-line at its BEV -40% line, as since 1885 seeing the Dow Jones deflate by 40% from an all-time high (BEV Zero) signaled an excellent reentry point for investors. The only exception to that rule was the Great Depression’s 89% bear market bottom, the valuation crater seen in the Dow’s BEV chart above.
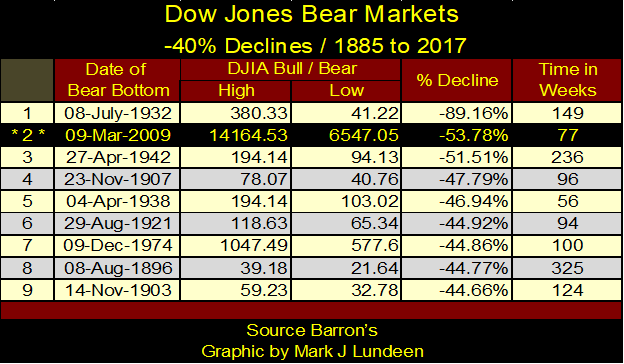
Next is my table listing Dow Jones 40% bear markets, those market declines that since 1885 broke below the BEV -40% line seen above. There have been additional piercings of the Dow Jones -40% BEV line above, but I chose to ignore them for technical reasons I won’t go into now.
Regular readers of my work know I’m focused on what I call extreme-market events, not just because they are important, but as they are easy to identify and analyze. For example; days of extreme-market volatility, or Dow Jones 2% days. A Dow Jones 2% day occurs when the Dow Jones moves (+/-) 2% from a previous day’s closing price. So, a day where the Dow Jones moves (+/-) 6% or more from a previous day’s close is still considered a Dow Jones 2% day in my technical work, as the (+/-) 2% is a threshold level for the extreme market event.
One of my technical studies is compiling the quantity of Dow Jones’ 2% days found in a running 200-day sample, something I call a 200-count. The results of this study can be seen in the chart below, which goes nicely with the Dow Jones 40% Bear Market table above.
In the chart below, I begin with the Great Depression’s bear market as Square A, as this was the first market catastrophe inflicted on humanity by the Federal Reserve System since Congress created this monstrosity in 1913. Square B was the 1930s’ second 40% bear market bottom.
The bear market bottom of April 1942 (#3 in the table above) failed to produce any Dow Jones 2% days. Following the market trauma of the depressing 1930s, and four months into WWII, the public was out of the market and had more important things to worry about than the third 40% bear-market bottom on Wall Street in the past ten years.
The next spike in the Dow Jones’ 200-count occurred in 1974, Square C (#7 in the table above), as the Dow Jones saw its first 40% bear market since 1942. This thirty-two year gap in the Dow Jones 40% bear markets, was the most quiescent era of market history in terms of market volatility the Dow Jones saw since 1900, (see chart below).
Notable, the 40% bear market of 1974 occurred only three years after the US Treasury took the dollar off the Bretton Woods $35 gold peg in August 1971. That may have been a coincidence. But, looking at the Dow Jones 200-count plot below, following August 1971, the Dow Jones began a new pattern of volatility never seen before.
Since August 1971, the stock market became a dumping ground for dollar inflation flowing from the FOMC, resulting in a series of inflationary booms and deflationary busts (Squares C to G) that continues to this day;
- Square C / 1973 to 1974 bear market,
- Square D / October 1987 flash crash,
- Square E / Dot.Com bear market,
- Square F / Sub-Prime Mortgage bear market,
- Square G / March 2020’s twenty-three day, 38% flash crash.
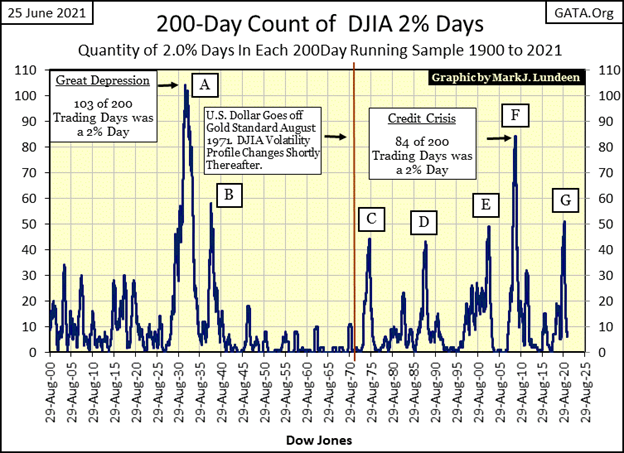
Square G is the only volatility spike in the Dow Jones’ 200-count that isn’t associated with a 40% bear market bottom, rather it’s associated with the March 2020’s 38% bear market bottom. Since January 1900, the Dow Jones has seen market bottoms between 30% and 40%. But last March’s 38% market bottom was the first that produced a Dow Jones’ 200-count of over 50.
This is an important fact to take note of. Along with the fact that coincidentally, the Dow Jones also broke below its upper trend line (the Red Circle) noted earlier, as an apparent triggering event for the FOMC to “inject” a massive $1.38 trillion dollars into the financial system. Had the FOMC not “injected” this massive dose of “liquidity” into the market, I believe the March 2020’s spike in the 200-count would have gone far higher, as the Dow Jones itself deflated far below its BEV -40% line.
So, in March 2020 did the FOMC have a victory over Mr Bear? Victory? Maybe a stay-of-execution would be a better way of understanding our current post March 2020 market advance, as Mr Bear isn’t going away. He will return stronger than before. After decades of monetary hijinks by the “policy makers”, I’m thinking of a repeat of the depressing 1930s, another 90% bear market.
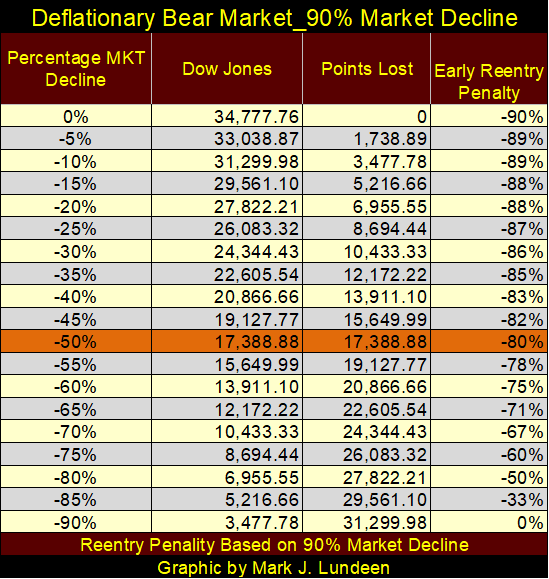
If that is to be so, the table below gives the specifics based on our current last all-time high of 34,777. One thing to understand about a massive 90% bear market, the old rule of a 40% market decline being a safe reentry point is no longer valid. Rather, it’s a siren’s song drawing unwary investors towards disaster.
Here’s the grizzly mathematics of a 90% Great Depression market collapse; reentry after a 50% decline (highlighted below), would result in an 80% loss of invested funds at the ultimate bottom of the bear market. Even reentry after an 80% decline, still results in a 50% loss of investment at the ultimate bottom of the bear market. In a massive bear market such as seen below, the markets become quicksand that takes all over inflated assets down with it.
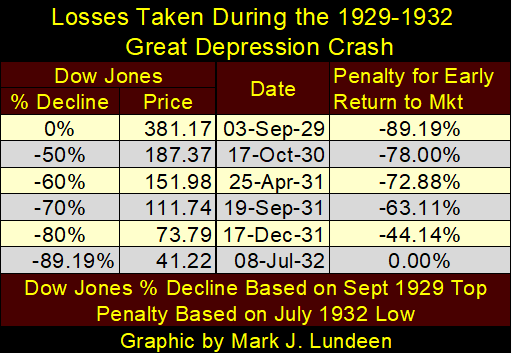
Investors in the early 1930s, looking to scoop up bargains before the actual bottom in July 1932, discovered this truth the hard way (table below). That’s what made the Great Depression Crash so depressing; the markets became a meatgrinder to all who dared to enter before its July 1932, 89% bottom.
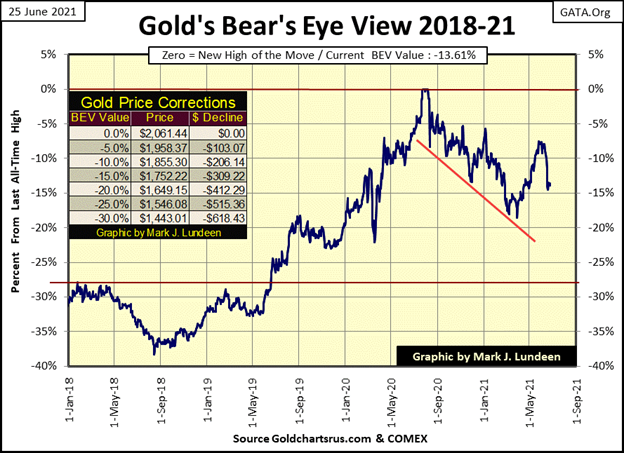
Time to move on to gold’s BEV chart below. This past week saw little change, which to my eyes means gold’s BEV -15% line held, even after gold saw three of five days decline this past week.
Common sense tells us gold isn’t going to hover above its BEV -15% line forever ($1752). So, what’s to come next? For that we must watch gold’s -10% and -15% lines. From now on, for every week gold refuses to break below its BEV -15% line, indicates it’s gathering strength to break above its BEV -10% line, and then on to history with another BEV Zero, hopefully sometime this summer.
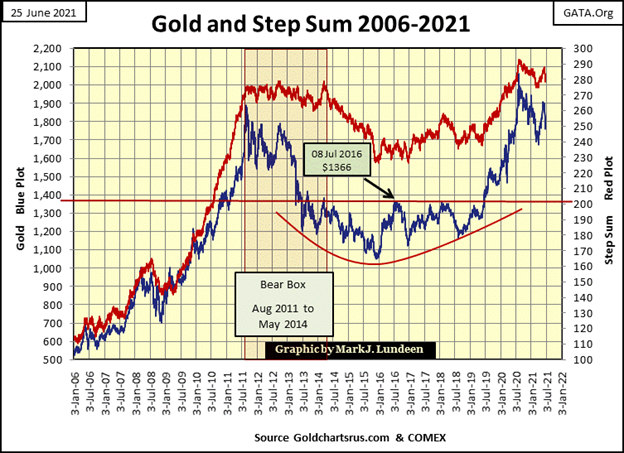
Looking at gold’s step sum chart below, not much to comment on it this week. We have to wait to see if the current downward trends will continue, or reverse themselves in the weeks to come. If that isn’t a comfort to you, go back and review Michael Pento’s interview by Greg Hunter above.
Well, if Alfred (below) wasn’t going to worry last week, there is no reason for him to do so at the close of this week either. I’m expecting additional new all-time highs for the Dow Jones in the weeks, and maybe months to come.
But what are we looking at here? Maybe 10% to 15% in additional gains in this advance, as opposed to the massive down side in an economy pregnant with counter-party failure. In our world, as it is, the risk-reward ratio in this market greatly favor gold, silver and their miners. While for the broad stock market, I don’t see investors getting compensated for the enormous risks they’re assuming.
Last week, with Basil III’s banking requirements coming on line on June 28th, I was wondering how low gold’s 15 count would decline this week. It could have fallen all the way down to a -11, or a -9. Instead, it declined to a -7 on Wednesday and stayed there to week’s close.
Look at this too: gold saw a +7 a month ago on May 25th. In just twenty-one COMEX trading sessions, gold went from being overbought to oversold, and that doesn’t happen very often! From May 25th to June 23rd, from being overbought to oversold, so how far did the price of gold fall? $130.88, or a 6.86% decline in price over a twenty-one day period.
In gold’s table below (left side) look at all those daily declines since May 25th! And the bears managed only a 6.86% decline in the price of gold after all that? So far gold’s BEV -15% level is holding firm.
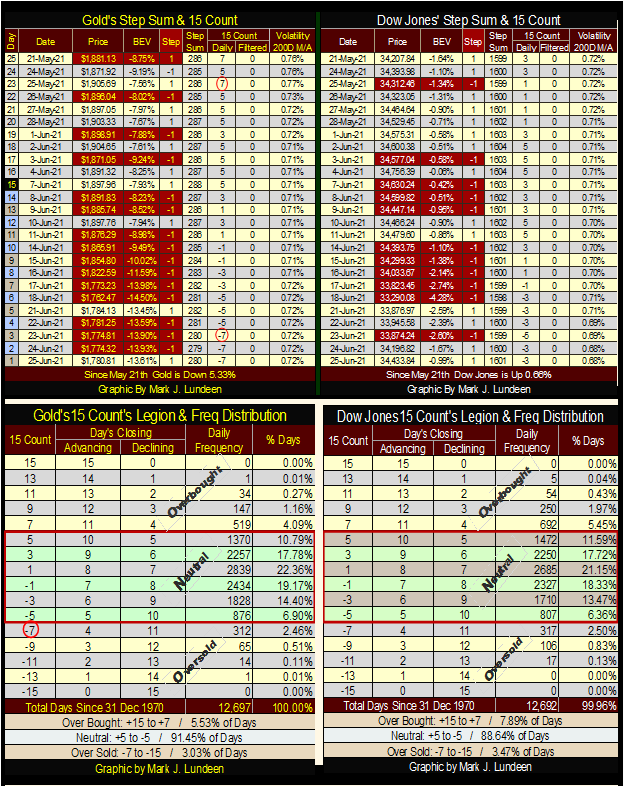
Looking at gold’s 15 Count Legion & Frequency Distribution table above, since December 1970 gold has seen a 15 count of -7 in only 312 (2.46%) of its daily closings for the past fifty-one years. And you could divide that by three, as such extreme-market events come in clusters, like the three -7s seen this week.
No matter, gold closing the week with its 15 count at a -7 is now an oversold market, a market primed for a bullish reversal. Note too, last week’s close saw gold’s 15 count at -5. This week closed with gold in an oversold condition (-7), but at a higher price than the week before. How did that happen? I don’t care as it looks bullish to me.
I really like this action in gold’s 15 count, rising gold prices as its 15 count declines into oversold territory. Maybe next week we’ll see gold’s 15 count decline to a -9 or maybe even a -11. If next week we see lots of daily declines, one or the other is possible, as would be the price of gold breaking below its BEV -15% line. But if you look at the frequency of these deeply oversold markets in gold since December 1970 in the table above, neither a 15 count of -9 or -11 are likely.
I’m happy with what I got at week’s end; gold is now an oversold market, a market primed to resume its advance. If the bears want to keep hammering on gold next week, making it even more oversold with a 15 count of -9 or -11, I say Go-BEAR-Go!
Things are happening high up in British Columbia’s Golden Triangle. Skeena Resources is going to process the left overs of the famous Eskay Creek Mine.
Eskay Creed was one of the world’s richest ore bodies during the 1990s. When the price of gold was less than $400, and silver less than $6 an ounce, it was very profitable. Those days for the Eskay Creek Mine are now over. However, with current gold and silver prices, the old mine’s lessor grades of ore are now profitable, and Skeena is going for it. Good for them.
But, of all the gold and silver plays available in the Golden Triangle, I continue believing Eskay Mining to be the best. A year ago, Eskay Mining was trading for less than ten cents a share. Last winter its share prices soared up to $2.49 based on last summer’s drill program’s assays, indicated its crack team of geologists found another rich body of precious metal ore very similar to the old Eskay Creek’s.
Here’s a John Kaiser interview giving the specifics of what he likes about Eskay Mining.
John Kaiser on ESK (ESKYF)

I have a significant position in Eskay Mining, purchased with my own money. I receive no compensation from management for recommending Eskay Mining. I just think Eskay is a great investment, and so I’m passing that on to my readers.
Here’s a link for general information on the Golden Triangle in British Columbia. If someone is looking for more information on gold and silver mining companies located in Canada, the Golden Triangle is a good place to start.
https://duckduckgo.com/?q=british+columbia+golden+triangle&t=h_&ia=web
—
(Featured Image by Adam Nowakowski via Unsplash)
DISCLAIMER: This article was written by a third party contributor and does not reflect the opinion of Born2Invest, its management, staff or its associates. Please review our disclaimer for more information.
This article may include forward-looking statements. These forward-looking statements generally are identified by the words “believe,” “project,” “estimate,” “become,” “plan,” “will,” and similar expressions. These forward-looking statements involve known and unknown risks as well as uncertainties, including those discussed in the following cautionary statements and elsewhere in this article and on this site. Although the Company may believe that its expectations are based on reasonable assumptions, the actual results that the Company may achieve may differ materially from any forward-looking statements, which reflect the opinions of the management of the Company only as of the date hereof. Additionally, please make sure to read these important disclosures.


Youth Cannabis Use in Colorado Is Falling — But the Full Story Is More Complex
The 2026 Colorado survey shows teen cannabis use fell to 10 percent in 2025, down from 21 percent in 2015....


Morocco’s Growth Holds at 4.6% as Agriculture Offsets Economic Pressures
Morocco’s economy grew 4.6% in Q1 2026, driven by a strong agricultural rebound offsetting declines in industry. Services expanded moderately...


Abivax Shares Surge as New Trial Data Eases Safety Concerns Over Ulcerative Colitis Drug
Abivax shares surged nearly 36% after positive updated trial results for its ulcerative colitis drug obefazimod reassured investors following earlier...


El Dorado Raises $9M to Expand Cross-Border Fintech Platform
El Dorado, a Latin American fintech improving cross-border financial services, raised a $9 million Series A led by Paradigm with...


Bitcoin Stalls Near $60K as Strategy Moves, ETFs Outflow, and EU MiCA Rules Take Effect
Bitcoin hovers near $60,000 with ETF outflows, while Strategy boosts reserves, sells BTC, and raises dividends to reassure investors. Ethereum...
 |
|
 |  |
 |
|
-

 Biotech6 days ago
Gilead HSV Plan Could Transform Market Outlook
-

 Crypto2 weeks ago
Crypto Market Stays Stable as Bitcoin and Ethereum See Mild Declines
-

 Impact Investing1 day ago
Italy Approves First Hydrogen-Powered Train for National Rail Network
-

 Fintech1 week ago
Mollie Expands Across EEA With €350M Investment to Strengthen European Payments Network