Business
A Look at the Periods of Extreme Market Volatility
One theme I’m constantly dwelling on is; NYSE bull markets are quiet markets, same for the NASDAQ. That’s not saying there isn’t any excitement in a bull market, as making money is always exciting. But during prolonged market advances, extreme-market events, such as days of extreme volatility (Dow Jones 2% days) and days of extreme market breadth (NYSE 70% A-D days) are infrequent occurrences.

Monday this week saw a little excitement, as the Dow Jones saw its first 2% day since January 27th. And like last January, this week’s day of extreme market volatility was but a pause the market took before the Dow Jones saw a new all-time high on Friday. I have to admit it; on Monday I was looking for some follow-up volatility, as I considered whether or not Monday’s -2.09% decline from last Friday’s close was the start of the big one.
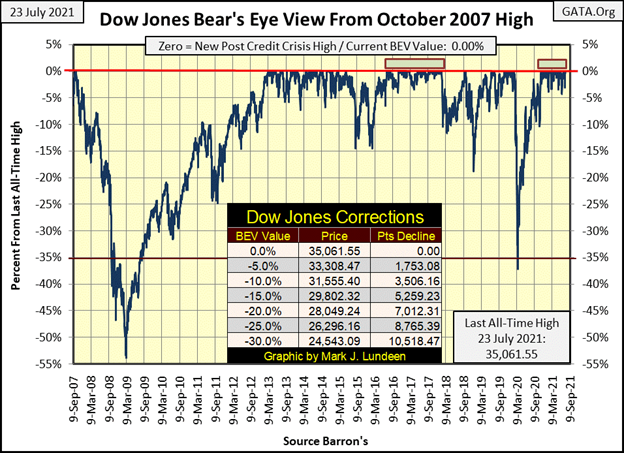
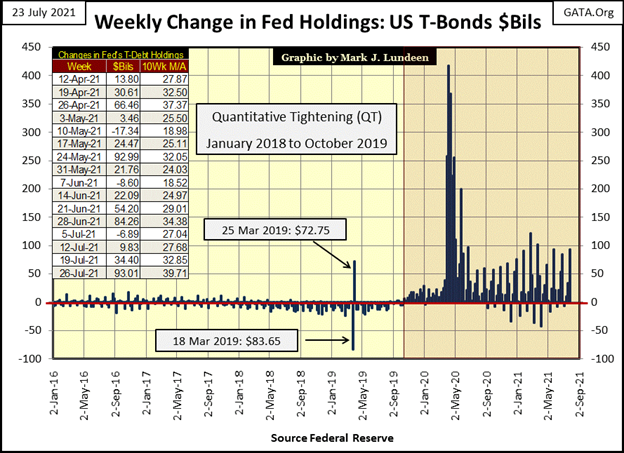
It wasn’t. Heck, the Dow Jones didn’t even break below its BEV -5% line this week. Not when the FOMC “injected” an additional $93 billion dollars into the financial system this week.
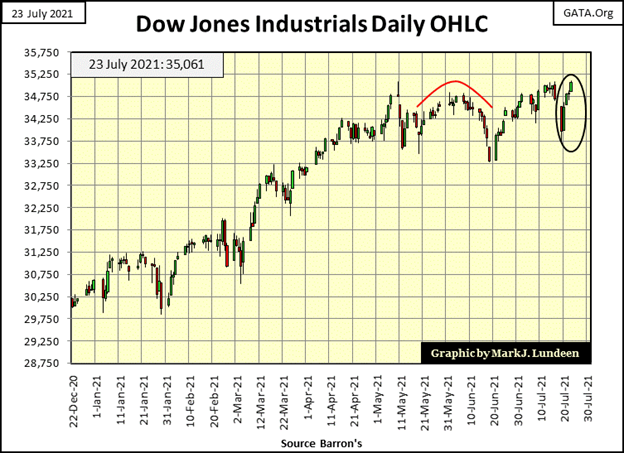
A quick look at the Dow Jones, in daily bars below, shows the great setup the bears had early this week. Last Friday ended with the Dow Jones down for the week, then on Monday the market hit an air pocket, and just dropped, closing with a 2% day. Tuesday saw some big volatility too, rebounding by 1.62%. By Wednesday, goons from the FOMC had Mr Bear in cuffs and dragged him unceremoniously from the market. By Friday, it was as if Monday’s bout of deflation had never happened.
What was the reason for Monday’s big 2.09% decline? The “market experts” were all in agreement; the new delta variant of the CCP virus caused the market to stumble. It was so obvious! This is why I’ll never be a “market expert”, I thought the problem the market had on Monday was it was grotesquely overvalued.
I’m just thinking; but I wouldn’t be surprised if in the weeks to come we’ll see the FOMC being forced to routinely “inject” $100 billion-plus a week into the market to keep it going up, or even to just keep it where it is at the close of this week.
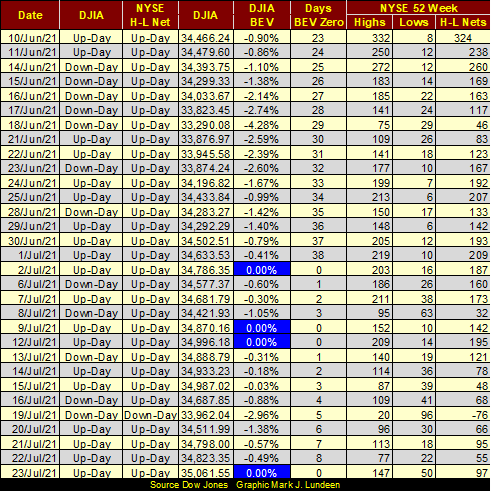
In my table for the Major-Market Indexes BEV Values below, we see how the Dow Jones (#1) worked its way out of the hole it found itself in at Monday’s close, as did the rest of the indexes. But looking at the Dow Jones in daily bars above and these indexes’ BEV values below, I get the feeling that right now, the market is finding it easier to deflate, than the FOMC is finding it to keep it inflated.
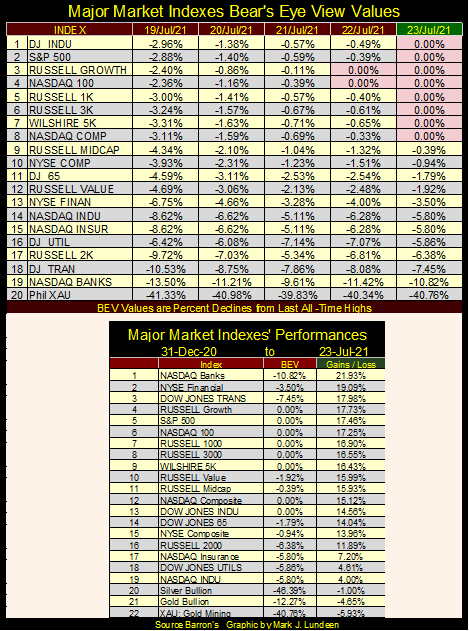
In the performance table above, these indexes have for the most part seen nice advances in 2021. But markets being markets, sometime in the future that is going to change.
One theme I’m constantly dwelling on is; NYSE bull markets are quiet markets, same for the NASDAQ. That’s not saying there isn’t any excitement in a bull market, as making money is always exciting. But, during prolonged market advances, extreme-market events, such as days of extreme volatility (Dow Jones 2% days) and days of extreme market breadth (NYSE 70% A-D days) are infrequent occurrences.
Here’s a chart plotting every day of extreme-market volatility (Dow Jones 2% days) going back to 02 January 1900. This chart is a bit cluttered, but the note at the bottom left explains what is being plotted; from 02 January 1900, to 23 July 2021, the NYSE has seen 32,853 trading sessions. Of these, only 1,895 daily closings have seen the Dow Jones move (+/-) 2% or more from a previous day’s closing price. On average, that works out to one Dow Jones 2% day for every 17.33 NYSE trading sessions for the past 121 years.
The 2% value is a threshold value, so even days the Dow Jones has moved (+/-) 3, 4 or even more than 10% from a previous day’s close, I consider a Dow Jones 2% day, a day of extreme-market volatility in my work.
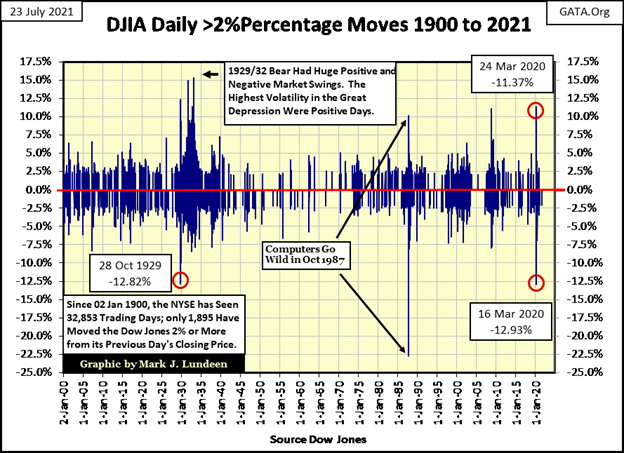
It’s obvious these days of extreme-market volatility are arranged in clusters, and these clusters of extreme days are markers for deflating market valuations at the NYSE.
The initial burst of deflation of the Great Depression-bear market peaked on 28 October 1929 (above), when the Dow Jones closed 12.82% below its previous day’s closing price. That was one terrifying day at the NYSE, a day not to be exceeded until 16 March 2020, more on that later.
Below, I’ve created a table highlighting the role volatility in the Dow Jones has played in the stock market since the 03 September 1929 market top.
The depressing 1930s suffered through many days of extreme market volatility, until the April 1942 bear-market bottom. During these 3,779 NYSE trading sessions, the Dow Jones saw 638, 2% days, or one for every 5.92 NYSE trading sessions. Let’s say that during this depressing period of market history, one out of every six trading days was a day of extreme market volatility. Nothing like it before, or since the depressing 1930s.
During this thirteen-year period of market history, the Dow Jones saw the Great Depression’s 89% market crash, plus two other big bear-market bottoms. A 49.1% market decline in March 1938, and a 52.2% bear market bottom in April 1942. When the smoke cleared from Wall Street following April 1942, an entire generation turned their backs on Wall Street. Retail investors didn’t return until the baby-boomer generation came of age. Like sex, the baby-boomers rediscovered the delights of Wall Street in the 1970s and 80s.
If there was ever a time for retail investors to get out, and stay out of the stock market for a prolonged period of time (over a decade), September 1929 to April 1942 was that time. Don’t doubt that with today’s grossly overvalued market, and the fraud that’s practiced daily in it, under the noses of “government-market regulators” there isn’t another pending exodus of retail investors from Wall Street.
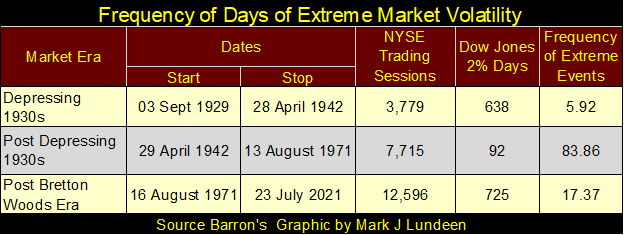
Following April 1942, an era of quiesces from extreme volatility at the NYSE began, clearly seen in the chart and table above. From April 1942 to August 1971, the NYSE saw 7,715 trading sessions, of which only 92 saw a Dow Jones 2% day, or one day of extreme market volatility for every 83.86 NYSE trading sessions. A big difference from the frequency of 2% days seen in the 1930s, and it made a difference. From the Dow Jones’ April 1942 bottom, it began a 971% advance that peaked in February 1966.
That was to change after August 1971, when the US Treasury took the dollar off the Bretton Woods $35 gold peg. Market volatility during the post $35 gold peg period increased. Since August 1971 to the close of this week, the NYSE has seen 12,596 trading sessions, of which 725 saw a Dow Jones 2% day, a frequency of one Dow Jones 2% day for every 17.37 NYSE trading sessions. Though this period of market history did see the Dow Jones increase from below 800 to over 35,000, this advance came in fits and starts/booms and busts that prevented many retail investors from profiting from this historic advance.
Why that would be is the public is fearful to buy at the bottoms. They’d rather they come into the market long into an advance, and then refuse to sell at the tops. I don’t know why, but there is something about human nature that people, in the main, consistently choose to buy at the top, and then sell at the bottom.
Let’s look at NYSE 70% Advance – Decline Days, days of extreme-market breadth in the chart below. These days are computed as follows:
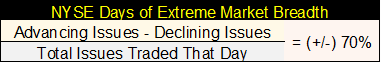
As with the 2% days, days of extreme-market volatility, the 70% in a NYSE A-D 70% day is a threshold value. So, days with an 80% or even a 90% solution are considered to be a 70% A-D Day in my work.
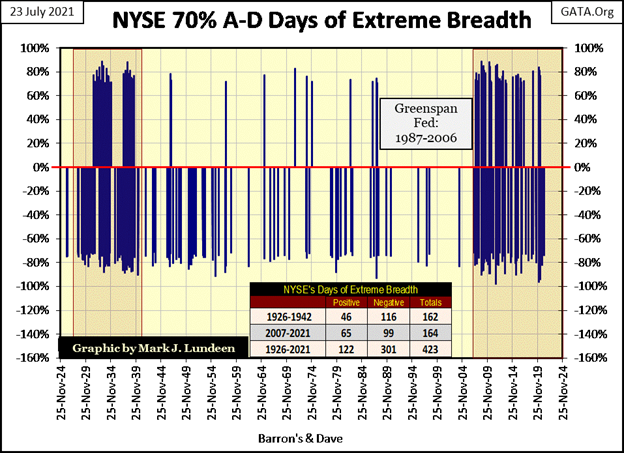
Days of extreme-market breadth are far rarer than days of extreme-market volatility. Since 1926, when my breadth data begins, the NYSE has seen only 423 days of extreme-market breadth for these 25,185 NYSE trading sessions, an average of one day of extreme-market breadth for every 59.53 NYSE trading sessions.
And like days of extreme-market volatility, when NYSE 70% A-D days occur in clusters, these clusters are markers of deflating market valuations. This was especially so from 1926 to 1942, and from 2007 to today, as highlighted in the chart below.
Look at the Greenspan Fed era; this was a period of massive inflation in market valuations, and it was almost entirely free from NYSE 70% A-D days. Then came February 2007, around the time Bear Stearns began upchucking toxic mortgages. The market began a super cluster of days of extreme-market breadth not seen since 1942, a cluster that continues to this day.
For your information, from 1942 when the depressing 1930s cluster ended in the chart below, to February 2007 when the current cluster began, stretches sixty-five years. During those sixty-five years the NYSE saw only ninety-seven 70% A-D days, a little more than one a year.
The table below is something I do when the stock market begins deflating in a big way. I publish Mr Bear’s Report card, and what a big-bad bear he can be!
The report card below is from my article dated 27 March 2020, the week the Dow Jones bottomed during a twenty-seven-day, 37.09% decline. The February 12th to March 23rd, 2020 market decline (only twenty-seven trading days) was the swiftest the Dow Jones has ever deflated 37% from an all-time high. In September / October 1929, it took forty-eight NYSE trading sessions for the Dow Jones to deflate 37% from its last all-time high. Until March 2020, that was as fast as bear market declines could go.
Let’s go over Mr Bear’s report card, which doesn’t cover all the weeks following the February 12th all-time high. Look at the extreme days during these four trading weeks, and their extremes were historic. In week #3, the NYSE saw two 70% days of over 95%.
On Monday of week #4, the Dow Jones saw a 2% day of -12.93%. As mentioned earlier in this article when discussing days of extreme volatility, the 2% day (-12.82%) of 28 October 1929 was exceeded for the first time in March 2020. I’m ignoring the extremes in volatility from 1987 as they were only computer glitches.
Looking at the Dow Jones 2% days’ 8-count; it hit an 8 on 18 March 2020: eight consecutive Dow Jones 2% days. Something not seen since 24 October 1933.
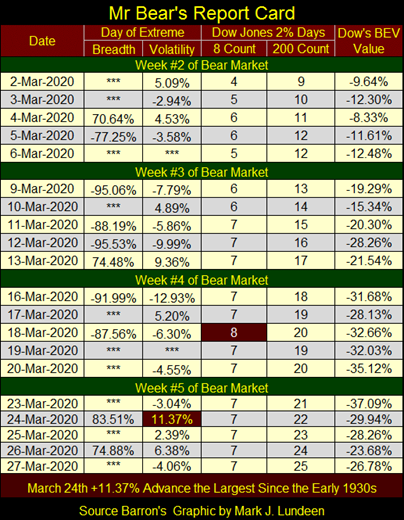
What you’re looking at above is an earthquake, a 10 on the Richter-scale in the market. When did Fed Chairman Powell announce the Federal Reserve was going to begin buying corporate bonds for the first time in history? Why on 23 March 2020, as seen below. And what was the problem? The CCP Virus of course.
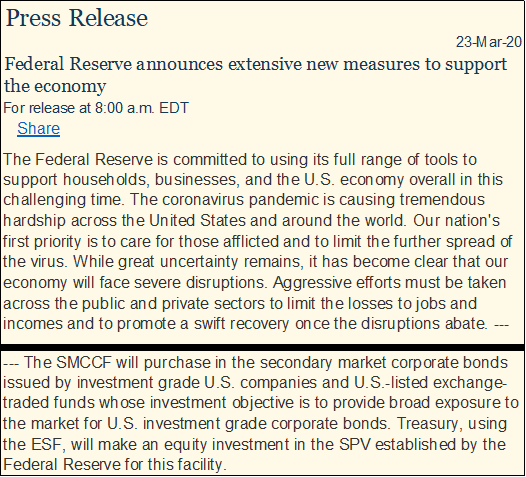
Federal Reserve Board – Federal Reserve announces extensive new measures to support the economy
Left unsaid in the above press release, the FOMC was going to “inject” a few trillion dollars into the financial system in the following months, as seen below.
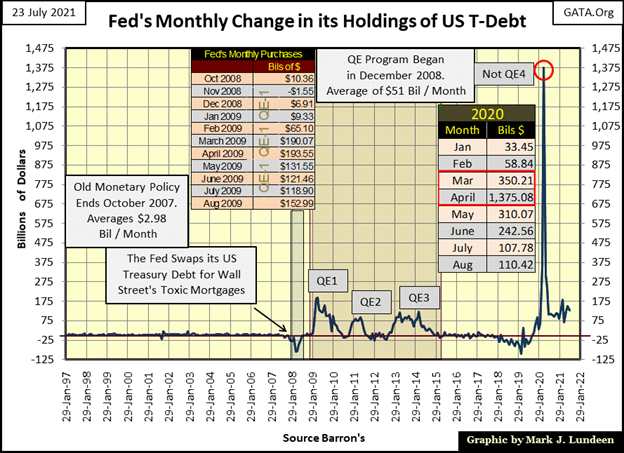
Had the Federal Reserve not begun their Not QE#4, where do you think the market would be today? I believe we would have seen a reprise of the depressing 1930s. But that doesn’t make the FOMC heroes. Since August 1971, whenever Wall Street finds itself in trouble, the FOMC has bailed them out. A few examples are listed below;
- Chrysler in the 1970s
- Continental Illinois National Bank in the 1980s
- Long Term Capital Management in the 1990s
- NASDAQ High-Tech and the Sub-Prime Mortgage Fiascos of the 2000s
Sure, some little people go to jail in all these debacles, and some fines are paid to the US Treasury, if not to retail investors who were defrauded. But on the whole nothing is written off, only “monetized.” And no one important is fired, as Wall Street’s establishment remains established, and the Federal Reserve’s balance sheet grows ever larger with the dubious assets it has monetized.
What’s seen above is a process in its terminal stage. Something that began long ago, as seen in these quotes from Barron’s from the early 1950s.
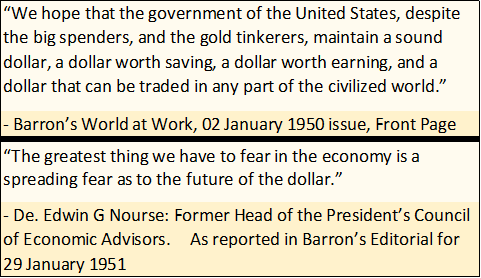
There’s some real hell that is going to be paid here when Mr Bear returns. Because even for the academics and bankers at the FOMC, they too can stack sh*t only so high in the Federal Reserve’s balance sheet, before market gravity and Mr Bear comes to pull it down.
Though these bad times are coming, they aren’t here just yet. The Dow Jones saw four new all-time highs so far in July, as the NYSE continues seeing more 52Wk Highs than 52Wk Lows. That is except for this past Monday, when the NYSE saw a 52Wk H-L Net of -76. But the nets became positive soon thereafter, so all is well at the close of this week.
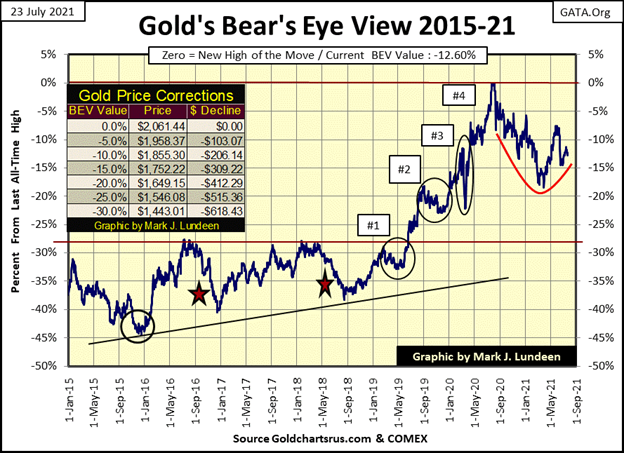
Time to move on to gold’s BEV chart. Gold’s 4th correction since the summer of 2019, when it first broke above, and then stayed above its BEV -26.5% red-line line below continues.
I don’t like it. For all the dollars the FOMC is “injecting” into the financial system, gold in the summer of 2021 should be attempting to break above $4000 or even $6000, not the $2061 BEV Zero as seen below. But it is what it is. And what it is, is that gold so far is refusing to break below its -15% BEV line.
Want more? Okay, we continue watching which BEV line gold crosses next. If it breaks above its BEV -10% line ($1855) that is good. If it breaks below its BEV -15% line ($1752) that is bad, but not fatal. I could go into more tedious detail, but for what purpose when it’s actually as simple as described above.
But I know what my readers want; they want to know which BEV line gold is going to cross next, and when it’s going to do so. Yes, and so do I. Like me, everyone is going to have to wait to find out those details.
But ultimately, the precious metals market, and precious metals miners are still very early in a historic bull market, no matter what BEV line gold crosses next. So, relax and enjoy the show.
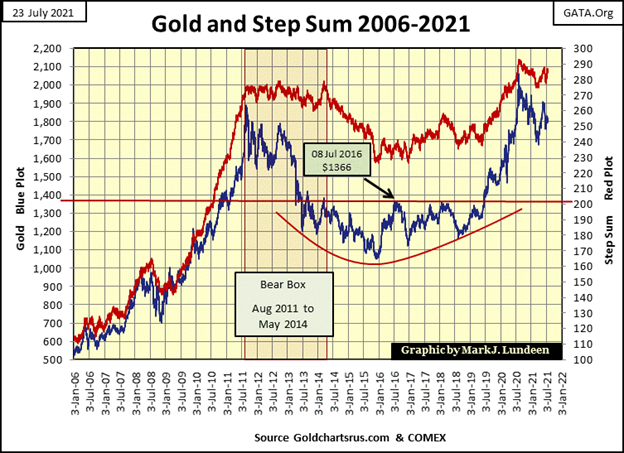
Gold, and its step sum plot below are still wondering what they should do next. Looking at the huge cup with a handle chart pattern, gold (Blue Plot) has been working on since August 2011, I’d say they are pondering when they should take off, upward and onward like a bat out-of-hell over the smoking ruins of what was once called Wall Street. A century of FOMC “monetary policy” can do that to a financial system, and the price of gold.
But when? Sometime after gold rises above, and then stays above its BEV -10% line is the answer that comes to my mind. Whether or not we gold bulls will enjoy the fruits of our labor is actually the better question, because we may not.
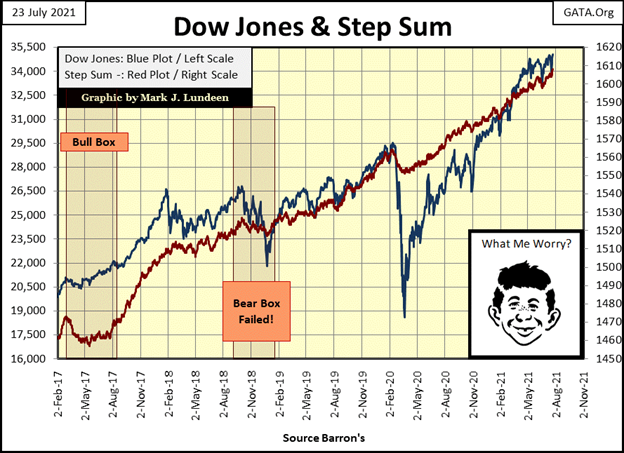
As far as the Dow Jones and its step sum goes, all looks well. The Dow Jones has been advancing since 23 March 2020, gaining 18,592 points, or 89% in the past sixteen months. After all that, as a reasonable person, I’m wondering when the Dow Jones is going to see a 10% to 15% correction?
Again, this week the FOMC has answered that question. They took the bull by the horns, and from the bottom of a Dow Jones 2% day at the close of Monday’s trading, they then dragged this geriatric beast upwards to a new all-time high at Friday’s close. Dow Jones closing above 36,000? I wouldn’t bet against it.
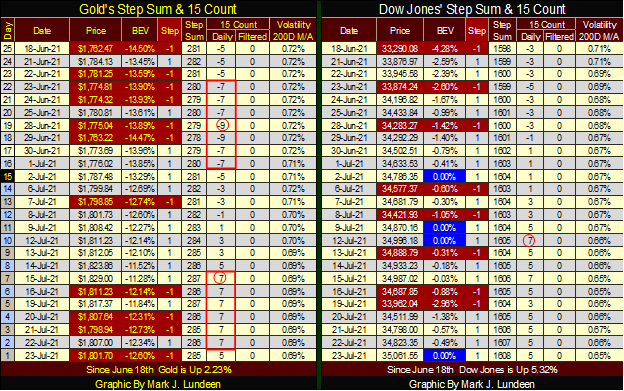
Looking at gold in its step sum table below, it’s been overbought for a few days with its 15 count of +7. It may be a while before we see anything exciting from the old monetary metals. And gold at a new all-time high by the close of August? It’s still doable, but less likely with the passing of each week in July. First, we have to get gold to break above its BEV -10% line ($1855), and then we’ll see what is to follow.
In any event, it’s reasonable expecting gold’s 15 count to come down from the +7 seen below. If gold can do that and maintain it price above $1800 that would be impressive.
As far as the Dow Jones is concerned; the Force is with them. Meaning, the Federal Reserve currently isn’t interested in seeing the venerable Dow go down. So, it’s upward and onward for the stock market until the FOMC just doesn’t have it in them anymore.
We’ll all know when that happens; as their pending inability to manipulate market valuations, will I’m sure, prove to historically spectacular. Mr Bear will provide the fireworks.
—
(Featured Image by sergeitokmakov via Pixabay)
DISCLAIMER: This article was written by a third party contributor and does not reflect the opinion of Born2Invest, its management, staff or its associates. Please review our disclaimer for more information.
This article may include forward-looking statements. These forward-looking statements generally are identified by the words “believe,” “project,” “estimate,” “become,” “plan,” “will,” and similar expressions. These forward-looking statements involve known and unknown risks as well as uncertainties, including those discussed in the following cautionary statements and elsewhere in this article and on this site. Although the Company may believe that its expectations are based on reasonable assumptions, the actual results that the Company may achieve may differ materially from any forward-looking statements, which reflect the opinions of the management of the Company only as of the date hereof. Additionally, please make sure to read these important disclosures.


Youth Cannabis Use in Colorado Is Falling — But the Full Story Is More Complex
The 2026 Colorado survey shows teen cannabis use fell to 10 percent in 2025, down from 21 percent in 2015....


Morocco’s Growth Holds at 4.6% as Agriculture Offsets Economic Pressures
Morocco’s economy grew 4.6% in Q1 2026, driven by a strong agricultural rebound offsetting declines in industry. Services expanded moderately...


Abivax Shares Surge as New Trial Data Eases Safety Concerns Over Ulcerative Colitis Drug
Abivax shares surged nearly 36% after positive updated trial results for its ulcerative colitis drug obefazimod reassured investors following earlier...


El Dorado Raises $9M to Expand Cross-Border Fintech Platform
El Dorado, a Latin American fintech improving cross-border financial services, raised a $9 million Series A led by Paradigm with...


Bitcoin Stalls Near $60K as Strategy Moves, ETFs Outflow, and EU MiCA Rules Take Effect
Bitcoin hovers near $60,000 with ETF outflows, while Strategy boosts reserves, sells BTC, and raises dividends to reassure investors. Ethereum...
 |
|
 |  |
 |
|
-

 Crowdfunding2 weeks ago
Temotiva Launches Crowdfunding Campaign to Advance Preventive Mental Health
-
 Fintech12 hours ago
El Dorado Raises $9M to Expand Cross-Border Fintech Platform
-

 Crypto1 week ago
Bitcoin Holds Steady as Microtransactions Surge and ETF Inflows Continue
-

 Biotech2 weeks ago
AseBio 2025 Report Highlights Growth and Future Potential of Spanish Biotechnology