Featured
The bear’s eye view of two bear markets
The Dow Jones’ 200 count closed the week at 25. During the sub-prime mortgage crisis it peaked at 82 on 04 June 2009, and during the Great Depression bear market it peaked at 103 on 29 April 1932.We saw a nice rebound in the Dow Jones this week (after it broke below its BEV -35% level last week). But then this week the FOMC also “injected” $258.39 billion into the financial system.

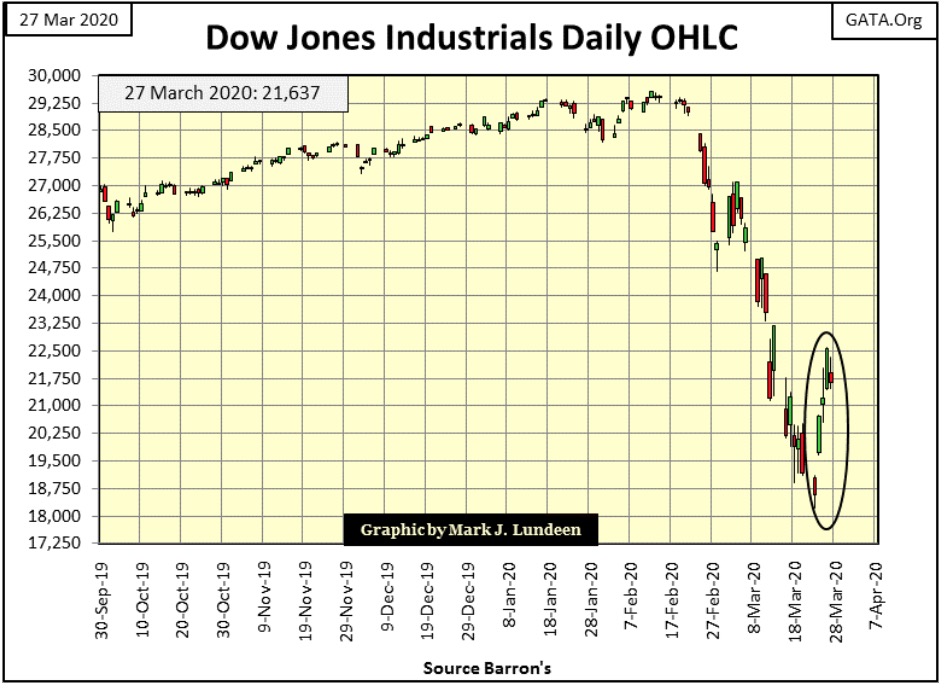
Let’s begin this week with the daily bars chart for the Dow Jones. What’s there to say except since February 21st, market volatility has become historic. This week from Monday’s close to the close of Thursday (the high of the week) the Dow Jones advanced 3,960 points, or 21.3% in just three trading sessions!
During the bull market it may have taken the better part of a year to advance the Dow Jones by 21.3%. Now looking at the Dow Jones below, we see a three day 21.3% advance from Monday’s to Thursday’s close? Does that look bullish to you; that things will soon be back to normal? Really?
People really don’t like change, so they’re slow accepting it when it comes. Point being before the huge increase in volatility in late February, people (including me) would have a hard time accepting the volatility seen in the market we’ve now had for the past five weeks. In the first few weeks of this market decline, people were most likely feeling more than a bit uncomfortable. But now in week five of this bear market we’ve accepted the change and now feel comfortable with it; especially after a week as we’ve had this week.
Meaning, if you’re getting bullish on this market; well you shouldn’t be as the stock market never advances as much as it does during bear markets. Mr Bear is just getting started, and he has as much time as it will take to complete his program of market hygiene.
And what is Mr Bear’s program of market hygiene? I Recall the attitudes of personal finance of my grandparents who survived the Roaring 1920s and depressing 1930s during a time of their lives where they were raising children. On my father’s side as city dwellers and on my mother’s as North Dakota sharecroppers during the dustbowl days; later in life, they were very reluctant to take on debt. If possible, they’d save money to paid cash for things like cars or they went without.
And it wasn’t just them. Until the baby boomers came of age in the 1970s, thrift was a virtue. Fifty years later all too many people don’t know the definition of thrift, let alone how to practice it.
That’s a bad attitude that’s resulted in most people now reaching retirement age to be completely unprepared for a few months of self-quarantine, let alone actual retirement. Read all about it in The Hill article below.
We live in a world where people are more concerned about maintaining their credit scores than achieving financial independence. A humble financial independence has little appeal in today’s world. People for decades have chosen to leverage their income with more debt than is good for them to enable a better lifestyle in an upscale community or to just own a prestigious automobile. What other options do they have? Living debt-free in a modest neighborhood just isn’t what people do.
These are the people Mr Bear is going to target during this bear market, and that goes for corporations and local governments that have also lived beyond their means via debt these past decades.
We really don’t understand what this bear market is all about. Every week I show charts of market valuations and interest rates to illustrate what Mr Bear is doing. But big-bear markets are actually about correcting the bad habits people and society have taken on during the good times. By that standard; in March 2020 there remains a lot of error for Mr Bear to correct, and the stock market is going to suffer for it in the next few years.
Most people would look at the Great Depression bear market and see how it had deflated the Dow Jones 89% from 1929 to 1932, and that’s true. But during the Great Depression’s market crash Mr Bear changed people’s perspective on debt and credit long before the Dow Jones saw its ultimate bear market bottom in July 1932. I expect the same will be true for our big bear market before it hits its ultimate market low sometime in the future.
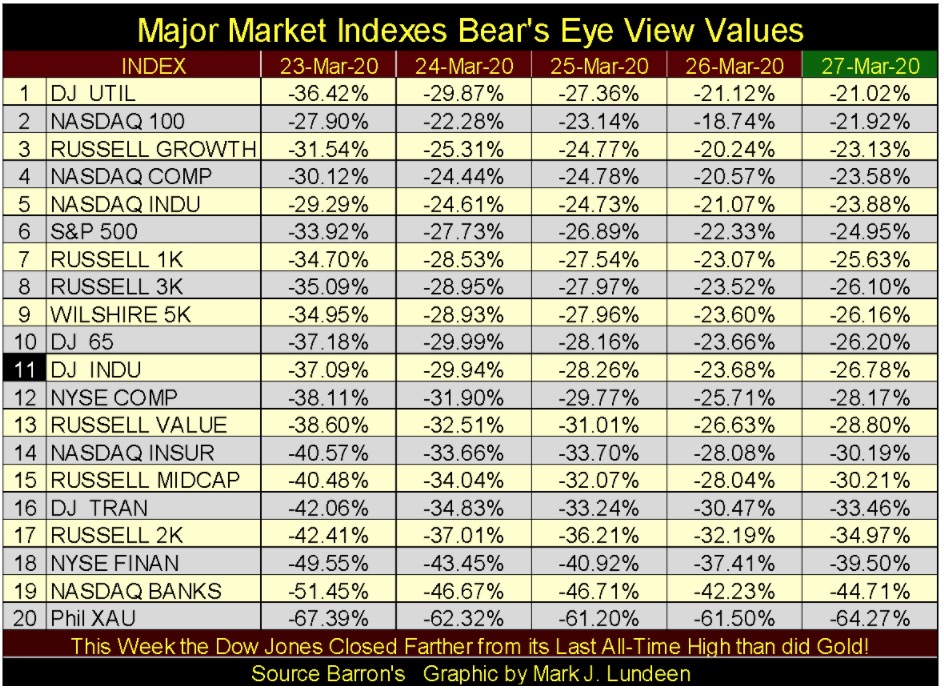
Okay, all that was interesting, but how did the stock market do this week? Looking at the BEV values for the major market indexes I follow below, they all did good. Maybe this week’s advance is the dead-cat bounce I was expecting. If it is, it will be only a sucker’s rally.
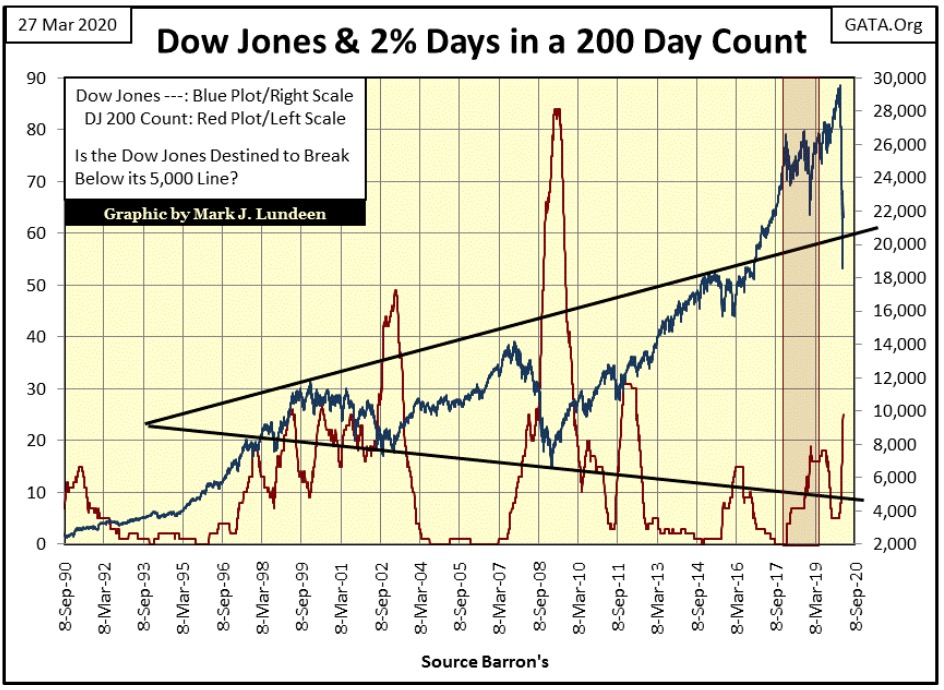
One thing I got 100% correct was the advance that began in March 2009 would terminate should daily volatility for the Dow Jones (2% days) begin to pile up in the Dow Jones 200 count. As seen below, that is exactly what has happened. And it doesn’t matter whether those extreme days advance or decline by 2% or more from a previous day’s closing price (or a three day 21.3% advance), rising volatility in the stock market is ALWAYS BAD.
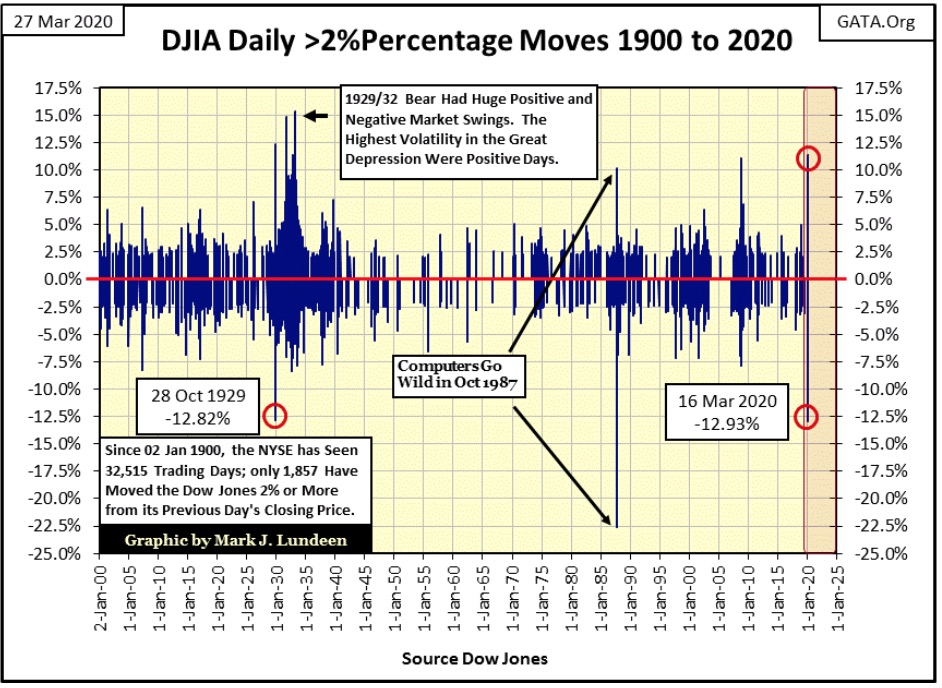
Tuesday of this week the Dow Jones saw a positive 11.37% day of extreme volatility. That exceeds the positive 11.08% day of extreme volatility seen on 13 October 2008 during the sub-prime mortgage market meltdown. We have to go back to the depressing 1930s in the chart below to see a day of positive-extreme volatility that exceeded last Tuesday’s.
Take a look at the chart below; these big daily advances are all big-bear market events. So the market advanced a historic 3,960 points this week; well that’s not necessarily good. An advance like that is just another worthless promise of better things to come from Mr Bear.
Looking at Mr Bear’s report card below; the extreme market events:
- NYSE 70% A-D days (extreme breadth);
- Dow Jones 2% days (extreme volatility);
have been coming fast & furious since February 21st.
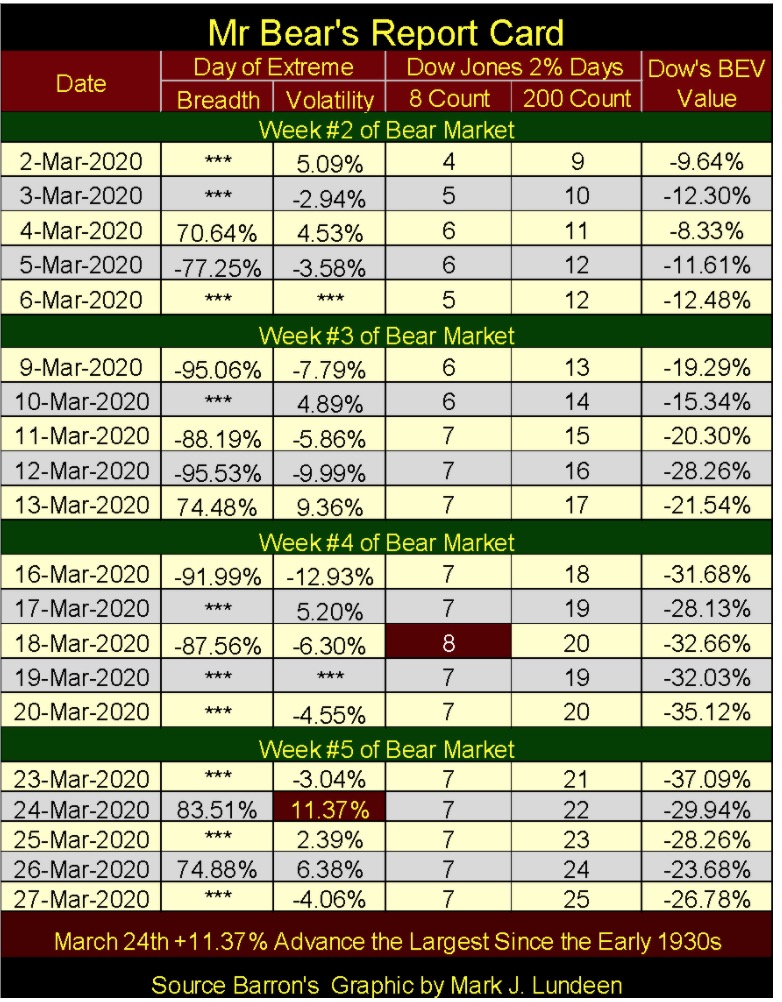
With the Dow Jones seeing extreme volatility daily for the past five weeks, its 8 count in Mr Bear’s Report Card above has been at 7 or above since March 11th. The most an 8 count can do is increase to eight days of extreme volatility in its eight-day count, as it did last week. The thing to watch for now is when it will once again see zero extreme days as its count. That will happen a couple of times before this bear market is over, but the Dow Jones’ 8 count won’t stay at zero for long.
The Dow Jones’ 200 count closed the week at 25. During the sub-prime mortgage crisis it peaked at 82 on 04 June 2009, and during the Great Depression bear market it peaked at 103 on 29 April 1932.
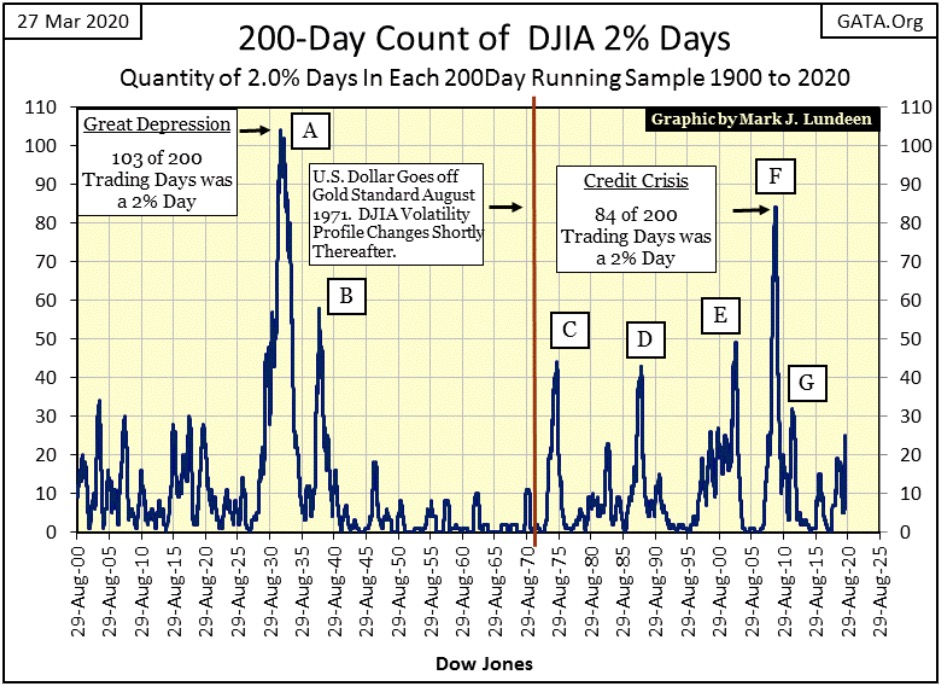
Looking at the Dow Jones’ 200 count in the chart above, we are very early into this bear market. So this is no time to be looking for “bargains” to buy at the NYSE or NASDAQ.
But maybe if you are a nimble trader who understands any advance from here on in is at best only temporary, we may be seeing an opportunity to make some profits in the next few weeks or possibly even the next few months.
I’m looking at the NYSE 52Wk Highs and Lows below. Within the red box, from March 6th to March 23rd the stock market saw a selling panic that sent the NYSE 52Wk H-L Nets below -2000 three times. That plus by March 23rd (last Monday) the Dow Jones saw its latest 52Wk Lows of the bear market; but note the NYSE 52Wk H-L Net for that day: only 803 net 52Wk Lows, and the nets for the rest of the week contracted to double digits.
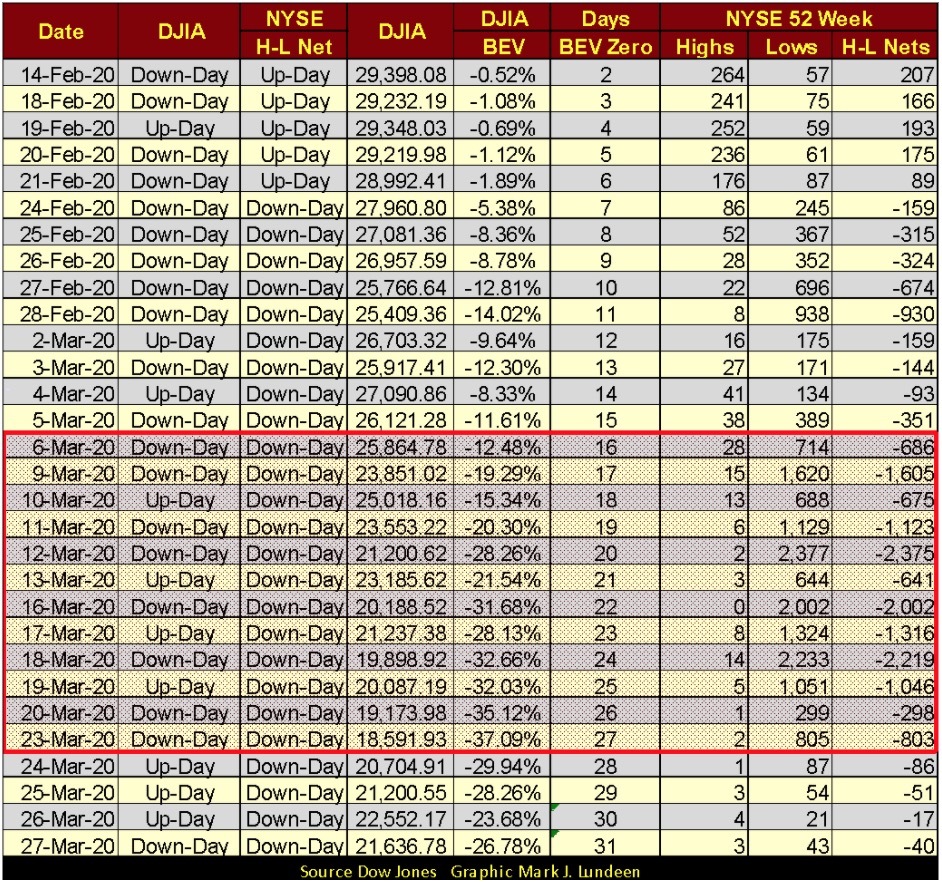
What does that mean? That when the Dow Jones made its last 52Wk Lows last Monday, much of the market had already bounced off their 52 Wk Lows from last week.
This doesn’t mean the bear market is over. But a profitable trading opportunity appears to be at hand. Just remember, unlike the fine upstanding people like you and me, people who would never bite a hand that feeds us, Mr Bear does that all the time. So should a trade go against you, be quick to close it out.
I first saw what I now call the Bear’s Eye View (BEV) in a Dow Theory Letter by Richard Russell sometime in 1994. A fellow reader had constructed one for the S&P 500 containing about a decade of data and sent it along to Mr. Russell who published it. It was a bare bones chart; still, I found it extremely interesting. Sorry to say Mr. Russell never took it up, I never saw it used in the Dow Theory Letter again.
I had begun compiling data from old Barron’s issues, and after figuring out the mechanics of it, and applying it to several market series I had, well I fell in love with it. So no, I didn’t invent the Bear’s Eye View technique, but I’ve pushed it far beyond where I first saw it and made it available to anyone who reads my articles.
I call it the Bear’s Eye View as that’s what it is; a view of a market series as Mr Bear sees it. Each new all-time high is converted into a 0.00%, and never more, as that’s all Mr Bear thinks of any new all-time high: a Big-Fat Zero. So, I call each new all-time high a BEV Zero. Any data point NOT a new all-time high register as a percentage claw back from its last BEV Zero.
So the Bear’s Eye View is one of the new all-time highs, and percentage clawbacks from those new all-time highs as it compresses decades of data within a range of only 100%:
- 0.00% for new all-time highs, and never more than that;
- -100% for a total wipeout in valuation, and it can’t go lower than that.
Here’s a BEV Chart for the Dow Jones for our entire bull market which began in August 1982. Each BEV Zero (0.00%) is a new all-time high, but in October 1982 the Dow Jones had only to rise above 1040 to accomplish that; a price level from decades ago that would appear insignificant when charting the Dow Jones in dollars today.
What would also be insignificant when plotting the Dow Jones in dollars are three 35% corrections seen in the BEV view of the Dow Jones since 1982. Whether from a Dow Jones’ BEV Zero of:
- 2,641 in October 1987;
- 11,723 in January 2000;
- 14,164 in October 2007;
the market saw a 35% clawback by Mr Bear as an important market event. It was as if someone took it upon themselves to reverse the market decline and resume the bull market advance.
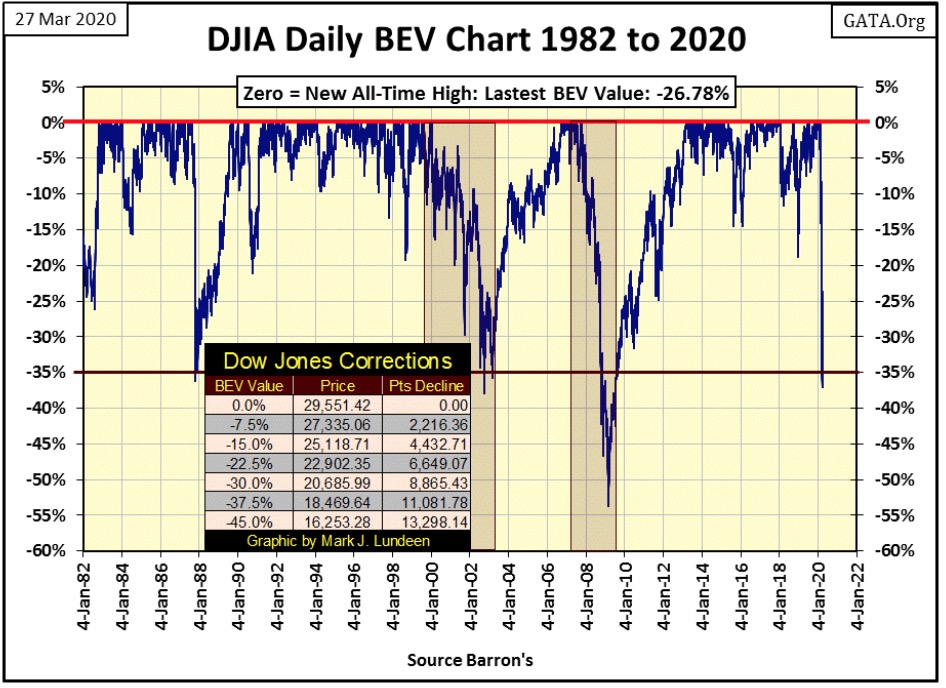
And I can tell you exactly who since 1982 hasn’t liked seeing the Dow Jones decline below its BEV -35% line – the fountainhead of “liquidity” inflating this market bubble; the Federal Reserve as it makes them look bad.
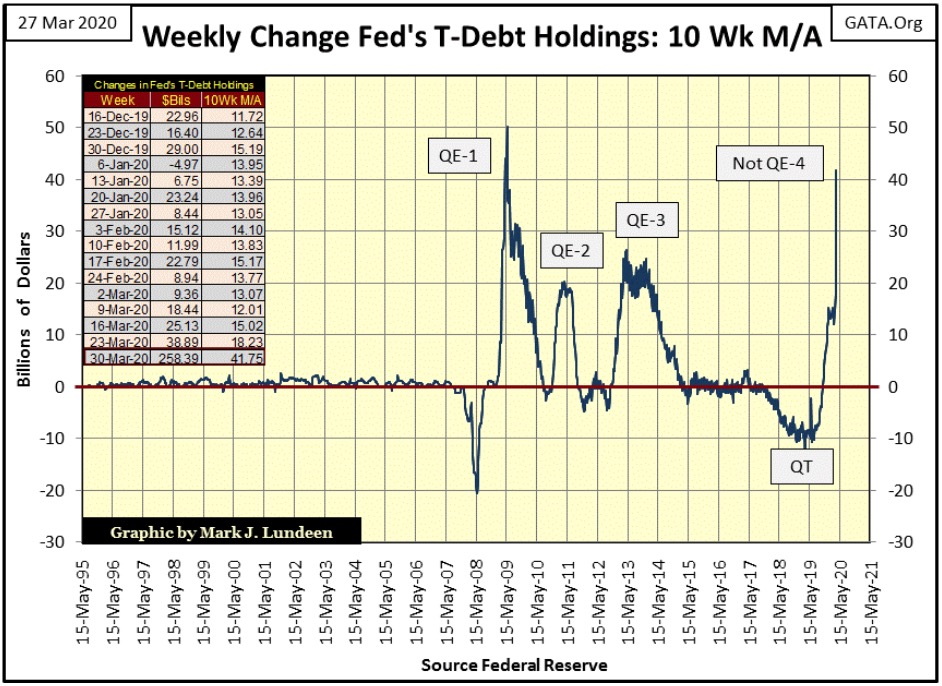
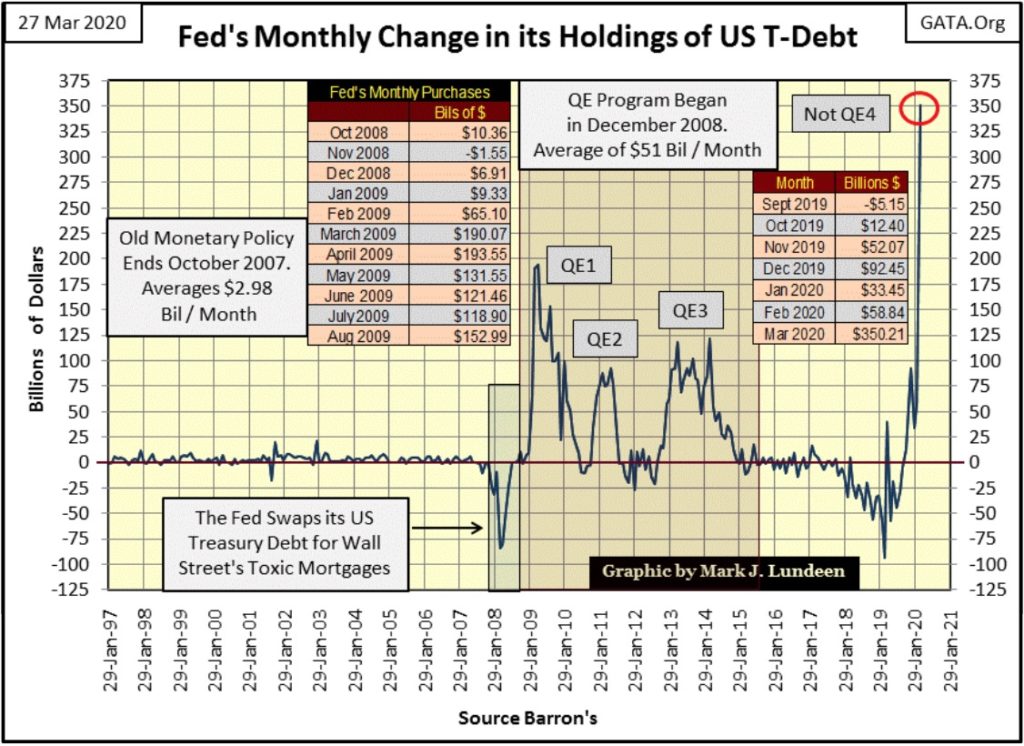
We saw a nice rebound in the Dow Jones this week (after it broke below its BEV -35% level last week). But then this week the FOMC also “injected” $258.39 billion into the financial system, as seen in the below chart’s table. The financial media is always quick to point out market firsts; but they were pretty quiet about the historic $258.39 billion dollars “injected” into the financial system this week.
The chart’s plot is for a 10Wk M/A, and this single massive “injection” of “liquidity” more than doubled the 10Wk M/A from last week (see the table in chart).
Anyway, the Bear’s Eye View is the most efficient charting technique for viewing decades of market data inflated by the Federal Reserve’s “monetary policy”, as a dollar today IS NOT the same dollar of yesteryear.
Barron’s in its 21 August 1961 issue complained about the cost of the new aircraft carrier for the Navy, the USS Kitty Hawk (CV 63); at $250 million it was over budget. In 2020 one can’t buy a destroyer for less than a few billion, but in 1961 a billion dollars could buy four carriers.
The main factor in the rising cost in naval construction (and everything else), is between 1963 and today are the six decades of “monetary policy” from the Federal Reserve that separates them. Oh, by the way in Barron’s 21 August 1961 issue the Dow Jones closed at 723.54. In those same six decades of “monetary policy” the Dow Jones was inflated up to 29,559 on February 12th of this year.
* A sidebar on the Federal Reserve *
This is interesting. I don’t know if it’s true but it is interesting: a website I follow that tracks Q-Anon Posts called “And We Know” has posted the following where the US Treasury has absorbed the Federal Reserve, an action (as per the post below) which makes President Trump the factual Fed Chairman from now on.

As per Gunny Torres, the retired Marine who manages the site, Trump has a plan to liquidate much of the global debt by forcing the Federal Reserve to absorb it. So, instead of everyone owing money to the central banking cartel, Trump plans to make the central banks owe money to everyone else before he bankrupts them and have their now worthless assets liquidated in bankruptcy court.
There’s more to it than what I just explained, so you’ll have to watch the link to see what Torres is talking about. Whether this is true or not we’ll just have to wait and see, but the idea of stripping everything away from the Federal Reserve System and driving them into bankruptcy is a very attractive proposition to my ears. These people really hate President Trump, but then President Trump really hates them too!
* Now back to the Bear’s Eye View *
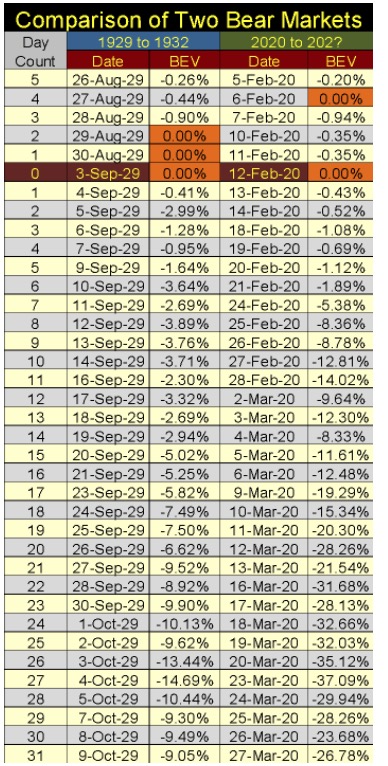
As a BEV plot ignores inflated valuations, looking only at BEV Zeros and market clawbacks from them, we can compare one bear market with any other. For instance, the bear market of the Great Depression with ours, as seen in the table below.
In the Day Count, the Red 0 is what is called the Terminal Zeros (TZ), or the last BEV Zero of these two significant bull markets, which in 1929 was on September 3rd and in 2020 on February 12th. The rising daily count from these TZs record the day-by-day bear market declines.
What’s interesting with the 1929_1932 bear is by day 31 the Dow Jones closed down by less than 10% from its TZ. In October 1929 that would soon change, but with our bear market (yes this is a bear market) the Dow Jones broke below its -30% BEV line on day 22 of the market decline. This giant-sucking sound in the stock market must have caught the FOMC’s attention, and you can see their panic reaction to it in the chart above, a historic one-week “injection” of $258 billion into the banking system.
Next, I’ve plotted the BEV series from the table above, which for our bear market is only up to day 31 of the market decline. This week’s “injection” of “liquidity” from the FOMC has had its effect on the Dow Jones, springing it back above the BEV -35% line since Monday’s BEV of -37.09%. But how long will this latest fix of monetary heroin keep the bulls from suffering withdrawal?
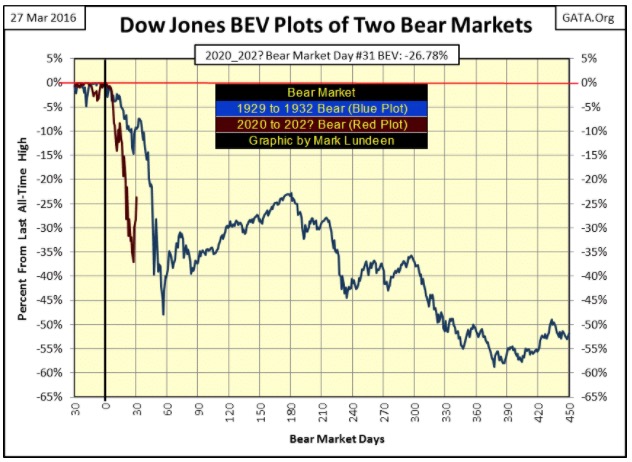
That’s a question we’ll have to wait for an answer to. But looking at the current bear market above (Red Plot) after this week’s 12 BEV-point advance I’m wondering just how much of this dead-cat bounce can be left?
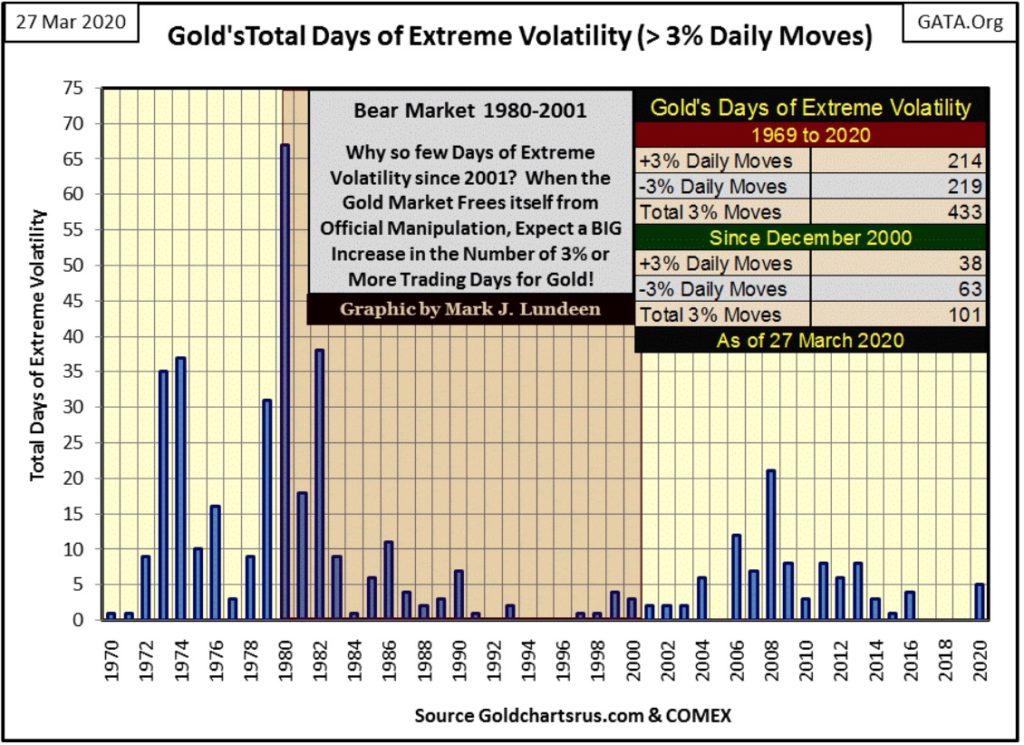
Monday this week saw gold move UP 6.39% and silver UP 12.43%. This is the first positive extreme day of volatility (3% day) for gold since 2016. Seeing how the Federal Reserve is now flooding the global economy with staggering increases in dollars, I’m sure we won’t have to wait another three years for gold’s next positive 3% day. Anyway, as seen below so far this year, gold has seen five days of extreme volatility (3% days), and I like it!
And exactly how staggering is the current flood of dollars flowing from the FOMC? Just take a moment to study the chart below plotting the monthly changes in the Federal Reserve’s holdings of US Treasury debt. The source of this data is the same I used in the weekly chart above; Barron’s. But Barron’s gets it from the Federal Reserve’s own weekly H.4.1 report.
Since the end of February, the FOMC has “injected” $350.21 billion dollars of “liquidity” into the financial system, with $258 billion of that just this week. Yep – since 1982 the dudes at the FOMC don’t like seeing the Dow Jones deflate below its BEV -35% line.
So far, the price of gold hasn’t responded to this vast tsunami of “liquidity” rushing into all things financial. But then the price of gold has been Fake News for decades. It seems it’s becoming difficult to buy gold in coin shops as they are running out of stock, or more likely holding back inventory from the market until the managed prices at the COMEX gold market begin to reflect the reality of our inflationary times.
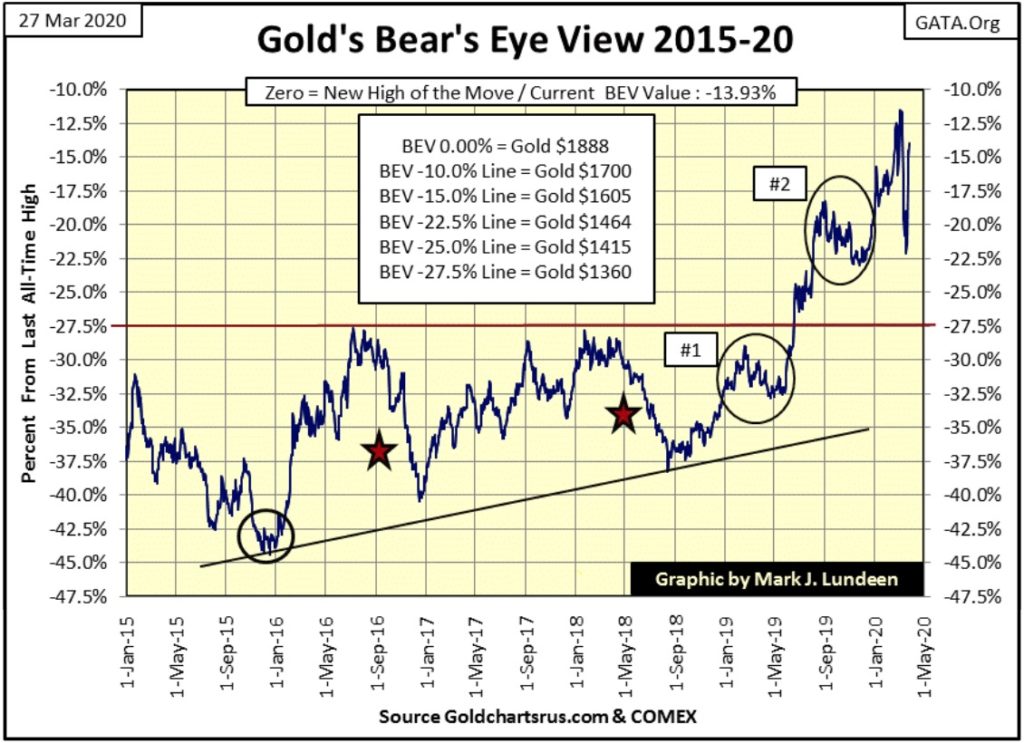
It wasn’t just the Dow Jones that saw a nice price rebound this week. Last week gold closed below its BEV -20% line; this week it closed above its BEV -15% line. That’s a 9.51% advance or a one-week price increase of $141. And to think that last week there were some people who were fearful of gold’s bull market being terminated by Mr Bear!
I don’t know if this growth spurt in the price of gold will continue into next week; but with the Federal Government now planning to send out $1200 checks to most American citizens sometime in the next few weeks, I’m hopeful it will.
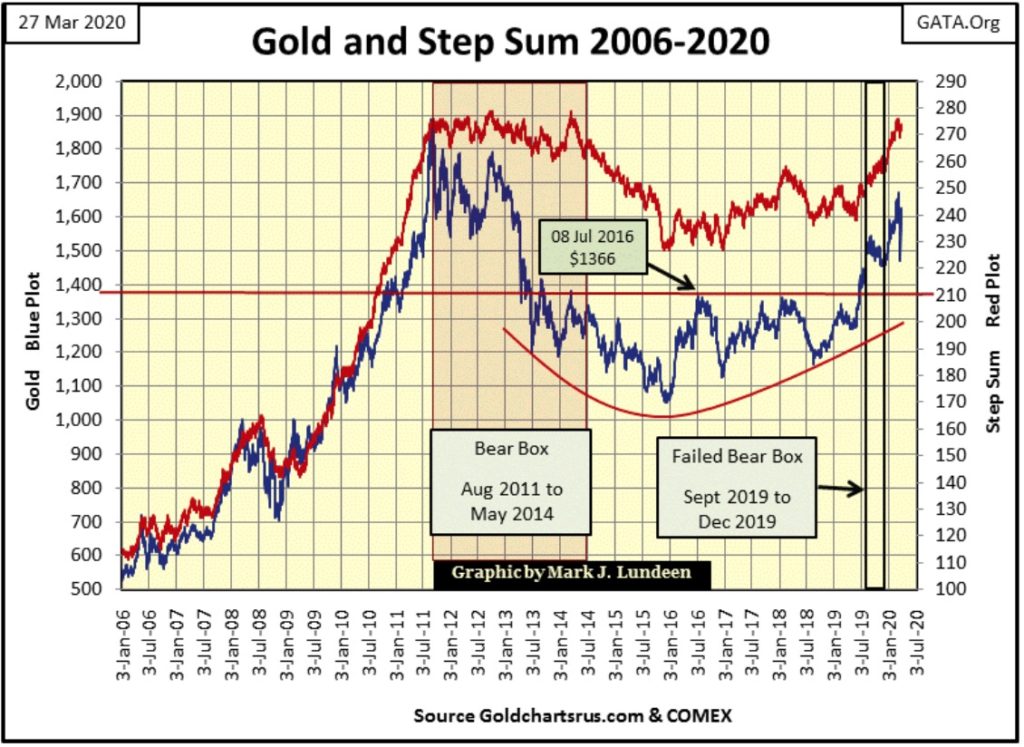
Not much has changed in gold’s step sum chart below. The big decline in the price of gold from two weeks ago was mostly canceled out after last week, as seen in gold’s BEV chart above. I think I can say in the gold market; that market reality as seen in the price of gold is heading up, as is market sentiment as seen in gold’s rising step sum.
I’m not going to set any dates, but I expect before we see this summer’s greenery fade away next autumn, the price of both gold and silver will be much higher than they were at the close of this week.
Of the $1200 President Trump is sending to most of us, the best thing you could do is spend it on some silver coins. But if one has bills to pay; pay your bills.
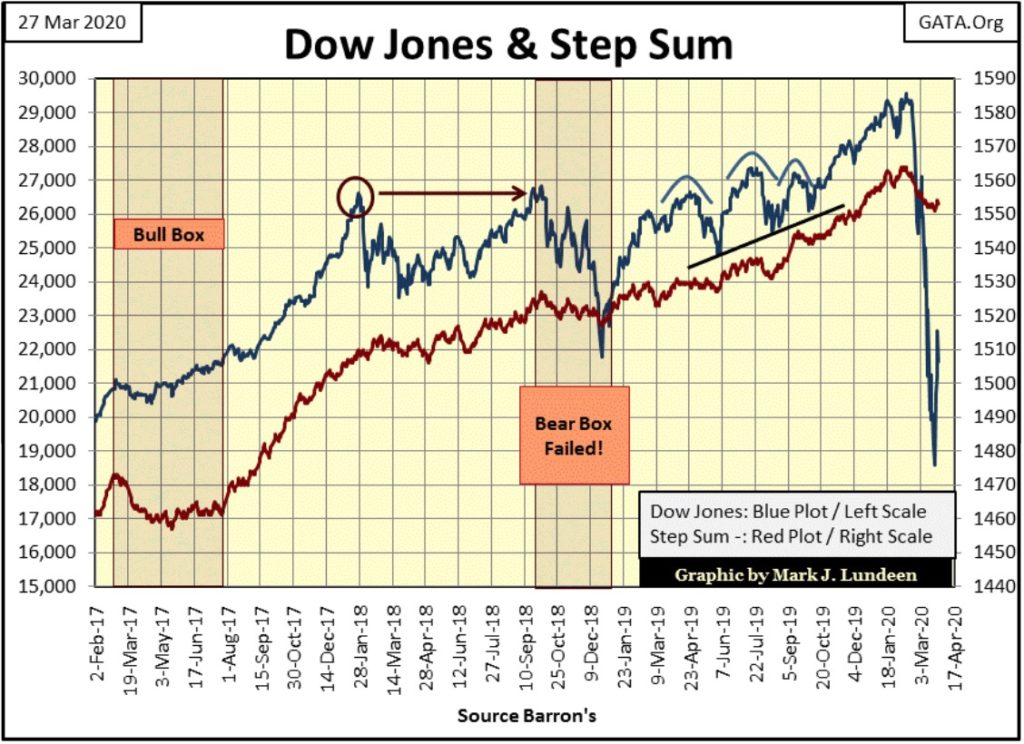
The Dow Jones with its step sum plot below has nothing new for me to comment on. Let’s see how much more this bear market correction has to go in the weeks to come.
Since February 24th, the price of gold and its step sum has been declining. Gold’s 15 count declined to a -7 on March 18th. That’s an oversold market; and since then gold has recovered nicely. I see good things coming for both of the old monetary metals in the coming weeks.
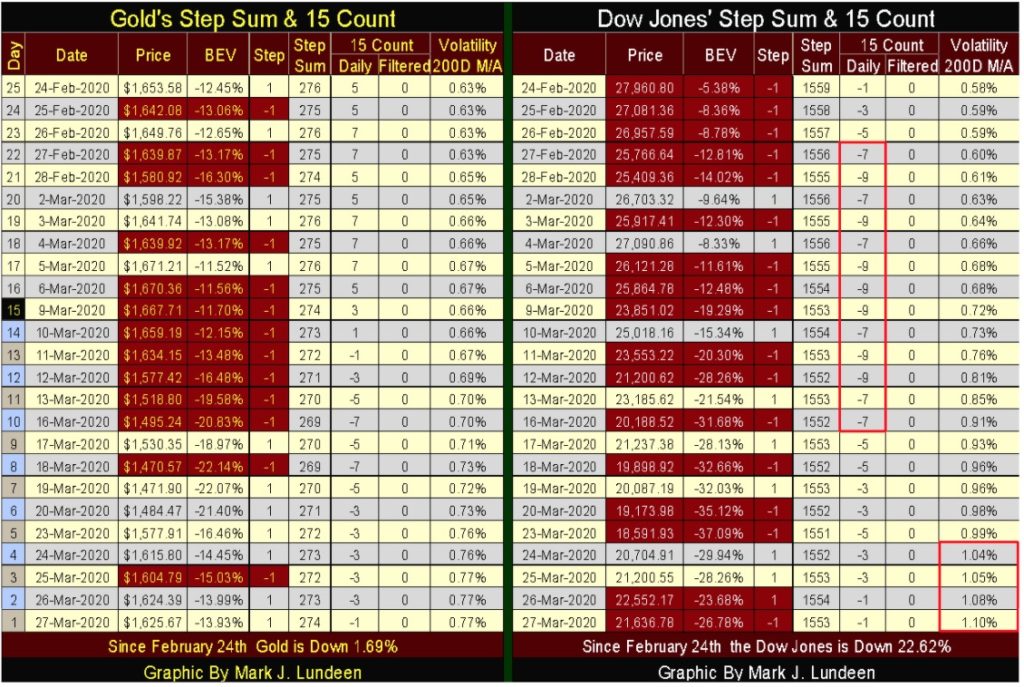
The most obvious problem for the Dow Jones in its step sum table above is that since Monday of this week, its daily volatility’s 200 Day M/A increased to above 1%, a doubling from a month ago. As a dark alley is for a pedestrian, there is nothing good to be found for the stock market when the Dow Jones daily volatility rises above 1%.
That’s all true, but I wouldn’t be surprised seeing the stock market up for the next few weeks. No bear market goes on without a few exciting advances that people confuse with a return of the old, but now very dead-bull market. I think we are due for one of those advances now.
—
(Featured by Ishant Mishra on Unsplash)
DISCLAIMER: This article was written by a third party contributor and does not reflect the opinion of Born2Invest, its management, staff or its associates. Please review our disclaimer for more information.
This article may include forward-looking statements. These forward-looking statements generally are identified by the words “believe,” “project,” “estimate,” “become,” “plan,” “will,” and similar expressions. These forward-looking statements involve known and unknown risks as well as uncertainties, including those discussed in the following cautionary statements and elsewhere in this article and on this site. Although the Company may believe that its expectations are based on reasonable assumptions, the actual results that the Company may achieve may differ materially from any forward-looking statements, which reflect the opinions of the management of the Company only as of the date hereof. Additionally, please make sure to read these important disclosures.


XRP Under Pressure Amid Macro Forces, Fed Policy, and Regulatory Shifts
XRP remains under pressure despite easing geopolitical tensions, as macroeconomic factors and Fed policy dominate market sentiment. Liquidations and high...


Edison Accelerates Renewable Growth and ESG Impact in 2025
Edison reports strong 2025 sustainability progress, boosting renewable investments by 90% to reach 2.3 GW toward a 4 GW 2030...


New Gene Therapies Transform Rare Disease Care, but Gaps Remain
Gene therapies are transforming rare disease treatment, enabling normal lives for some patients. However, only about 6% of 7,000 rare...


Temotiva Launches Crowdfunding Campaign to Advance Preventive Mental Health
Temotiva Innovación Lab has launched a crowdfunding campaign through Santander X Explorer, marking a new phase for the University of...


Fed Policy Shift Raises Concerns Over Debt and Inflation Risks
The Federal Reserve is criticized for resuming balance sheet expansion through Treasury purchases despite expectations of tighter policy under new...
 |
|
 |  |
 |
|
-

 Impact Investing1 week ago
Eni Advances Energy Transition with Major Investment and Emissions Cuts
-

 Biotech5 days ago
AseBio 2025 Report Highlights Growth and Future Potential of Spanish Biotechnology
-

 Africa2 weeks ago
Côte d’Ivoire Cocoa Price Crisis: Record Decision Turns into Market Breakdown
-
 Biotech5 hours ago
New Gene Therapies Transform Rare Disease Care, but Gaps Remain