Featured
Bull or bear? US markets reports mixed amid Japanese Yen’s fall
Is the US experiencing a bear market rally or is the bear correction over, with the market is resuming the bull market that started back in March 2009?

Don’t we just love a bear market rally? Or is it? Since the markets made a low on December 24, 2018, the S&P 500 has rallied some 13.6 percent, the Dow Jones Industrials (DJI) is up 13.4 percent, and the TSX Composite has jumped 11.1 percent. The broad-based NYSE is up 12.8 percent. Pretty impressive. But to put it in perspective, the S&P 500 is still down 8.8 percent from its high close, the DJI is off 7.9 percent, the TSX Composite is down 7.6 percent, and the NYSE down 8.2 percent. Is the glass half-full or half-empty? Is the bear market over and the bull resuming, or is this, as we have claimed, merely a bear market rally?
It is probably no surprise we are seeing a mix of analyst reports that are either calling this a bear market rally or saying that the bear correction is over and the market is resuming the bull market that started back in March 2009. In examining various indicators, the story is definitely mixed and arguments could be made defending both.
The S&P 500 made a lower low—below the February 2018 low, but the advance-decline line did not confirm as it made a higher low. The advance-decline has taken out its 50-day MA and taken out the downtrend line from the highs—a positive development. The S&P 500 has taken out its 50-day MA but is now just approaching the downtrend line from the highs. Normally, in a bear market, the advance-decline line should be leading the way down. (Note that, on the NASDAQ, it was the opposite as both made lower lows with the NASDAQ advance-decline leading the way down thus confirming the drop in the market).
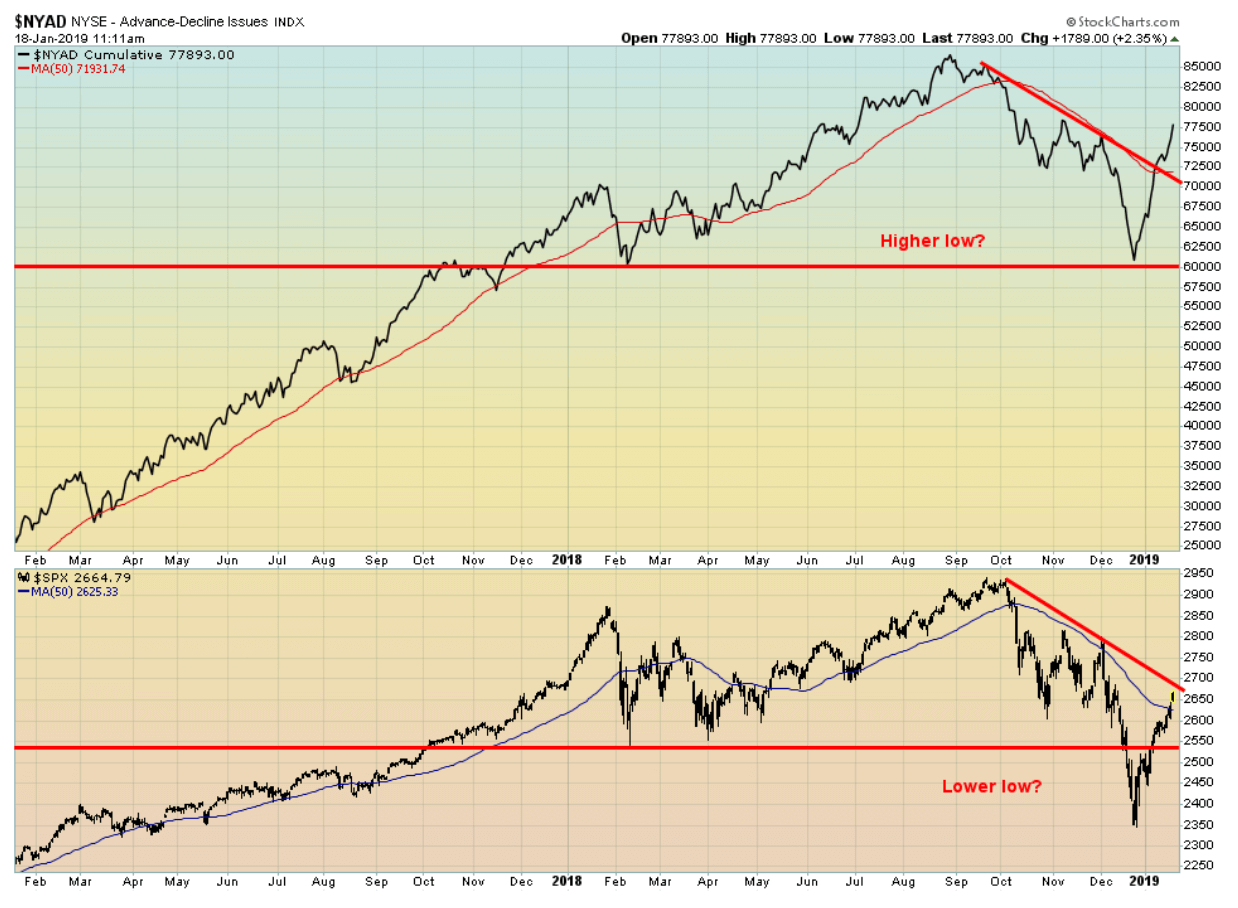
NYSE Advance-Decline Line Index © David Chapman
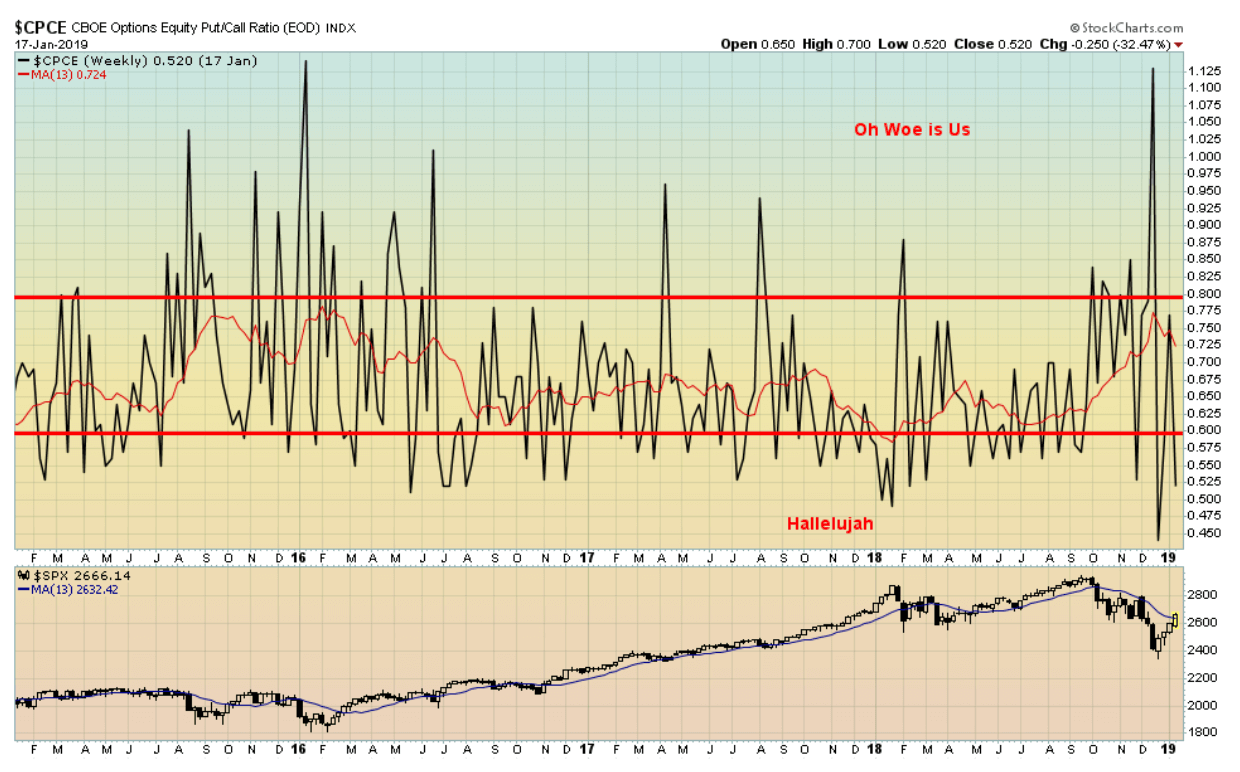
Another measurement is the CBOE equity put/call ratio. The weekly chart of the CBOE options equity put/call ratio shows the ratio is still in ‘’hallelujah’’ territory as the market has rallied 10 percent but remains off its highs. That suggests to us that we should be cautious now as the market has quickly turned bullish from bearish. Note, at the recent low, the market was quite bearish in ‘’oh, woe is us’’ territory. At 0.525 the ratio is at levels seen at the highs back in January 2018. The spike in the put/call ratio into bearish territory was seen on December 17, 2018, at 1.13.
So, we have an advance-decline line giving off bullish signals and a put/call ratio suggesting the market has gotten too bullish too fast. Has the market gotten ahead of itself and is now more bullish than it was at the top back in January? The number of stocks trading above their 200-day MA on the S&P 500 is still only at 35 percent, up from the low of 10.8 but well off the high seen in late September 2018 at 73.2.
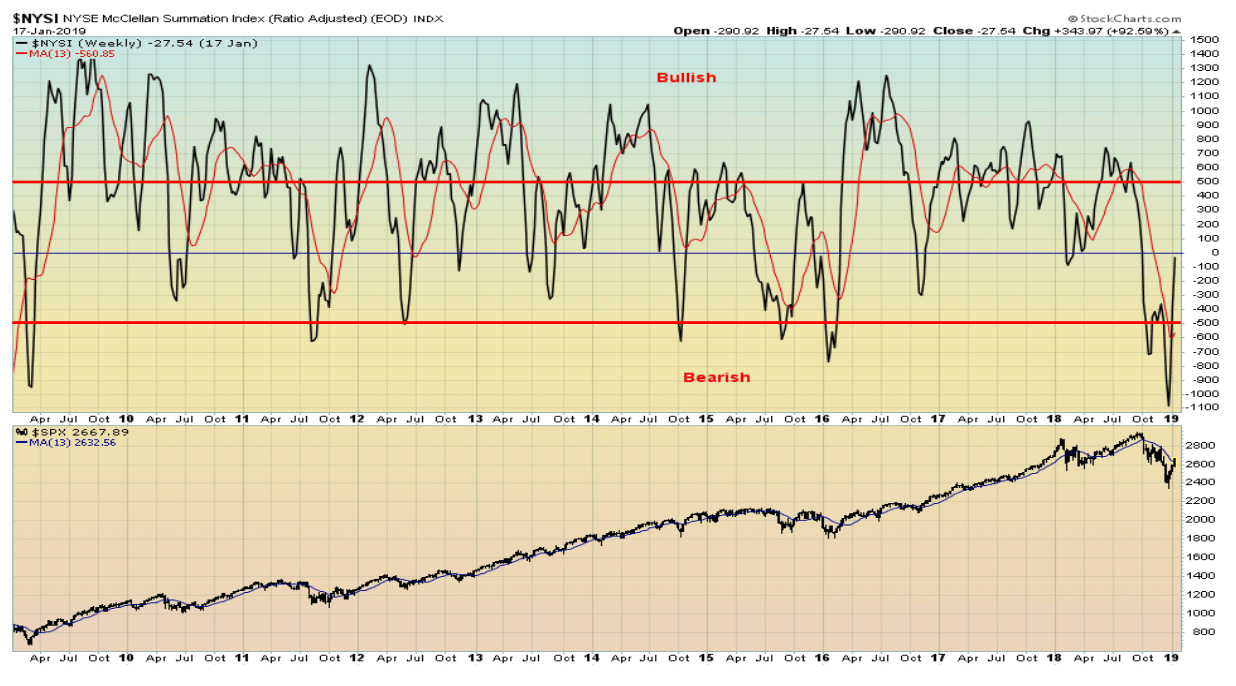
Another measurement we look at is the NYSE McClellan Summation Index (ratio adjusted) (RASI). The RASI is kind of a companion piece to the McClellan oscillator (a market breadth indicator that evaluates the balance between advancing stocks and declining stocks: the Summation Index is a long-term version of the McClellan oscillator). On the week of January 7, 2019, the McClellan Oscillator soared to +117.6. That was a level higher than anything seen over the past 10 years, including many ongoing all-time highs that were made, particularly during 2017 and to the major top in January 2018.
It is even more interesting because, on the week of January 5, 2009, during what was another bear market rally the McClellan Oscillator hit 121.9. By March 2009 the markets hit new lows. The RASI is nowhere near bullish territory. Yes, it has rebounded off its bearish lows, but it is still in negative territory. The divergence with the McClellan Oscillator suggests to us this is no more than a bear market rally and the markets could, once they turn down again, hit new lows.
CBOE Options Equity Put/Call Ratio © David Chapman
Bear markets are tricky creatures. Bear market rallies are designed to bring as many back into the market as possible. Both the bear markets of 2000–2002 and 2007–2009 saw numerous rebounds following a sharp drop. The most famous bear of all, 1929–1932, initially saw the S&P 500 plunge 28.9 percent from September to December 1929. That was followed by a rally of 16.1 percent into April 1930. The market then fell another 75 percent into July 1932 with only shallow recoveries along the way. But that was a pretty straight-down affair into the depths of the Great Depression.
Both the 2000–2002 high-tech/dot.com bear and the 2007–2009 financial crisis bear were much choppier, as the charts below attest. Following the major top in the S&P 500 in March 2000 until the final low in October 2002, there were nine drops, ranging from ones of 33.9 percent to 6.7 percent. Bear market rallies ranged from 26.4 percent to 8.2 percent. The March 2000 high was never taken out on any of the subsequent rallies. The biggest drop occurred near the end, from March 2002 to July 2002. The ‘’Black Swan’’ event was September 11, 2001 (aka 9/11).
NYSE McClellan Summation Index (Ratio Adjusted) RASI © David Chapman
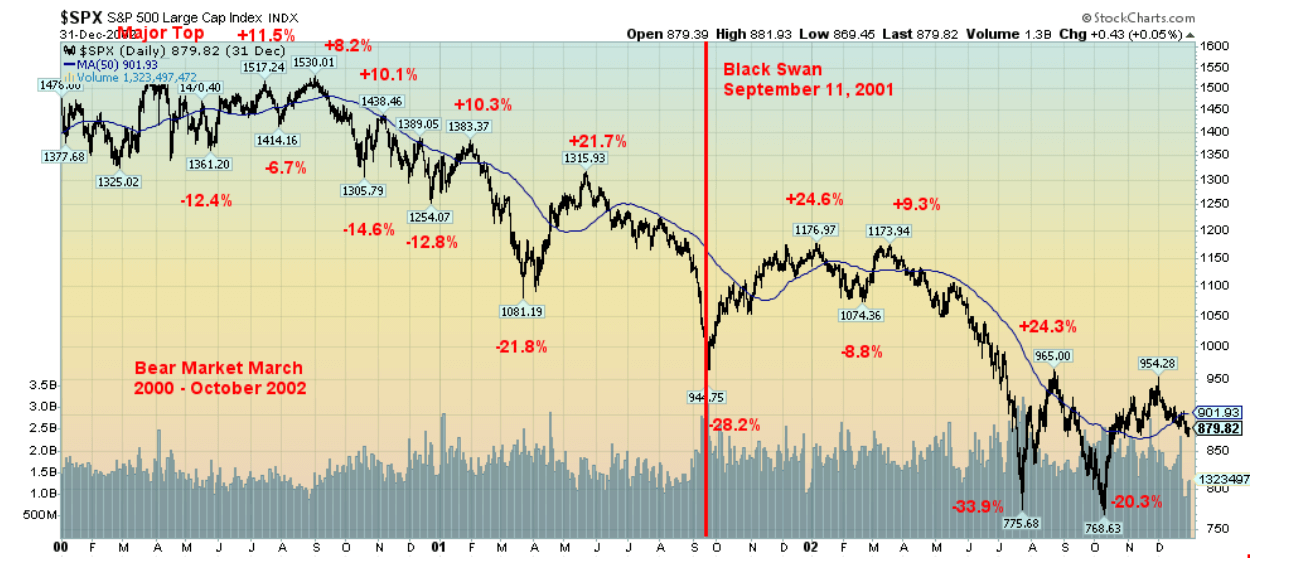
Bear Market March 2000 – October 2002 © David Chapman
Similarly, the bear market from October 2007 to the final low in March 2009 saw seven significant declines followed by six rallies. The declines ranged from as much 36.1 percent to 10.8 percent, while the rallies ranged from 8.3 percent to 27.3 percent. The biggest drop was from August 2008 to October 2008, centered around the ‘’Black Swan” event of the Lehman Brothers collapse. The biggest rally was from November 2008 to January 2009 when the market gained 27.3 percent and everyone thought the bear was over. Well, not quite as the market collapsed another 29.3 percent into the final low in March 2009.
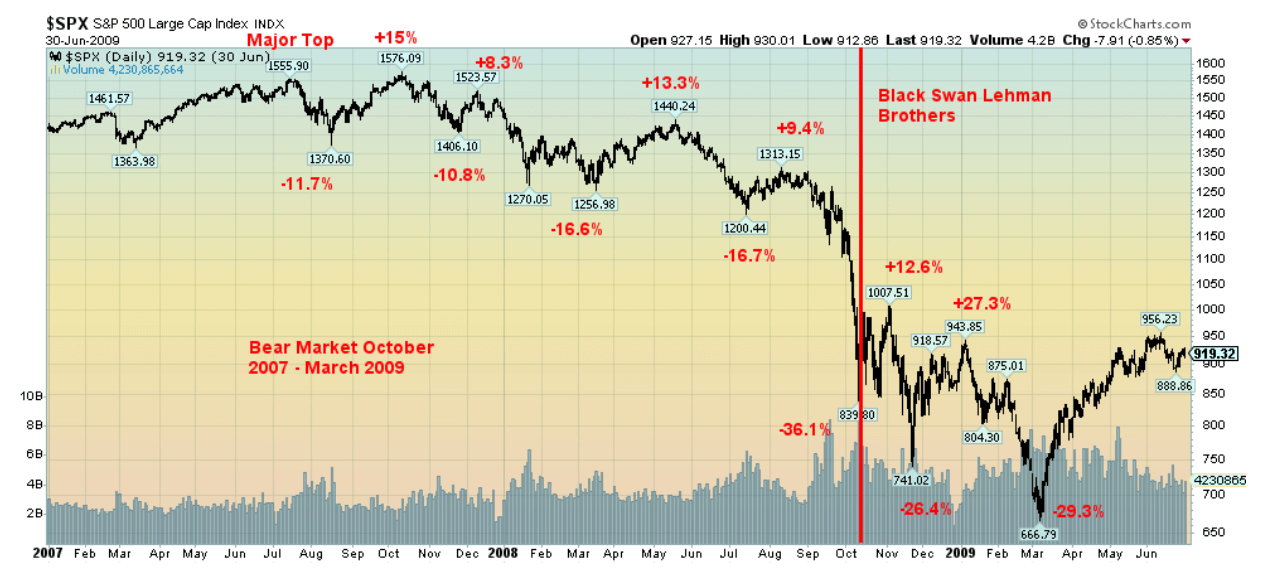
Bear Market October 2007 – March 2009 © David Chapman

Bear Market? 2018 -? © David Chapman
The bear market that got underway in October 2018 is quite young. It is, so far, only four months old. We have not had any major drop except for the 16.2 percent decline into December 2018. So far, the rally looks impressive, but it has crawled back to just above the 50-day MA, a level often tested in bear market rallies. Indicators are mixed with some appearing bullish and others still bearish.
So, as we asked at the outset—are we in a bear market rally, or are we returning to the bull market of 2009–2018? After nine years and only two relatively shallow corrections, the negatives are piling up. Right now, the market is all excited that the U.S. and China will somehow resolve their trade differences. China has even conceded some points and will buy more U.S. exports.
But, as we have seen with Trump in the past, the “goalposts” can suddenly be moved again. Then there is the debt, slowing economies in the EU, Japan, and China, the shutdown in the U.S. that is dragging on with seemingly no solution, and a Mueller investigation that could still blow up, given the most recent revelation of former Trump lawyer Mickey Cohen apparently being paid to rig web polls for Trump (assuming it is not “fake news” as is being claimed). The potential for a dragged-out impeachment remains.
Military tensions continue between the U.S. and Russia and the U.S. and China that are most likely not going to go away. The EU is also in crisis with the U.K. wrapped up in the Brexit, France under siege from the “yellow vests” and numerous anti-EU governments in power. Led by Germany, there are signs the EU could be sliding into recession. Then again, there is the debt—$250 trillion, the real elephant in the room that no one wants to talk about but as the global economy slows debt collapses usually follow.
Bear market rallies are designed to drag everyone back in, believing the worst is over. Given the sub-par volume seen since December, we remain convinced this is no more than a bear market rally. For traders, bear market rallies present opportunities; for investors, not so much. As we noted earlier, markets were universally down in 2018. The likelihood is that few investors made money. The rally into January has everyone optimistic again. It is at the high point of optimism that the bear suddenly bares his claws once again. We’ve had no pullback along the way. If we are truly returning to the bull, then we need to see the nature of a pullback. That will give us a better clue as to how this might play out.
Markets and trends
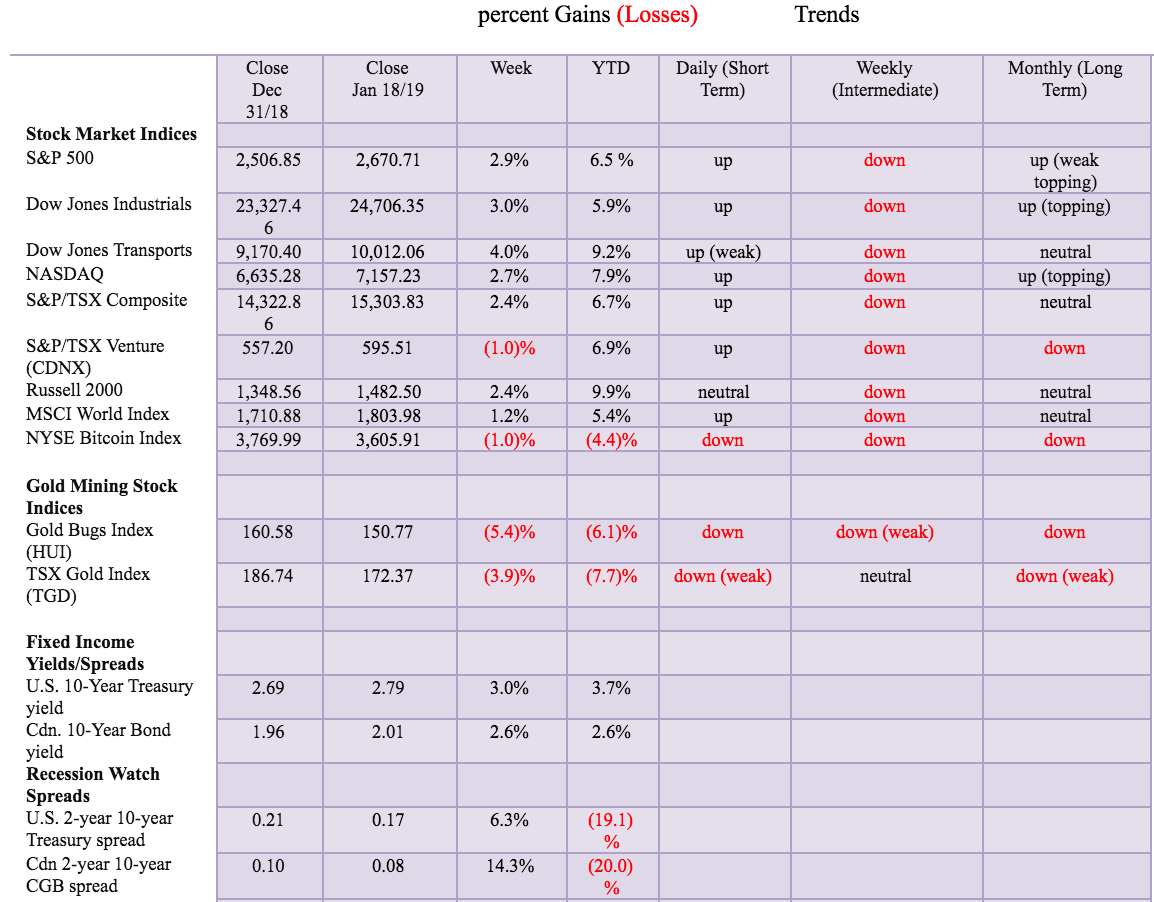
Note: For an explanation of the trends, see the glossary at the end of this article.
New highs/lows refer to new 52-week highs/lows. © David Chapman
© David Chapman
In the past week, stock markets around the world have continued their big run-up since December. The Dow Jones Industrials (DJI) gained just under 3 percent, the S&P 500 was up 2.9 percent, the Dow Jones Transportations (DJT) leaped 4 percent and is now up 9.2 percent in 2019, while the NASDAQ was up 2.7 percent. The small-cap Russell 2000 gained 2.4 percent.
Elsewhere, the TSX Composite was up 2.4 percent while the TSX Venture Exchange (CDNX) was one of the few losers, off 1 percent. Internationally, the MSCI World Index gained 1.2 percent, the London FTSE 100 was up 0.9 percent, the Paris CAC 40 jumped 2 percent, while the German DAX gained 2.9 percent.
In Asia, China’s Shanghai Index (SSEC) was up 1.7 percent and the Tokyo Nikkei Dow (TKN) gained 1.5 percent. Despite the impressive gains this month and from the December lows, these markets remain down on the year.
The really big winners were elsewhere. We note that the Ukraine Stock Market (PFTS) gained 67 percent in the past year while the Venezuelan Stock Market (IBVC) was up even more at 155 percent, while the Zimbabwe Stock Market also jumped 67 percent. On a more practical note, Brazil’s Bovespa gained 17 percent. Markets at least love their new right-wing government. Elsewhere, almost everyone was down on the year.
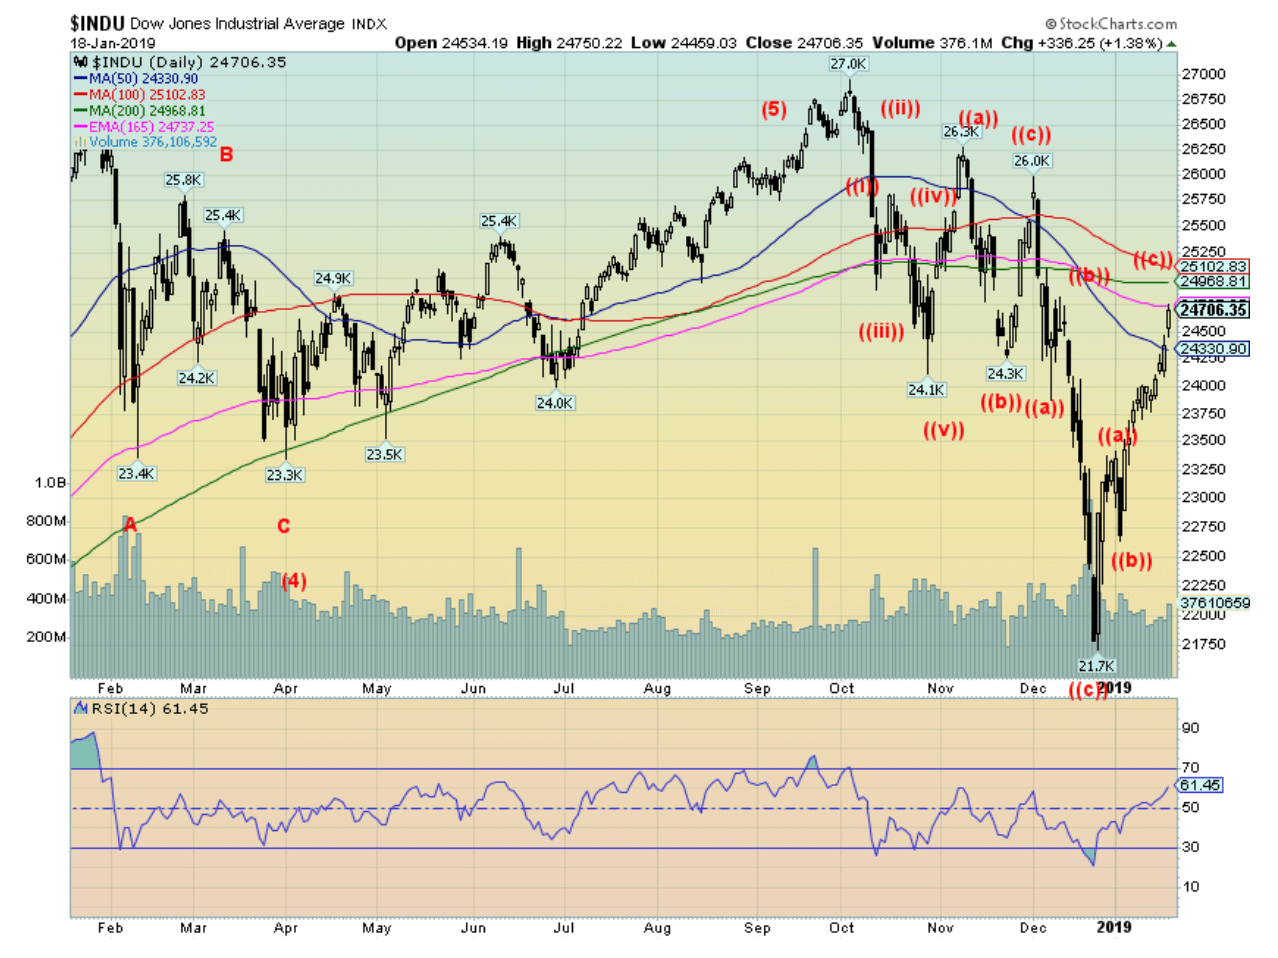
Our attention is drawn to the sharp rally that has taken place since the low on December 24, 2018. It all started with the 1000-point-plus up day on Boxing Day, December 26, 2018. Not long after, the bear market of 2018 was declared dead. Grant you, things were pretty oversold in December with numerous readings on the RSI well under 30 and even under 20. The market has now been up four weeks in a row.
But the wave structure is highly suspect. Markets do not go straight up as we have seen in the past month. While it was a much shorter wave, note the run-up that occurred in October that saw the DJI gain 9 percent quickly. A few weeks later there was another quick run-up that saw the DJI gain a more modest 7 percent. This run has added 13.5 percent in a hurry. As we saw with the previous two quick run-ups, they soon ran out steam and fell on their own volition in almost the same manner they went, which was straight up. They were quickly followed by a straight down move. We expect this too could quickly reverse and run to the downside.
Straight-up moves like this are not sustainable, nor are they normal for a bull market. Bull markets usually plod to the upside, not zoom to the upside. Yes, the market was oversold, but it is not unusual for the market to retest its lows and either make new lows (2009) or higher lows (2003). The structure also appears as an ABC-type move which suggests this is corrective only and not a new impulse wave to the upside. We noted in our essay that the CBOE put/call ratio quickly reverted from heavy on the put side to heavy on the call side. The market is quickly betting on higher prices. They are likely to be disappointed.
© David Chapman
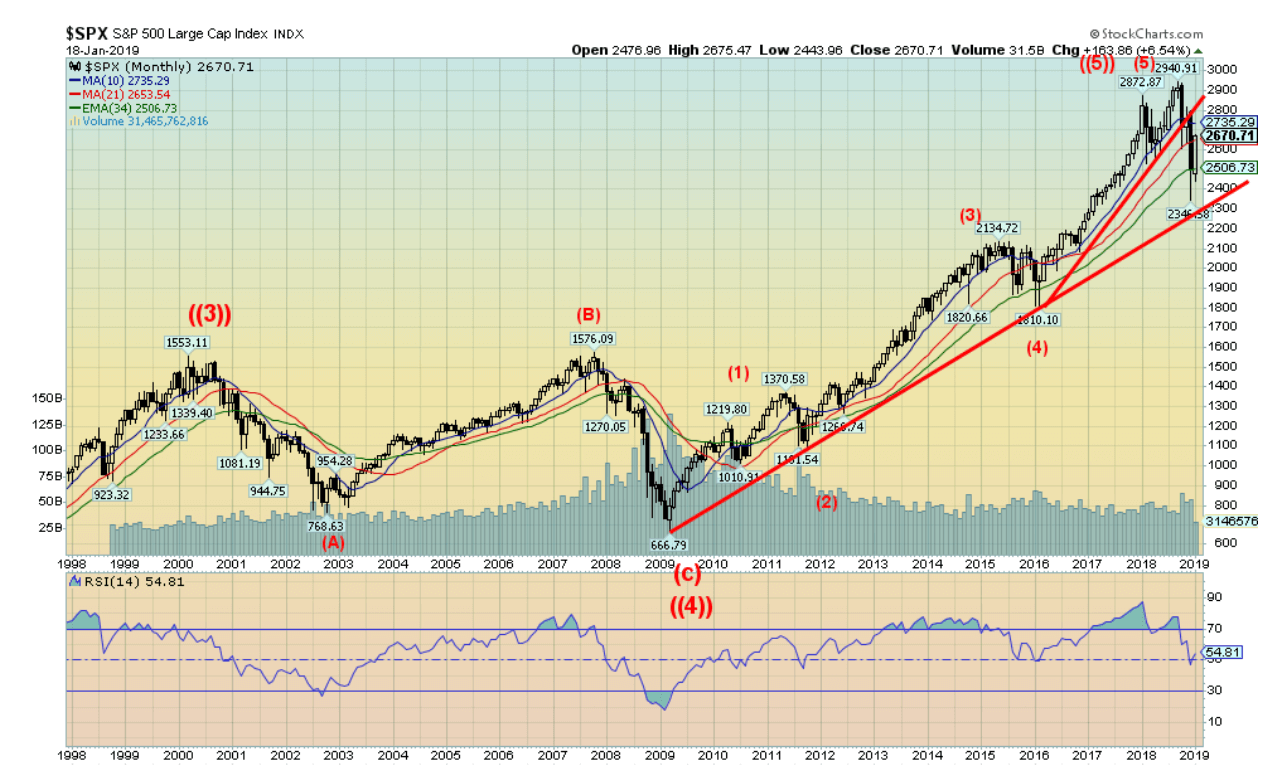
Our long-term monthly chart of the S&P 500 shows that the S&P 500 firmly broke under the uptrend line from the February 2016 low but, thus far, has held the uptrend from the 2009 low. In that respect, declaring that the bull market is dead is, yes, probably premature. It’s not quite dead yet. But it is damaged goods. The S&P 500 is currently testing the 21-month MA but remains under the 10-month MA. Generally, it held the 34-month exponential MA.
As was seen in the 2000–2002 bear and the 2007–2009 bear, the real bear did not get underway until the market closed under the 34-month exponential MA. That doesn’t mean we are suddenly going to resume the 9-year uptrend. Considerable damage has been done and it will take more than an impressive run-up from the December low to suggest this is over. We have noted on our trends that the monthly long-term trend remains up, even as it has been weakened considerably.
The intermediate (weekly) trend remains down, despite the sharp run-up in the past month. Only the short-term trend (daily) turned up this past month. If the S&P 500 can regain above 2,750 then there is an outside chance of a run to new highs. But since the market will be more of a trading market than a consistent investing market going forward, a better trading buy could occur once the market retests its lows.
© David Chapman
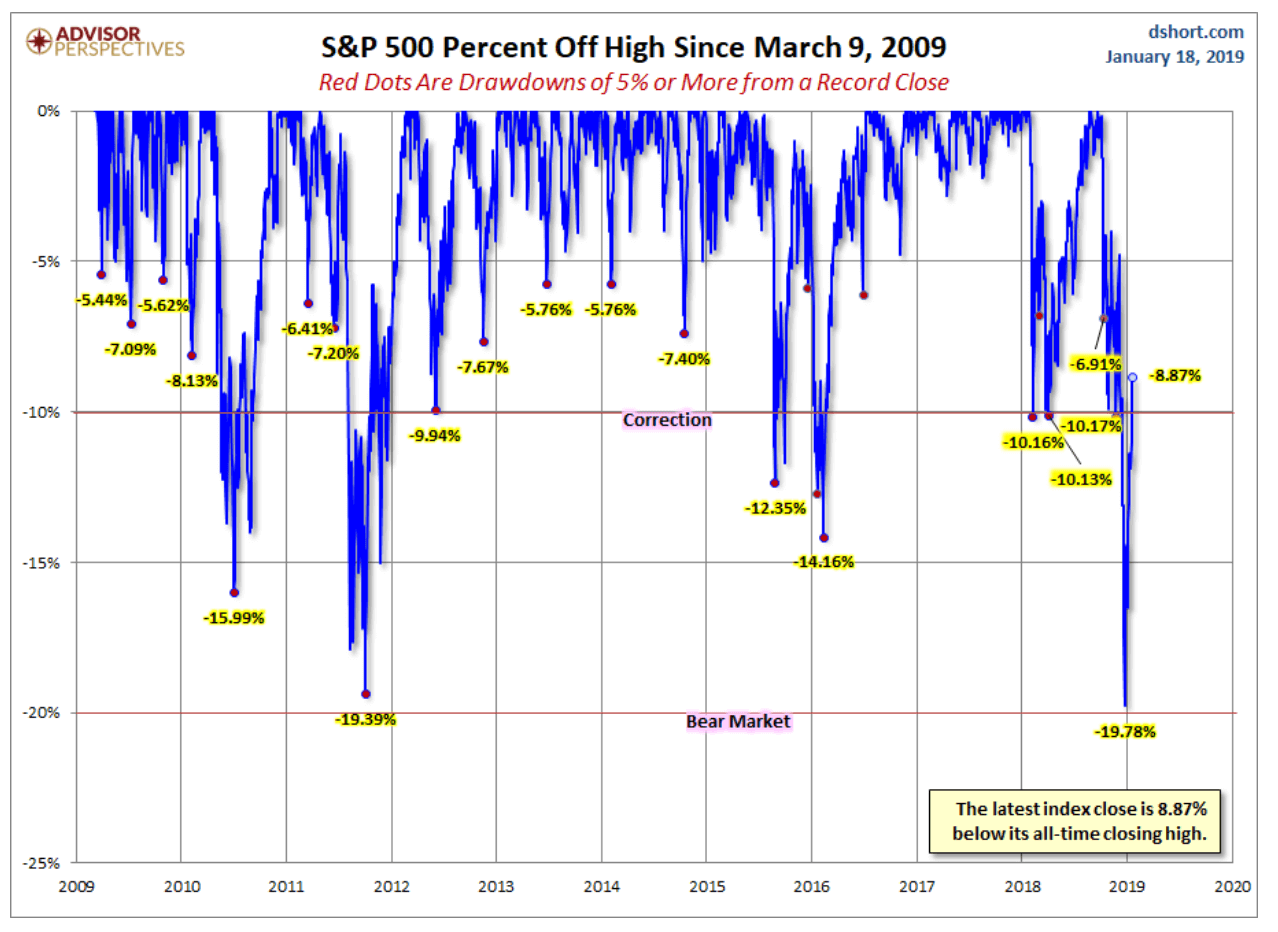
Here is an interesting chart of record highs and sell-offs from those highs over the past several years since the low of March 2009. Most drops fell only into one what the market defines as correction territory (a drop of 10 percent or more), but none fell officially into what one refers to as a bear market (a drop of 20 percent or more). The most recent was the closest at 19.8 percent. Another note is that in 2018 the S&P 500 spent 27 days in correction territory. In 2017, there were no days in correction territory nor were there any in 2013 or 2014, and only five in 2015. Because of the gyrations in the market in early 2016, that year saw 20 days in correction territory.
© David Chapman
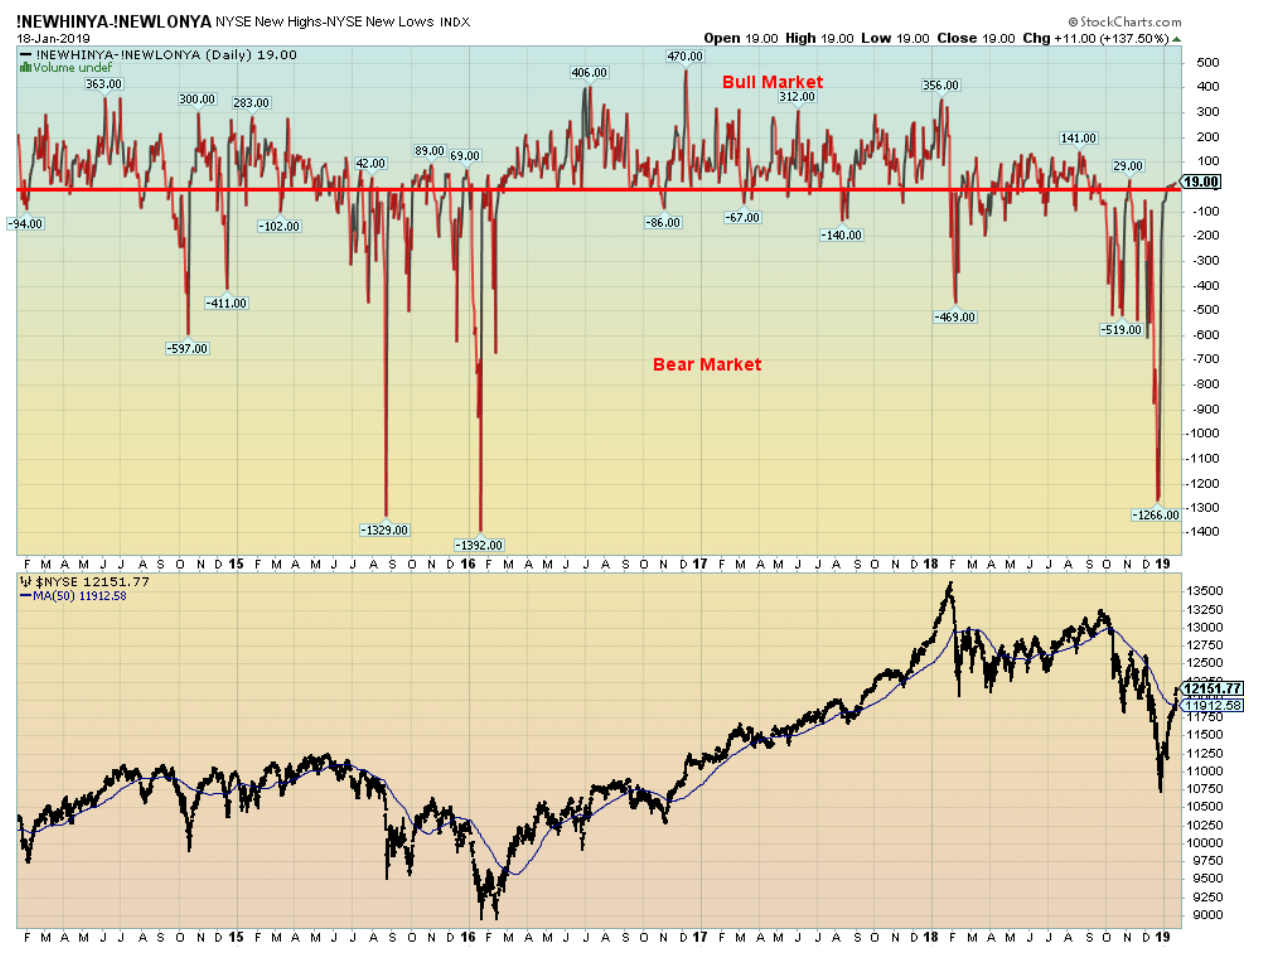
Here is a chart of the NYSE new highs-new lows Index. Note those huge plunges in 2015, 2016, and, more recently, in 2018. Note the plunge in early 2018 that was followed by a return for the index above zero. However, unlike the early period from 2016 to 2018, it was a pretty feeble bull. The current run-up has taken the index to just above zero. What that tells us is, despite the strong rally since December 26 the market has produced balanced new highs and new lows. This is not a strong up move. Nearly all the stocks in the indices remain well off their all-time highs.
© David Chapman
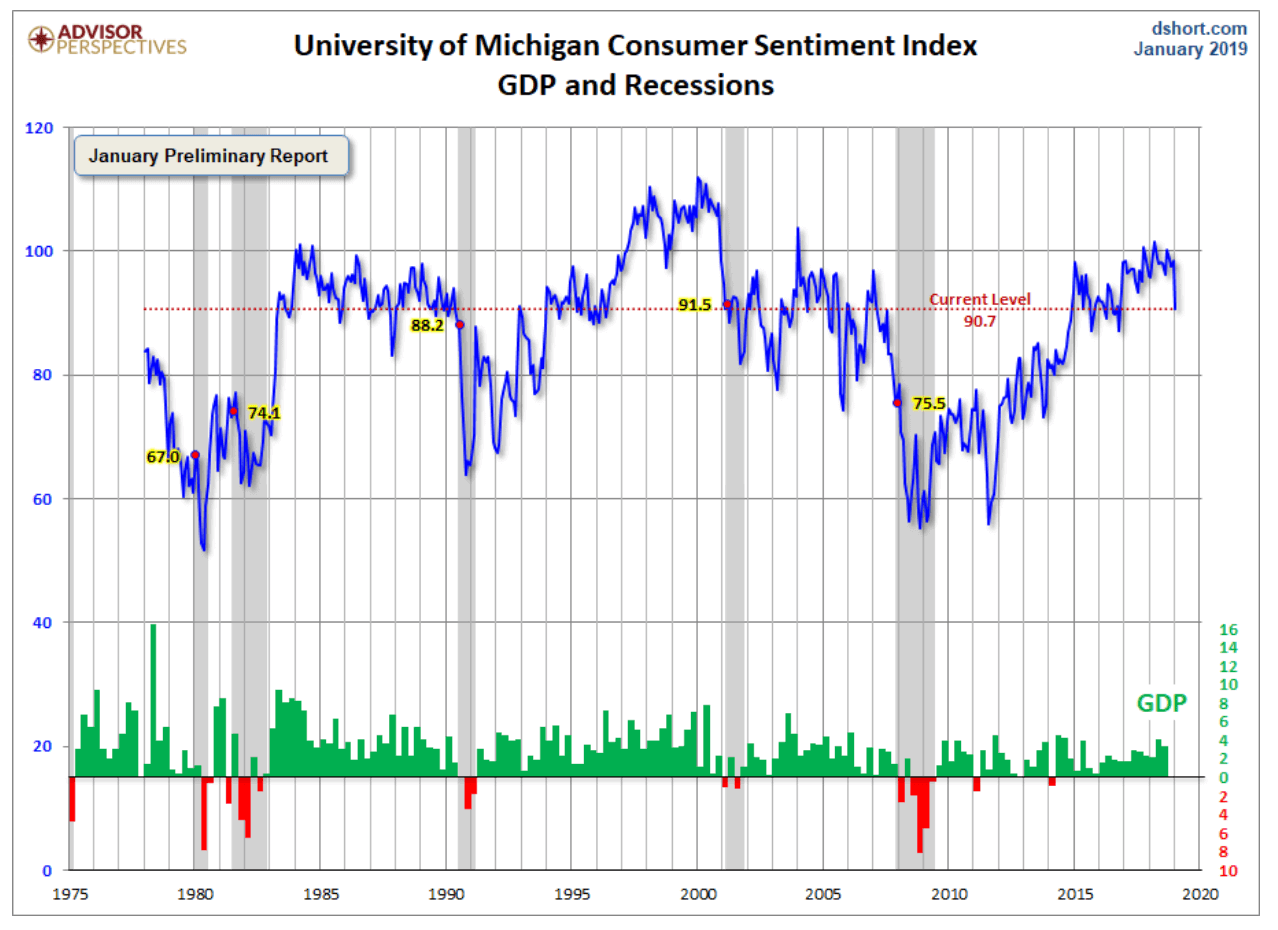
The Michigan Consumer Sentiment indicator took an unexpected dip this past month. The January index came in at 90.7—except the market was expecting a reading of 97. Are consumers losing their mojo? Given the importance of the consumer to the economy, any dip in this index could spell trouble for the economy down the road.
Consumer confidence is at its lowest level since Trump was elected. Cited as reasons for the drop were the government shutdown, the trade wars and the impact of tariffs, the instability in the stock markets, signs of a global slowdown, and confusion over monetary policy, particularly with Trump’s sniping at Fed Chairman Jerome Powell. Despite the drop, the indicator is not yet at levels that might suggest the start of a sustained downturn in the economy.

© David Chapman
It is probably no surprise that margin debt has declined from the lofty levels seen only a few months ago. The latest numbers show that margin debt has fallen 6.5 percent in the past month. This coincides with the drop in the stock market. The data above only goes to the end of December 2018. But note that negative credit balances, while they have improved, still remain at astronomically high levels. We are a long way from the positive credit balances that were last seen in 2008 and 2009 during the financial crisis. Complacency reached such high levels that we soared to record margin debt that exceeded anything seen before including the bursting of the tech bubble and the bursting of the housing bubble.

© David Chapman

© David Chapman
The latest quarterly GDP numbers for Germany saw the German economy contract by 0.2 percent in Q3. We await the Q4 numbers. They are not expected to be particularly good. If they are negative again, Germany will have officially entered a recession defined as two consecutive quarters of negative growth. Germany isn’t the only EU economy suffering negative growth in Q3.
Joining them were Austria, Italy, Sweden, and Switzerland. Not exactly the names one would expect. No Greece, Spain, Portugal, or Ireland, or any of the Eastern European countries who are a part of the Euro zone. China’s GDP growth has been on a downward trajectory now for years. It is now at its lowest since the 2008 financial crisis.
Once again, the Chinese are resorting to pump-priming by pumping liquidity into the financial system. A reminder that Japan has been doing that years and the result is Japanese GDP is negative again in Q3.
© David Chapman
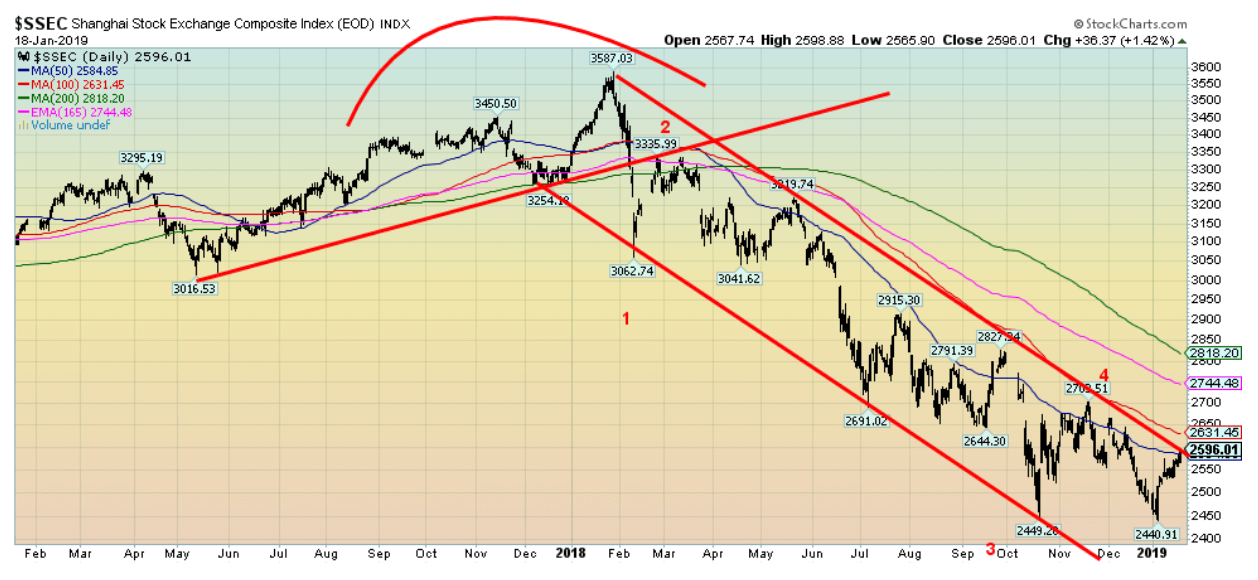
China’s Shanghai Index (SSEC) was one of the worst-performing major indices in 2018, falling 24.6 percent. As with everywhere else, it has jumped since the end of the year.
However, it is once again running into resistance at the major downtrend line. The last low in December was barely below the low seen in October, so there is a chance the index could break out to the upside. This is in keeping with the thought that some of the emerging market indices may be due for at least a corrective move to the upside. It is possible that the SSEC has completed a 5-wave decline from the highs seen in early 2018. A move over 2,650 would suggest further moves to the upside and a corrective wave underway. Major resistance is up at 2,800.
© David Chapman
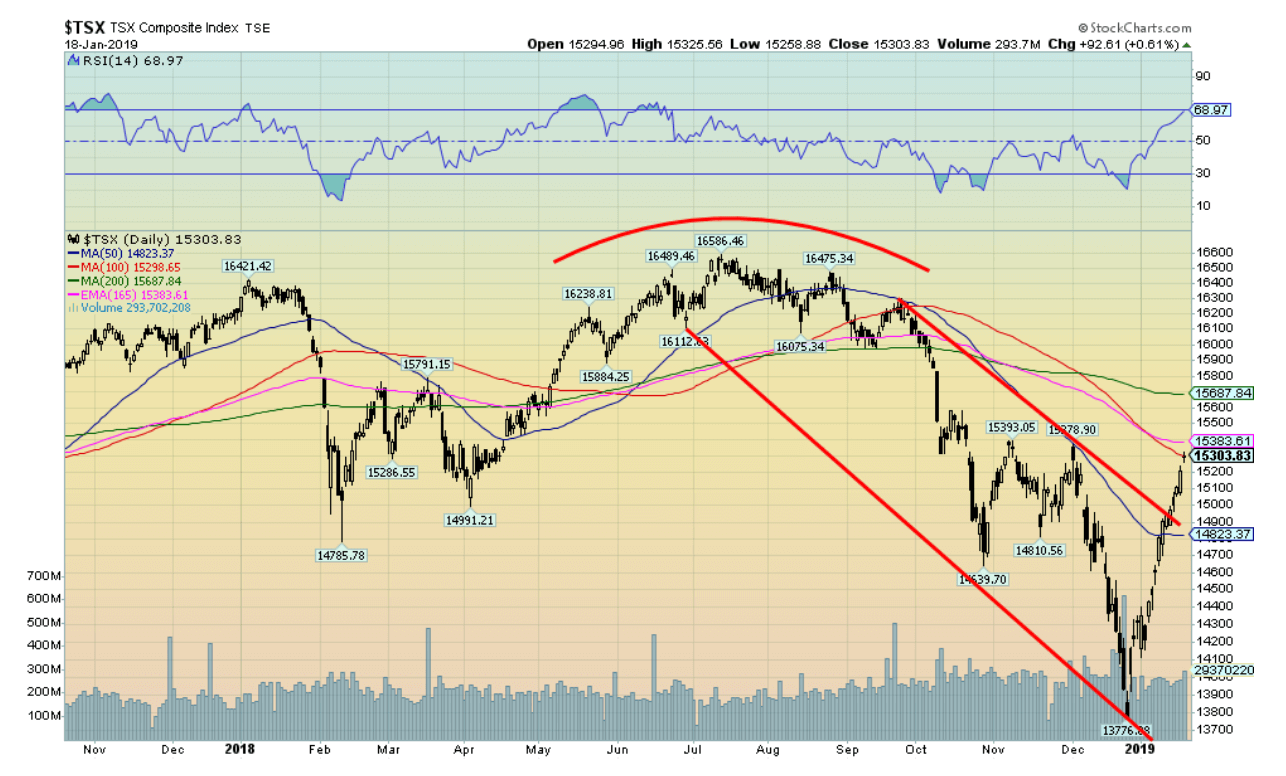
The TSX Composite, like the other North American indices, has enjoyed a sharp run-up from the December lows. The TSX is up 11 percent from those December lows. However, it is now running into resistance zones that stretch from 15,300 to 15,700. We believe the TSX would have to regain above 16,200 to suggest a run to new highs. Otherwise, as noted earlier, this up move is too fast and is not sustainable and is most likely due to fall at any time. Note the low volume on the upswing. That is typical of bear market rallies.
© David Chapman
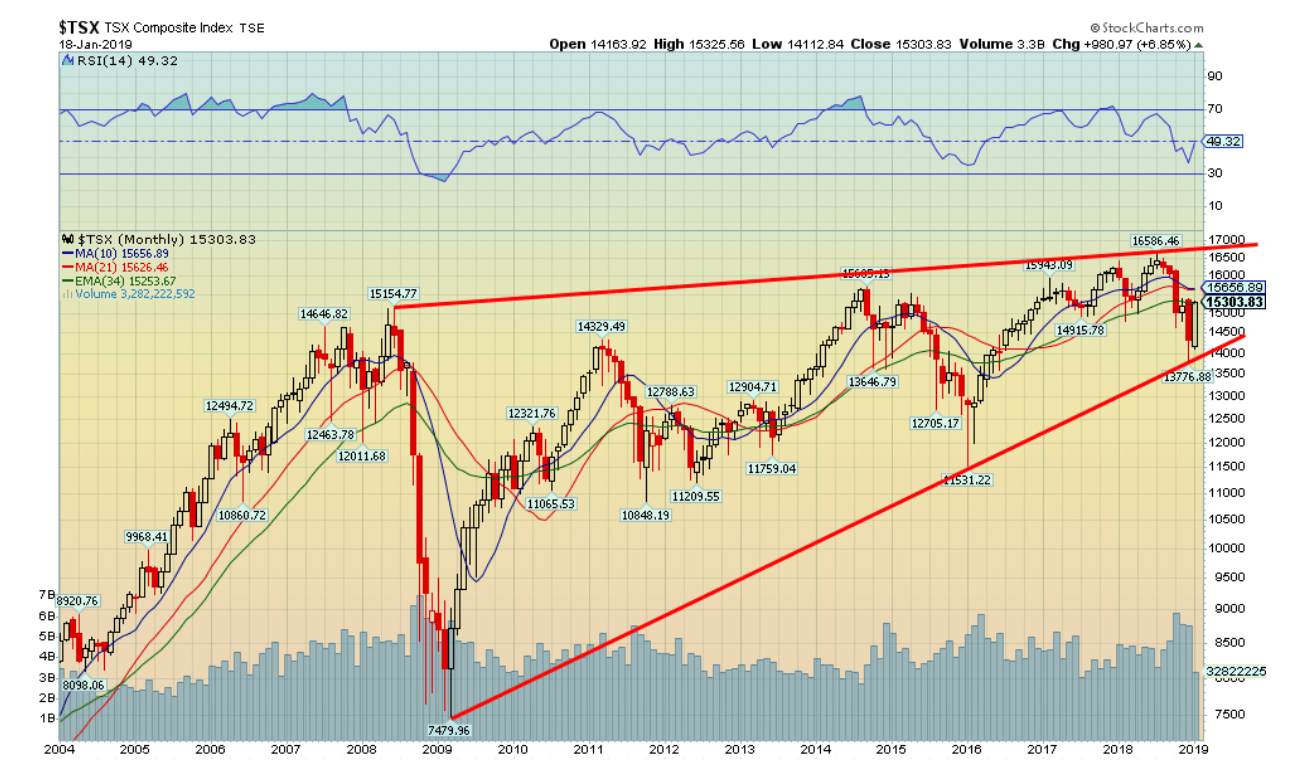
Here is a long-term view of the TSX Composite using a monthly chart. There are two arguments here – one bullish, one bearish. This is either an ascending triangle (bullish) or an ascending wedge triangle (bearish). This appears more to us as an ascending wedge triangle (bearish). Normally in an ascending triangle, the top line is either flat or slightly declining. An ascending triangle has rising lows. In an ascending wedge triangle, the top line is rising meaning it is a series of higher highs. The bottom line also rises in a series of higher lows but the line is usually steeper then that seen on an ascending triangle (or a symmetrical triangle for that matter).
The triangle above has rising highs and sharply rising lows. We believe it is an ascending wedge triangle that is ultimately bearish. Naturally, a breakout above 17,000 would kill any thought of an ascending wedge triangle. But a breakdown under 14,000 and new lows would confirm the thoughts of an ascending wedge. An ascending wedge triangle usually returns to where it started and that is the 2009 lows of 7469. On the monthly chart, the triangle still has more than a few months to play out within the context of the ascending wedge triangle. It could even wiggle its way back to the top of the triangle which currently would mean small new highs.
© David Chapman
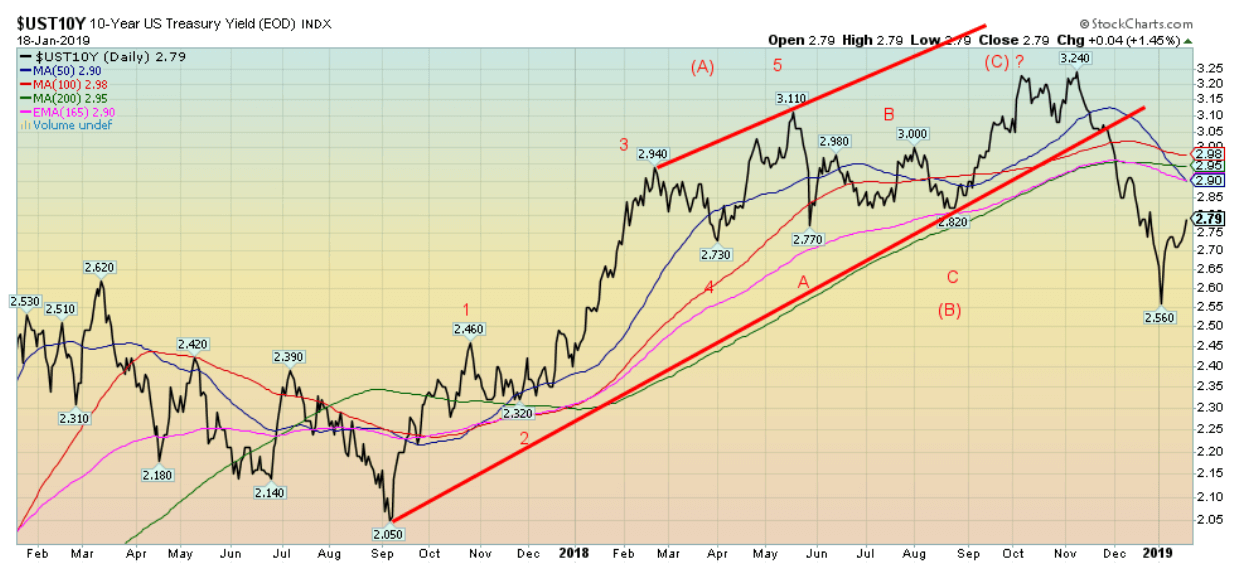
As the stock market improved., it is probably not a surprise that investors (read “funds”) came out of bonds and ran into the stock market. The result is the yield on the U.S. 10-year Treasury note has leaped from a low of 2.56 percent in December to 2.79 percent this past week. This is the first significant correction since the top back in October 2018 at 3.24 percent. It is possible that the backup in interest rates could reach to 2.90 percent to 3.00 percent before it resumes its downtrend.
Above 3.00 percent would suggest that the bond bear is back. The FOMC meets at the end of the month January 29 and 30 and the wide expectation is that they will leave rates unchanged. What we will have to watch for is hints that they are softening their interest rate hiking stance. Recent comments suggest that they are indeed softening their stance towards hikes. The gyrations in the stock market are a catalyst because they usually precede a recession.
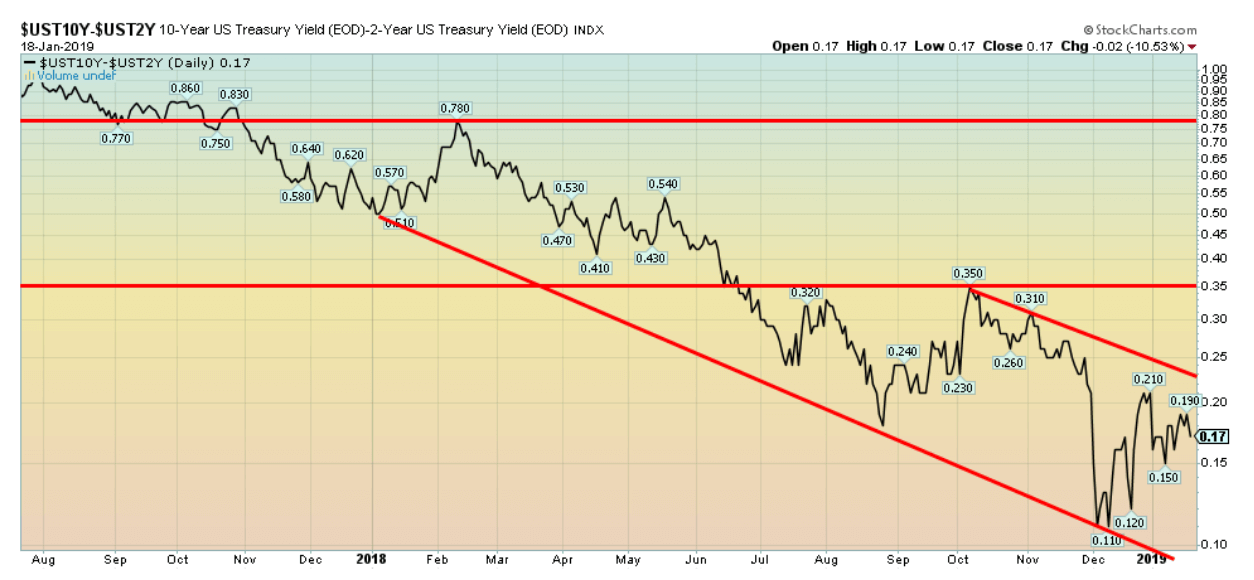
Recession watch spread
© David Chapman
Speaking of recession, our recession watch spread remains largely unchanged this past week despite a back-up in rates for the 10-year Treasury note. The 2-year Treasury note backed up equally, keeping the 2–10 spread up only 1 bp in the past week to 17 bp. While the trend remains down, we are nowhere near negative spreads just yet. A prolonged period of negative spreads normally precedes a recession. Canada’s 2–10 spread is narrower at 8 bp, but it too remains positive even as it is weakening.
© David Chapman
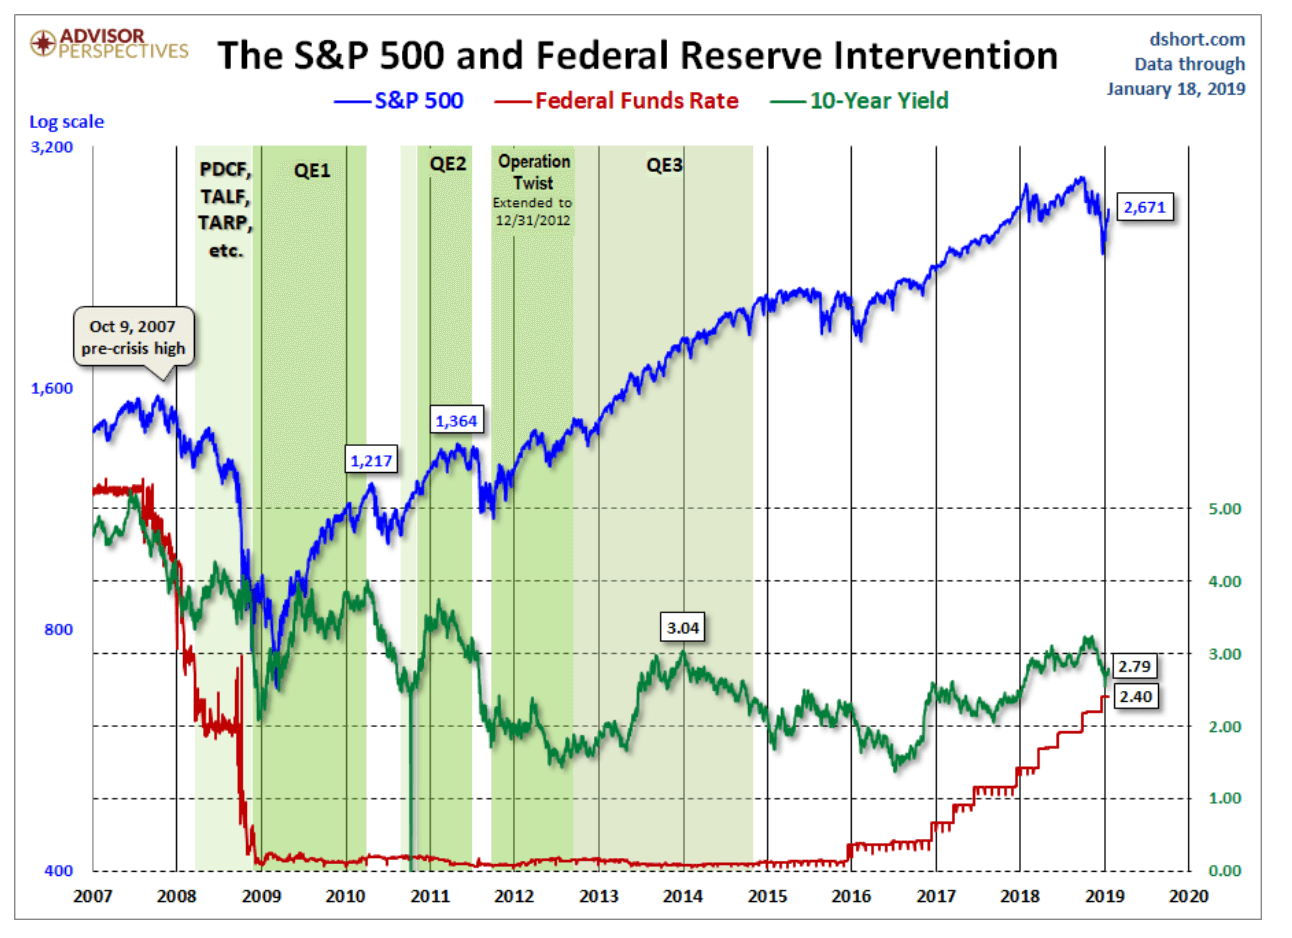
This is a great chart to illustrate the impact of the Fed’s operations on the stock market. QE1, QE2, Operation Twist, and Q3 all resulted in the stock market making significant moves to the upside. When each one ended, the market also hesitated. The only one that was really different was the last major upswing in the stock market from 2016 to 2018. No QE and the Fed hiking interest rates should have, as many would believe, resulted in a stock market drop.
That didn’t happen. The stock market kept climbing on the belief that Trump would bring in huge tax cuts and allow corporations to repatriate funds from overseas. He delivered. It set off a wave of speculation. It was also a period that saw borrowings leap and stock buybacks become prevalent. Then the proverbial stuff ‘’hit the fan’’ with the start of the trade wars in early 2018 and the party faltered.
© David Chapman
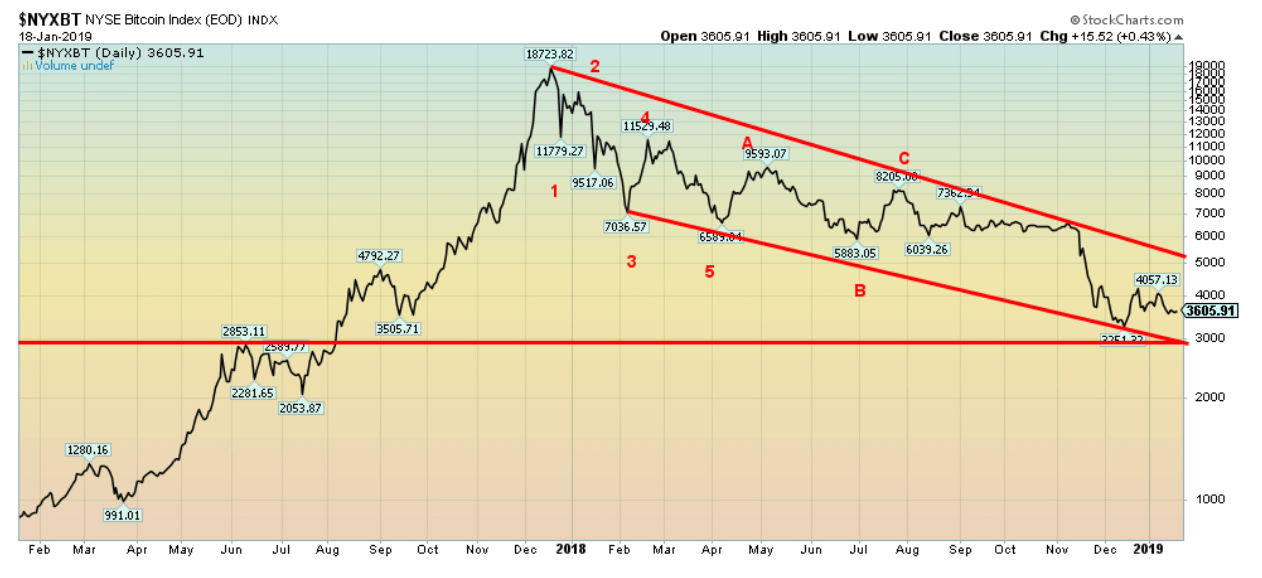
Bitcoin continued its trend of the past year this past week—meaning it was down, losing 1.0 percent. Bitcoin is now down 4.4 percent on the year. Bitcoin’s volatility has fallen sharply in the past year, down apparently some 98 percent. That is reflected in the narrowing range and quieter trading. We continue to believe that Bitcoin and the cryptos have further to fall. There is support in this bear channel down to around $3,000.
A breakdown under that level would spell bigger trouble for Bitcoin and, by extension, the cryptos. Bitcoin has had trouble getting above $4,000, suggesting there is good resistance at that level. Judging from things we read about cryptos, all the bullishness is still not been removed. A final bottom would come when Bitcoin and the cryptos barely get a mention anywhere and no one has any further interest. But Blockchain will survive. As to the cryptos—well, probably not so much.
© David Chapman
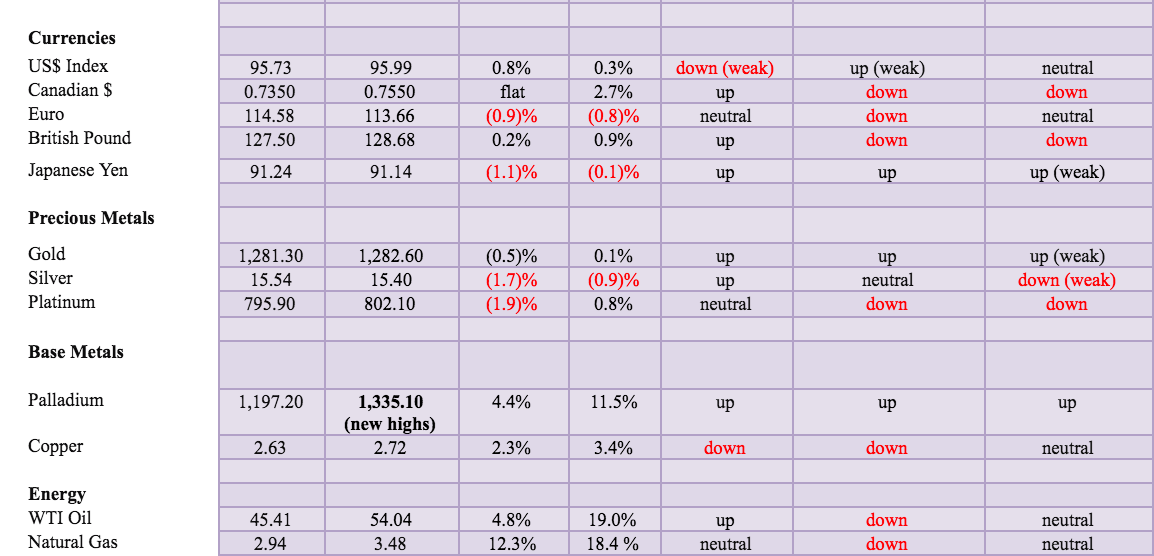
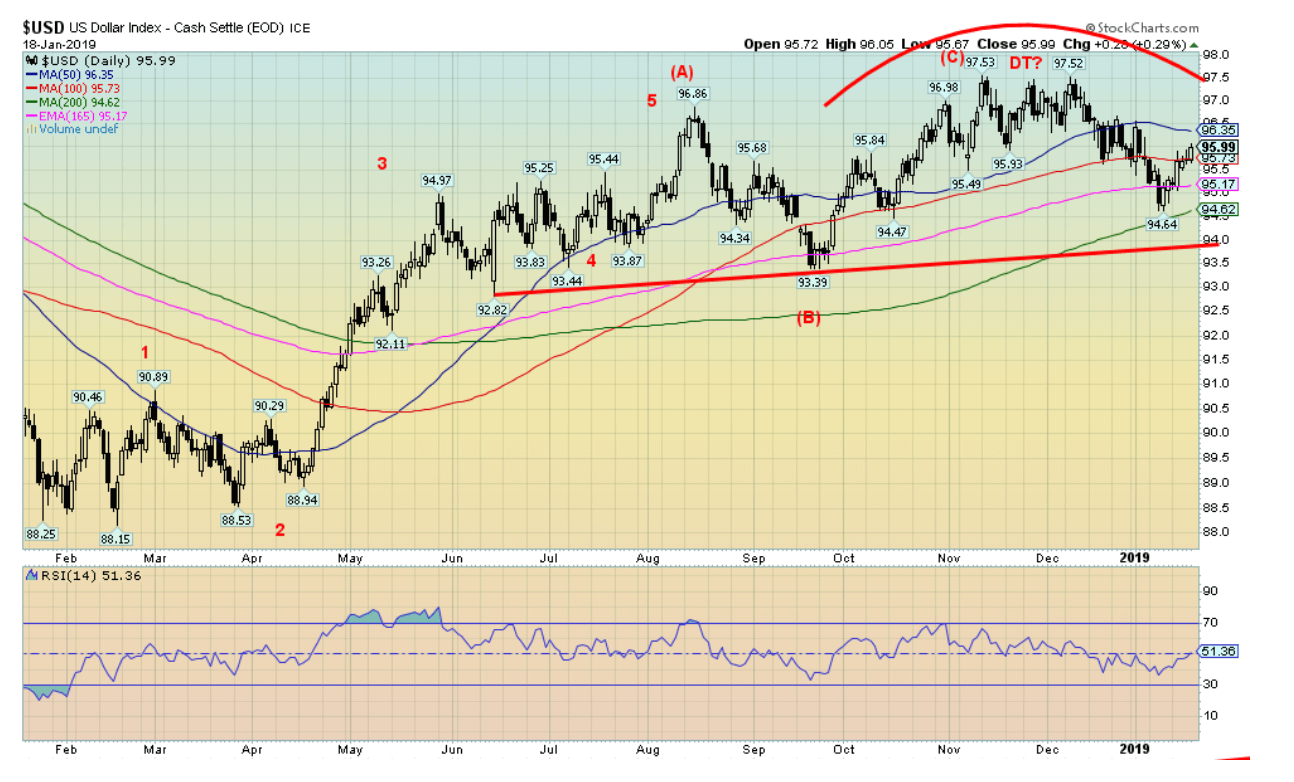
The US$ Index found support down near the 200-day MA at 94.62 (low was 94.64) and has since rebounded as the market has been buoyed by the thought that the U.S. and China might resolve their trade differences. But one has to consider the two partners: the U.S. (Trump) and China. Neither are known for actually abiding by what they say. The current rebound might have a bit more to the upside.
The 50-day MA is up at 96.35. That might be an appropriate point to test. Once the market turns down again, we should be able to test at least the major trendline support near 94. If the US$ Index breaks down under 94, then potential targets become 89.30. The US$ Index has been exhibiting strength primarily because of weakness in the euro.
The euro fell 0.9 percent this past week and is now down 0.8 percent in 2019 in response to what is going on with Brexit and the possibility that the German economy may slide into a recession. It is one thing when the euro zone reports weak results in Eastern Europe, or Greece, Spain, Portugal, or even Italy, but if Germany starts to slide then it spells trouble for the entire euro zone.
Japan has been benefitting as a safe haven away from the U.S. and the euro zone, but even it slid this past week, losing 1.1 percent as some Japanese money ran back into the U.S. stock markets. We expect this rally in the U.S. dollar should soon run out of steam, and it will resume its downward trend. Support is seen at 95.50, 95 and 94.60.
© David Chapman
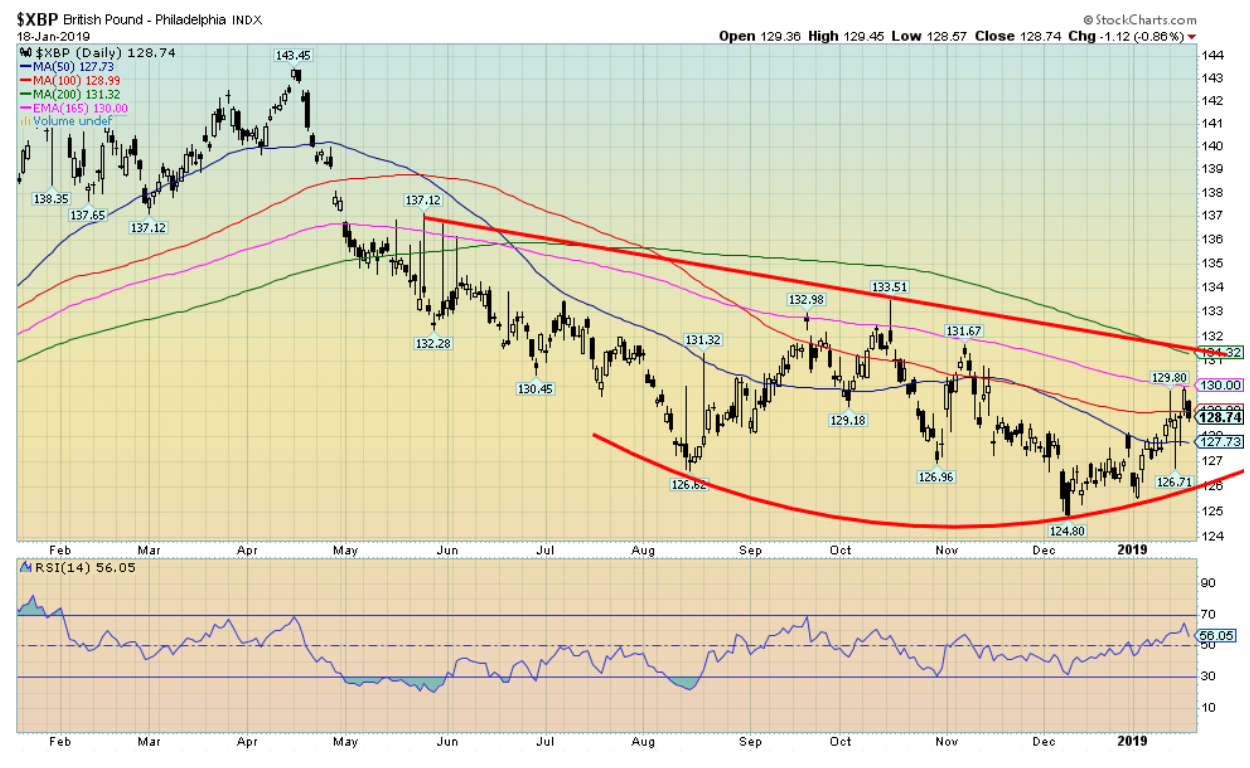
Theresa May survived her confidence vote, but her Brexit plan bombed and was soundly defeated. This leaves the United Kingdom scrambling, either to find a replacement deal to offer the EU (who could reject it) or to face a messy no-deal exit on March 29. Or they may try and extend the deadline.
Nonetheless, the British pound appears to be making either a bottom pattern (bullish) or is forming a descending triangle (bearish). It would have been better if that December low was a higher low to the August low. The pound needs to break out over 134 to suggest a potential move to around 140/142. Otherwise, the bottom could fall out of the pound under 125 with potential targets down to 115/117.
The Brexit has not gone well. If another referendum were held, the remainers would most likely win. Planning a separation based on a bare majority of 51.9 percent was never a good idea in the first place. It was essentially a split vote, very divided. At the minimum, it should have required a 60 percent threshold. But we admit we are stating an opinion.
© David Chapman
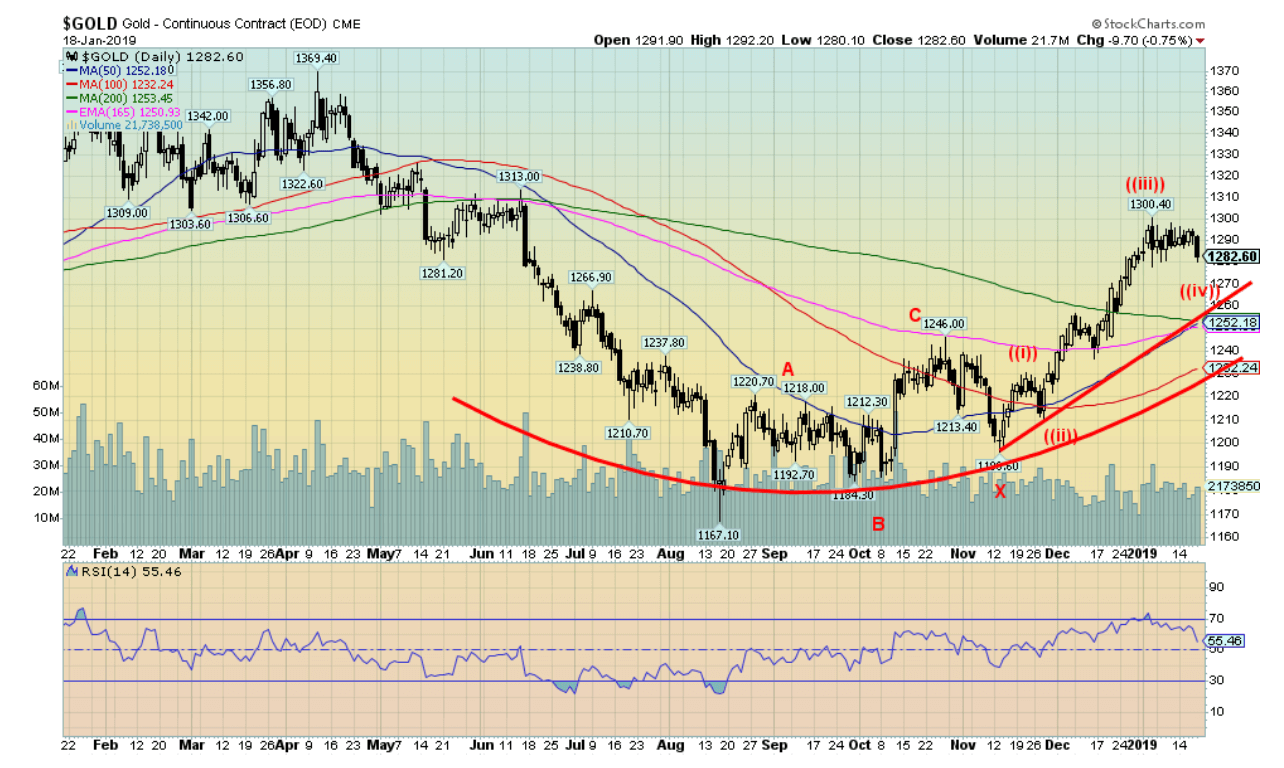
We continue to find the bottoming pattern on gold formed from roughly June through November 2018. The bottom pattern which appears as a potential double bottom has potential targets up to around $1,340. Significant resistance is seen at $1,300 to $1,310 and the first attempt at overhauling that zone failed. Nonetheless, the consolidation under $1,300 appears orderly and we shouldn’t see any major pullback. There appears to be good support down to around $1,250. Gold in US$ has been pressured lower because of strength in the U.S. dollar.
Strength in the U.S. dollar and weak gold in US$ translates into strength in other currencies. It seems that gold, as measured in 72 currencies, is at or near all-time highs. Grant you, many of the currencies are in third world countries, but some significant ones show up on the list such as the Turkish lira and the Russian ruble. Surprisingly, the Canadian dollar was on the list.
Note that the Cdn$ has fallen 3.6 percent since October 1, 2018, while gold in Cdn$ is up 18.6 percent vs. gold’s rise in US$ up only 9.8 percent in the same time frame. Gold in Cdn$ is only about $200 off its all-time high while gold in US$ is off by about $640. It is also noteworthy that the last time gold in lesser currencies was creeping higher and higher (2001-2011) it preceded a strong bull market for gold in US$.
The government shutdown in the U.S. still leaves us without any COT report as the CFTC is one of the impacted agencies.
The current consolidation might have more time to run, but once gold takes out $1,300 a run to $1,340–$1,350 should get underway. The current environment of dysfunctional governments and weakening economics should help propel gold upward.
© David Chapman
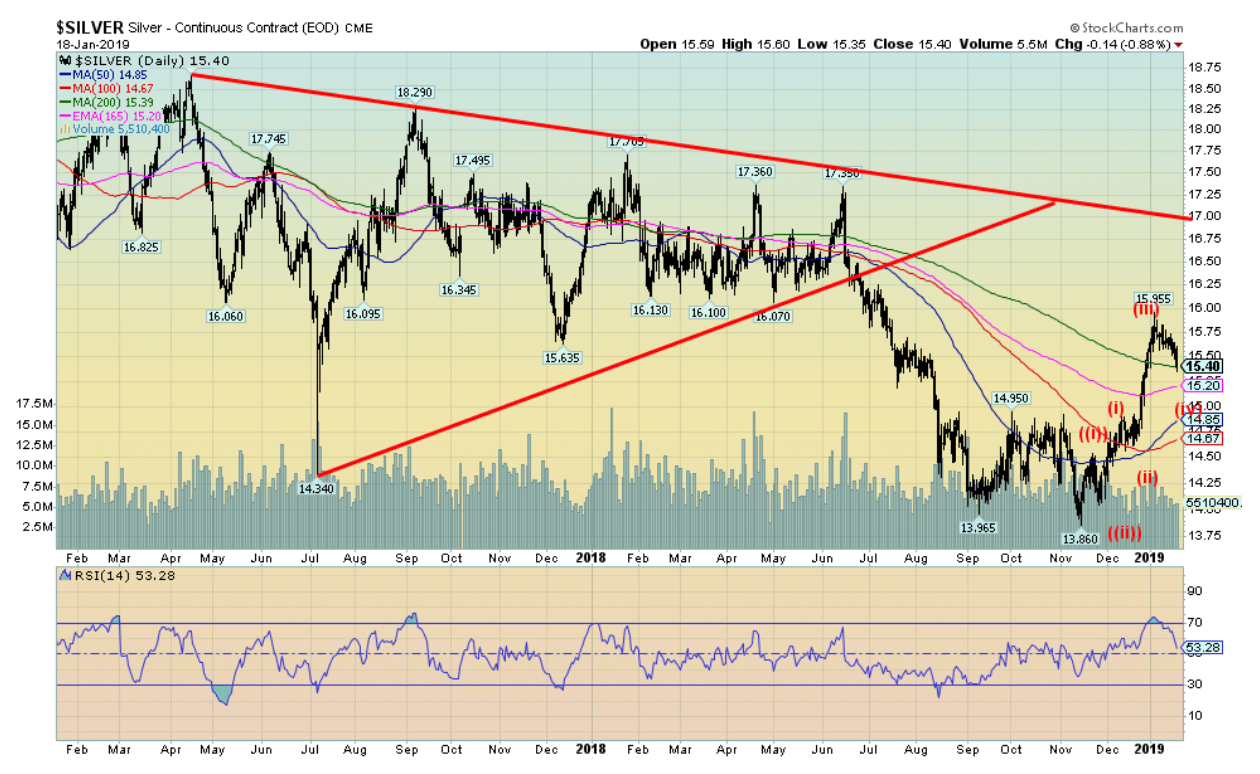
Silver prices pulled back this week, falling 1.7 percent. Silver is now down on the year by 0.9 percent. As with gold, a stronger U.S. dollar helped to push precious metals prices lower. So far, silver has found support around the 200-day MA, but there remains good support down to $15.20. Below that level silver could fall to $15. We note this looks like a small fourth wave correction with a fifth wave to the upside to come that should take silver over $16.
There should be congestion resistance in the $16.10/$16.20 zone, but above that level, a push towards $16.50 should get underway. Below $15.20, significant support comes in at around $14.60 to $14.90. We expect silver should not get that low.
© David Chapman
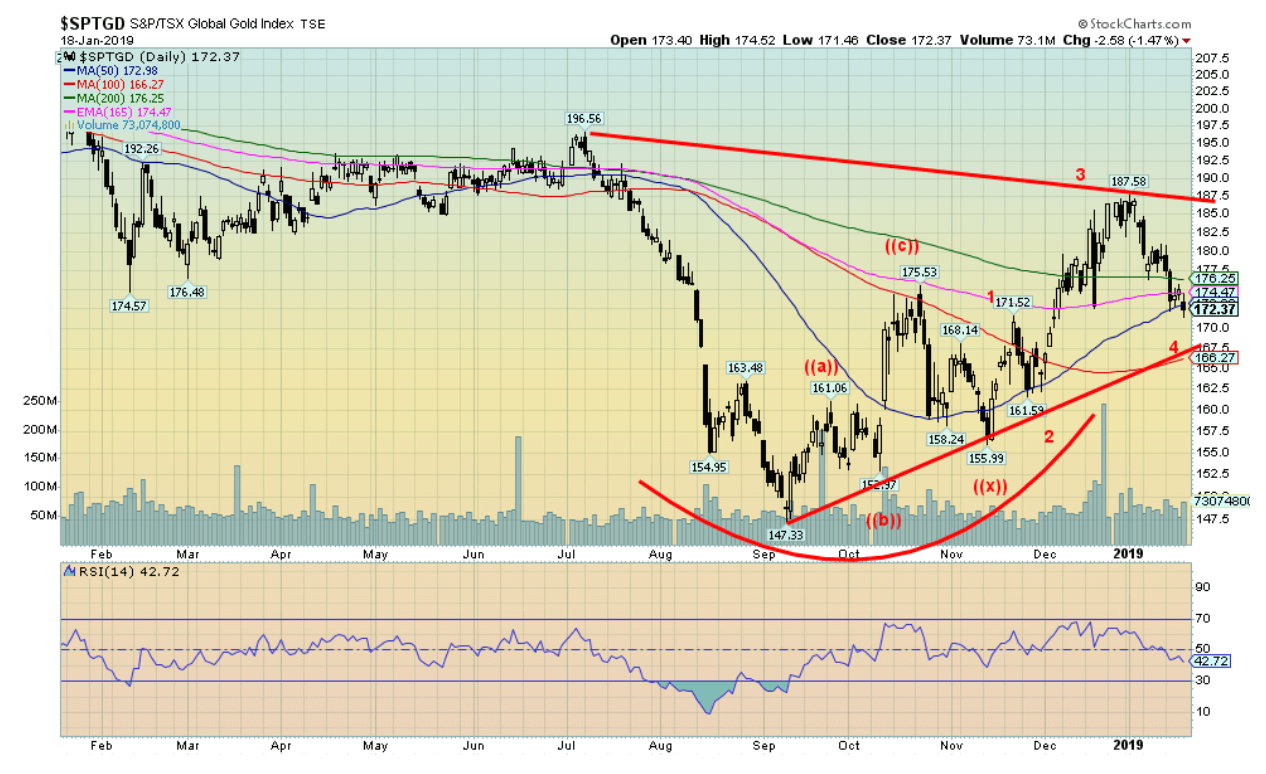
It was not a particularly good week for the gold stocks. The Gold Bugs Index (HUI) fell 5.4 percent while the TSX Gold Index (TGD) (chart above) was off 3.9 percent. The TGD fell just short of our target of 190 with a high of 187.58. We have now established a line of resistance at 188. There could be some further consolidation to come with the TGD and a test of the uptrend line currently near 160 cannot be ruled out. It is also the 100-day MA. The 50-day MA has crossed over the 100-day MA but remains below the 200-day MA.
The 200-day MA is currently at 176. Sentiment towards the gold stocks remains somewhat bearish with the Gold Miners Bullish Percent Index (BPGDM) at a pretty neutral 37. Only above 75 does that index begin to cross into strong bullish territory. Bear territory is under 25. There is some support here at 172, but under 170 a drop to 160 would not surprise us. Resistance is now at 176, 180 and 188. A firm breakout over 188 could suggest a move for the TGD up to around 205 to 210. We expect support down to 160 will hold and this pullback is a buying opportunity. Strong seasonals prevail for the gold sector until late February–early March.
© David Chapman
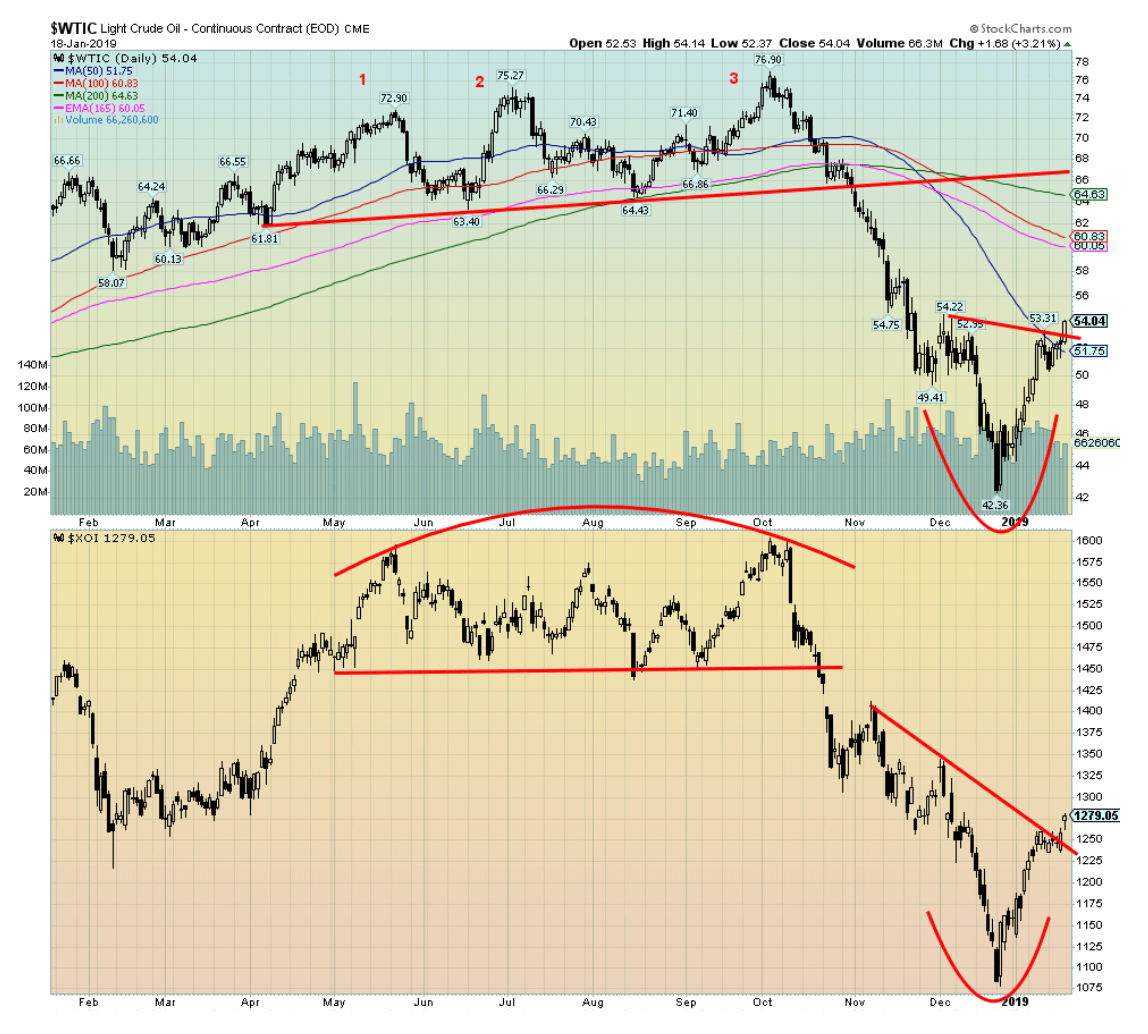
Oil prices continued their recent surge this past week, thanks to the Saudis cutting production more than expected. In December, OPEC production fell by 600 kb/d and Saudi Arabia was the leader in the cutbacks. All of this has helped propel WTI oil from about $42 to $54 over the past few weeks. It has also helped put a bid into the beleaguered energy stocks as both the Philadelphia Oil & Gas Index (XOI) and the TSX Energy Index (TEN) enjoyed a bump of 2.4 percent and 2.7 percent this past week. Since the lows in December, the XOI is up 18.5 percent and the TEN is up 20 percent.
After being terrible performers in 2018 the new year is off to a bumper start. Grant you, oil and the energy stocks strong seasonals are December to July. Right on cue, it seems. The potential easing of trade tensions between China and the U.S. also helps as it might help bolster demand. Otherwise, most of the other factors that govern oil prices such as geopolitical unrest and currencies have been relatively flat of late. It is possible that this up move, like the stock market, is too much too fast and both WTI oil and the energy stocks pull back to test their recent lows.
So far, it is looking like a V bottom. Nonetheless, a short-term top and a pullback would not particularly surprise us right now. WTI oil has support down to $52 and then to $50. Below $50, oil prices could tumble again although we doubt it. There is resistance here, but if WTI oil can push higher over $55 then it could soon be at $58 to $60.
Chart of the week
© David Chapman
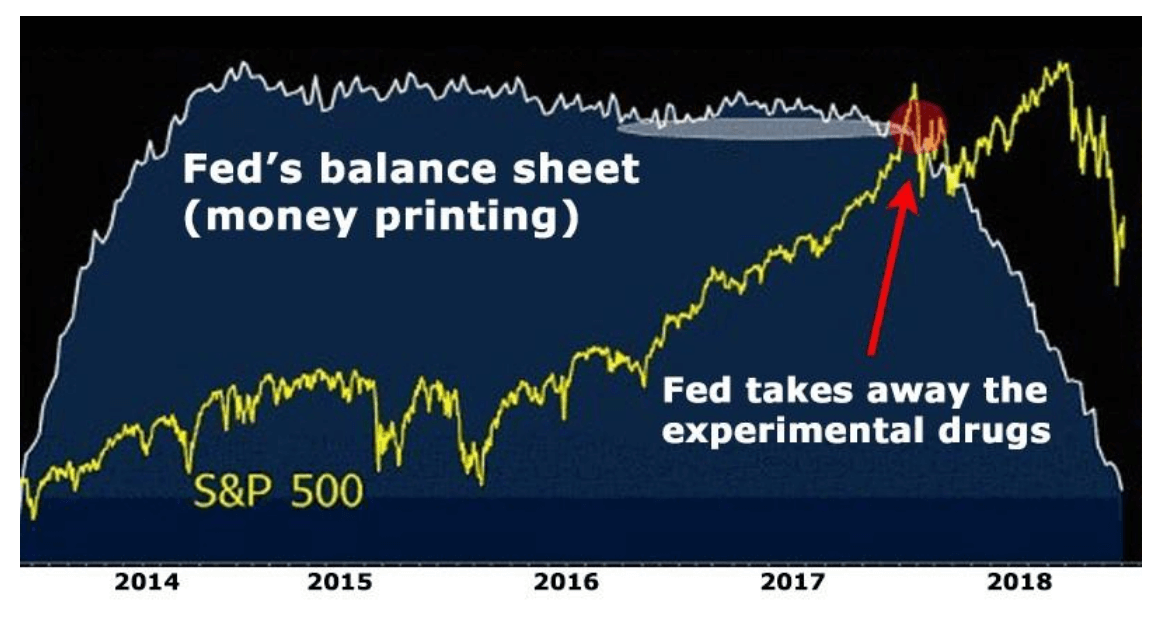
A picture of how quantitative easing (QE) turned into quantitative tightening (QT). After the collapse of Lehman Brothers in September 2008, an event that almost brought down the entire financial system, the Fed along with the other major central banks (BOJ, BOE, BofC, ECB, SNB, and PBOC) embarked on an historic period of ultra-low interest rates (down to zero and even below). They injected huge amounts of liquidity in the financial system to bail it out and prevent a mega-collapse that could have possibly led to another Great Depression.
It was an experiment of epic proportions. It was also an extremely risky experiment. The Fed injected over $4 trillion into the financial system by buying back securities from the banking system, including U.S. Treasuries and Mortgage Backed Securities (MBS) and other highly leveraged financial instruments. The result saw the Fed’s balance sheet explode from around $800 billion to over $4 trillion.
The U.S. (along with the EU, Japan, China, and others) also saw government debt explode. The ultra-low interest rates encouraged borrowing on an unprecedented scale for both the corporate and consumer sector. They also created bubbles in almost everything—housing, stocks, and more—but, oddly, not commodities or gold although they enjoyed a powerful run from 2009 to 2011. It was even nicknamed the ‘’everything bubble’’ following the dot.com bubble of the 1990s and the housing sub-prime mortgage bubble of the early- to mid-2000s.
QT began back in 2015 with the Fed hiking interest rates and its balance sheet began to flatline and descend as they stopped pumping liquidity into the financial system. After initially faltering, the stock market started rising again with the election of Trump and the speculation of massive tax cuts. The tax cuts came eventually and that helped push the market even higher.
With the onset of QT in 2017, the stock market wavered and eventually cracked in 2018 sparked by the fear of trade wars and the tax cuts wearing off. The Fed is now back-tracking a bit as they are hinting that they might think twice about hiking interest rates further. The almost 20 percent drop in the markets spooked them a bit. And, as well, Trump’s constant complaining about Fed policy and Fed Chairman Jerome Powell didn’t help.
Nonetheless, the Fed has not halted their QT of selling off their holdings. However, if things went down again would they switch back to QE? Not likely, as long as the economy doesn’t show signs of faltering. The Fed is probably still in line for an interest rate hike once again in March. They tend to start too late and end too late.
—
DISCLAIMER: David Chapman is not a registered advisory service and is not an exempt market dealer (EMD). We do not and cannot give individualized market advice. The information in this article is intended only for informational and educational purposes. It should not be considered a solicitation of an offer or sale of any security. The reader assumes all risk when trading in securities and David Chapman advises consulting a licensed professional financial advisor before proceeding with any trade or idea presented in this article. We share our ideas and opinions for informational and educational purposes only and expect the reader to perform due diligence before considering a position in any security. That includes consulting with your own licensed professional financial advisor.


Bitcoin Stalls Near $60K as Strategy Moves, ETFs Outflow, and EU MiCA Rules Take Effect
Bitcoin hovers near $60,000 with ETF outflows, while Strategy boosts reserves, sells BTC, and raises dividends to reassure investors. Ethereum...


Cannabis Dominates Global Drug Use: Trends, Risks, and Shifting Markets
Cannabis remains the world’s most widely used illicit drug, with 256 million users in 2024, surpassing all others combined. Growth...


Italy Approves First Hydrogen-Powered Train for National Rail Network
ANSFISA has approved Italy’s first hydrogen-powered train, the Alstom HMU214, for use on the Brescia–Iseo–Edolo line. Capable of 140 km/h,...


Cotton Market Weakness Persists Despite Brief Rebound
Cotton prices fell to new lows last week before a modest rebound. USDA data shows crop conditions remain worse than...


Eli Lilly Hits $1 Trillion Valuation Amid Strong Bullish Momentum
Eli Lilly stock hit a record high, surpassing $1 trillion market value after strong product demand. Shares surged over 7%,...
 |
|
 |  |
 |
|
-

 Crowdfunding2 weeks ago
Wyrmgold Launches Crowdfunding Campaign for Believe in me! (please)
-
 Business2 days ago
Dow Jones Near Highs Signals Strength Until Volatility Returns
-

 Crypto1 week ago
XRP Under Pressure Amid Macro Forces, Fed Policy, and Regulatory Shifts
-

 Markets6 days ago
Commodity Markets Pause as Oil Falls, Metals Correct, and Grains Show Mixed Signals
You must be logged in to post a comment Login