Featured
Stock markets enter a new, more dangerous phase
It has been a dramatic and historic month in the stock market. One has to go back a long way to find the drops experienced this month.

“At the end of each year I make a list of my mistakes, and it’s pretty friggin long.”—Dean Lombardi (ice hockey executive, GM San Jose Sharks 1996–2003, GM Los Angeles Kings 2006–2017
“I made no resolutions for the new year. The habit of making plans, of criticizing, sanctioning and molding my life, is too much of a daily event for me.”—Anaïs Nin, French-American diarist, essayist, novelist, writer short stories and erotica, 1903–1977
“Gold is the money of kings. Silver is the money of gentlemen. Barter is the money of peasants. And debt is the money of slaves.”—Norm Franz, author, Money & Wealth in the New Millennium (Thanks, Mike)
We weren’t going to put out a commentary this weekend, but the market has been so volatile that we felt it was worthy of some comment.
If there was any doubt that we have entered a bear market, it is being dispelled this past week. Those who believe otherwise will soon discover that, unlike the corrections of 2011 and 2015/2016, we have entered a new and more dangerous phase. Oh, there will be periods where the market will rebound and appear to be starting a new up phase, but they are more likely to be hooks, even if the market does recoup 50% or more of the previous decline. So far, this decline has been deadly, far more than we might have thought at this stage. But there are just too many danger signs to ignore, many of which we outlined in our commentary of December 17, 2018.
Stock indices globally have violated uptrends. Many, if not most are making new 52-week lows. They have wiped out all of the gains of 2018 and the vast majority of indices are in the red for 2018. We note an exception is the Brazil Bovespa Exchange up 12% in 2018. U.S. markets have had their worst December since the Great Depression—since 1931 to be precise.
The decline this past week was the worst since 2008. As of the close on Friday, December 21, the Dow Jones Industrials (DJI) is down 6.9% in 2018, the S&P 500 is off 7.1%, the Dow Jones Transportations (DJT) is down 16.4%, and the NASDAQ has lost 8.4%. We are hard-pressed to find anyone up on the year.
The TSX Composite is down 14.0%, and the TSX Venture Exchange (CDNX) has been slaughtered down 37.7%. Internationally, the London FTSE 100 is down 11.6% in 2018, the Paris CAC 40 of off 11.7%, the German DAX has dropped 17.7%, China’s Shanghai Index (SSEC) is down 23.9%, and the Tokyo Nikkei Dow (TKN) has lost 11.5%.
More telling is how much many of the indices are down from their highs, and not just their highs but their all-time highs. The DJI is down 16.3% from its all-time high, the S&P 500 is off 17.8%, the DJT is down 23.6% and officially in the bear market territory. The NASDAQ is also in the official bear market territory, down 22.1%. The TSX Composite has fared somewhat better—is so far off only 16.0% from its all-time high. But the TSX Venture Exchange (CDNX) has been devastated down 43.5% from its highs earlier in the year.
The question is: Will there be a panic before year-end during the thin trading week between Christmas and New Year’s? Forget about Santa Claus coming to town. It’s the Grinch who stole Christmas instead, even if somehow, we recoup a little in the remaining week. More than 90% of asset classes are in the red in 2018. It has eclipsed the high-water mark of 84% set way back in 1920. Yes, 1920. If that isn’t telling, we don’t know what is.
©David Chapman
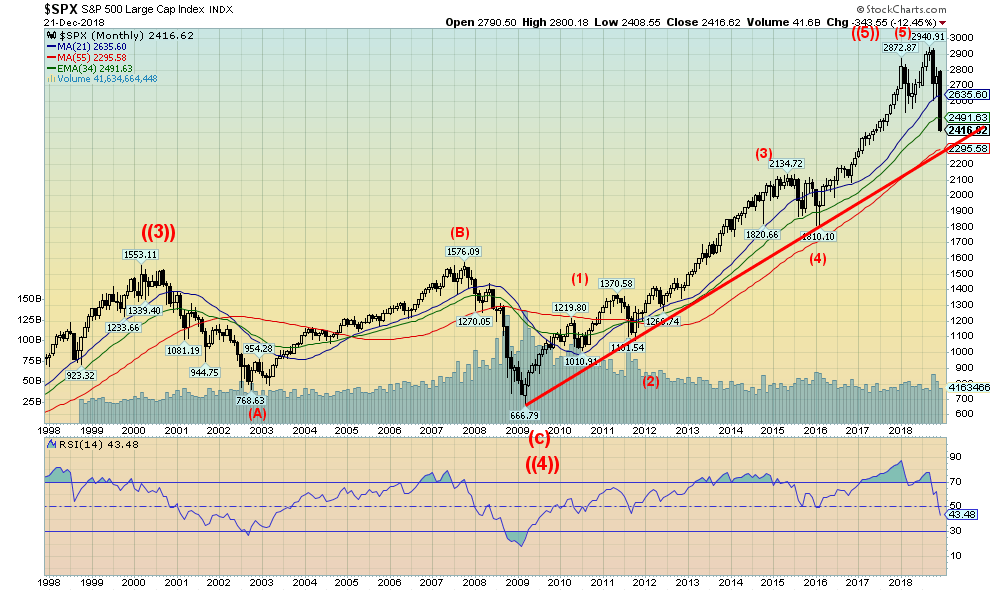
The sky may be falling, but we also might be near an intermediate low and a tradable rally could develop. The trouble is the low might still be a 100 S&P 500 points away as the chart above shows. That is where the uptrend from the 2009 low comes in. The 55-month moving average lies just below 2,300.
The emphasis, however, is on tradable, not investment. However, we have no doubt there are many portfolio managers out there who believe this is merely another correction within a long-term bull market. This one is different and the structure of the decline is telling us that this is a potentially dangerous down wave—in fact, quite a dramatic down wave.
The background is negative. The world is leveraged with debt and plagued with dysfunctional politics, the Great Powers are staring each other down with war games, there are currency wars, trade wars, and climate wars. The odds favor that this is merely the start of what could be a two- to three-year bear market that could once again take the stock markets down 50% or more. The problems of 2008 were never resolved. They were just papered over. The Great Bull Market of 2009–2018 is officially over. It rose on record ultra-low interest rates, quantitative easing (QE), and a mountain of debt.
Except now interest rates are rising, as was confirmed this past week when the FOMC hiked, as expected, the key Fed rate another 25 bp to 2.25%–2.50%. It was small consolation that they indicated that 2019 might only see another two rate hikes, not three as previously indicated. QE has turned to QT (quantitative tightening) as the Fed continues to unwind its huge portfolio. The trouble is, as we have learned, their portfolio has suffered losses far exceeding the Fed’s capital of $39 billion. Can the Fed go bankrupt?
Despite the Fed lowering some expectations of rate hikes going forward, the President has continued his attacks on Fed Chairman Jerome Powell. There are even rumors that the President could fire Powell or at least de-designate him. That would be unprecedented. We’d hate to think how markets might react to that level of political interference in the Fed. Chaos is a word that comes to mind.
Then there is the looming partial shutdown of the U.S. government over funding for a border wall. This is not the first time. It almost seems to be a regular occurrence, at least since 1980. It happened four times under Ronald Reagan, once under George H.W. Bush, some rolling shutdowns occurred under Bill Clinton and some rolling shutdowns under Barrack Obama. The shutdowns under Clinton and Obama were triggered by impasses with the Republican-held Congress. This is the third shutdown under Donald Trump. To all U.S. government employees—Merry Christmas.
In a world with in excess of $250 trillion of debt, the ability to issue even more is becoming compromised. The fear instead is one of debt collapse. A black swan event like Lehman Brothers in 2008 could once again threaten the global banking system. Only this time there will be no bail-out. Instead, it will be bail-ins.
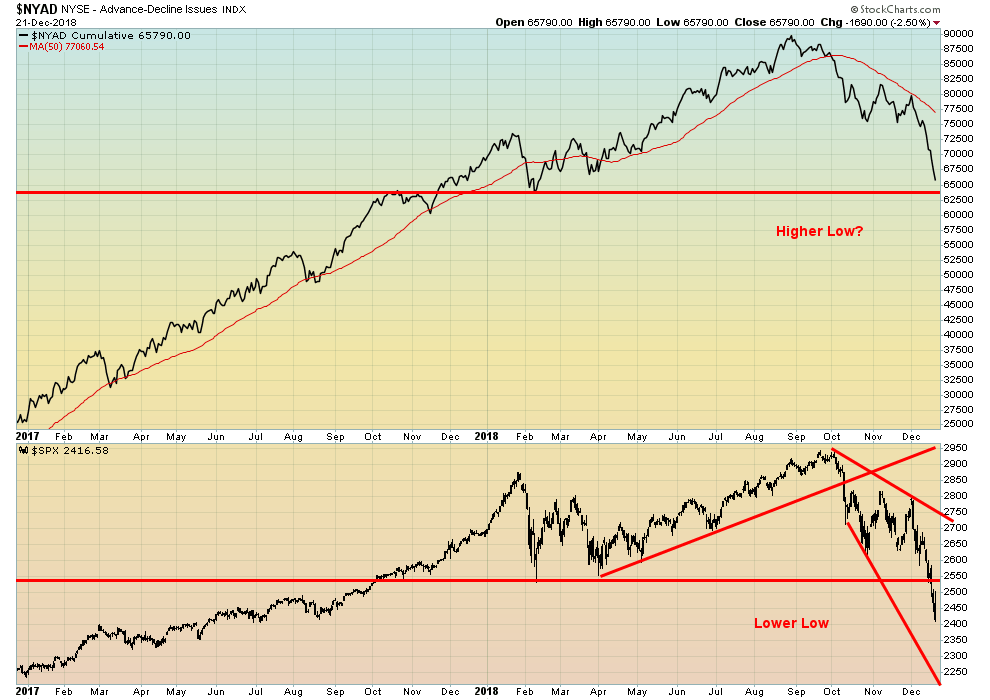
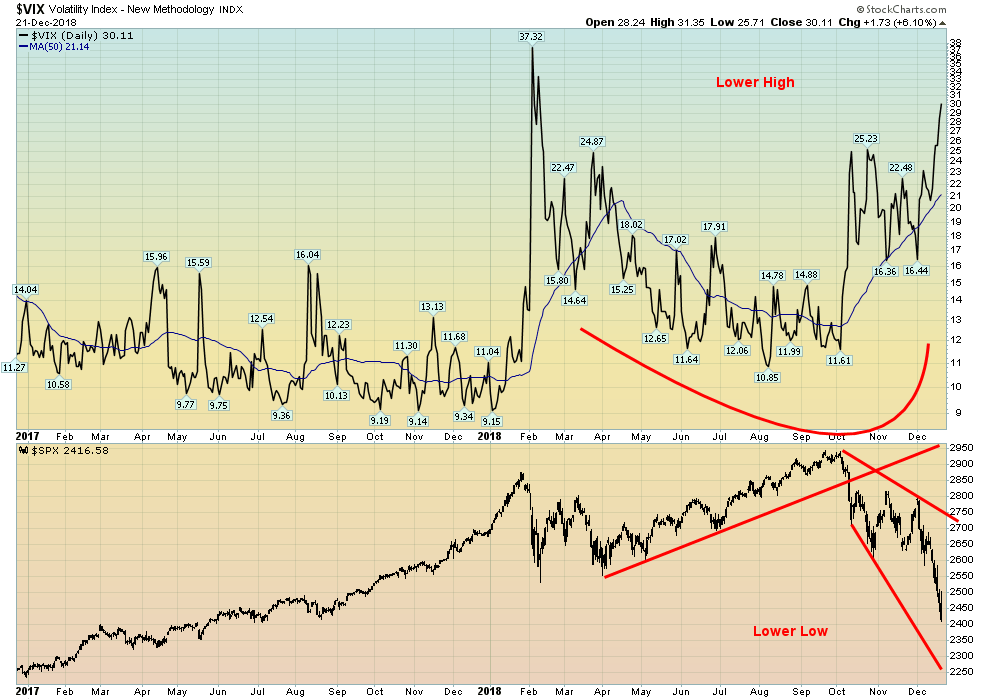
If we want to be a bit optimistic going forward, we can note a few divergences. Two charts below. The first one shows the NYSE Advance Decline Line (NYAD) vs. the S&P 500, and the second shows the VIX Volatility Index (VIX) vs. the S&P 500. In both instances, the S&P 500 has made new lows below the February 2018 low but the VIX has not made a new high above its February 2018 high, and the NYAD has not made a new low below its February 2018 low. These are non-confirmations of the price action vs. the indicators. As well, although not shown, the RSI (relative strength index) for the S&P 500 and the other indices is now registering under 30 on the daily charts, a level often associated with lows. Sentiment for the S&P 500 has hit 8% bulls. Fear has clearly entered the markets. But is this down wave over? There are few signs that it is.
Despite the fear levels in the market, there are other positive signs. The yield curve has not yet inverted, although the 2-year—5-year spread has. But it’s small so far. Pundits have said the yield curve is indicating only a 20% chance of a recession. P/E earnings seem reasonable now following the decline. Apparently, Canadian stocks are trading for 14 times their forecast earnings, the S&P 500 is trading at 15 times its forecast earnings. But the Shiller inflation-adjusted PE, or CAPE as it is known, remains at historically lofty levels even as it has come down with the market. There is, so far, little sign of a consumer slowdown in retail sales and most economic indicators remain positive. Unemployment in both the U.S. and Canada is at or near historical lows, at least as measured by the headline unemployment rate.
As positive as all this is, the problem with it is, it is moot if the stock market is falling 400–500 points every day. Eventually, the market will find a bottom and a powerful countertrend rally will develop. First, however, the market needs to something to calm it down. When fear grips the market, logic is thrown out the window.
©David Chapman
©David Chapman
Have there been any havens where one can hide? Government bonds have rallied and yields are down across the curve. But corporate bonds are weak and junk bonds are threatening to tip over and have fallen with the stock market. Housing markets globally have probably topped. The question is: will there be a property crash as we saw in 2007–2008? In past declines, property prices have fallen as well. But gold has been rising. Silver too, as well as the gold stocks as represented by the TSX Gold Index (TGD) and the Gold Bugs Index (HUI).
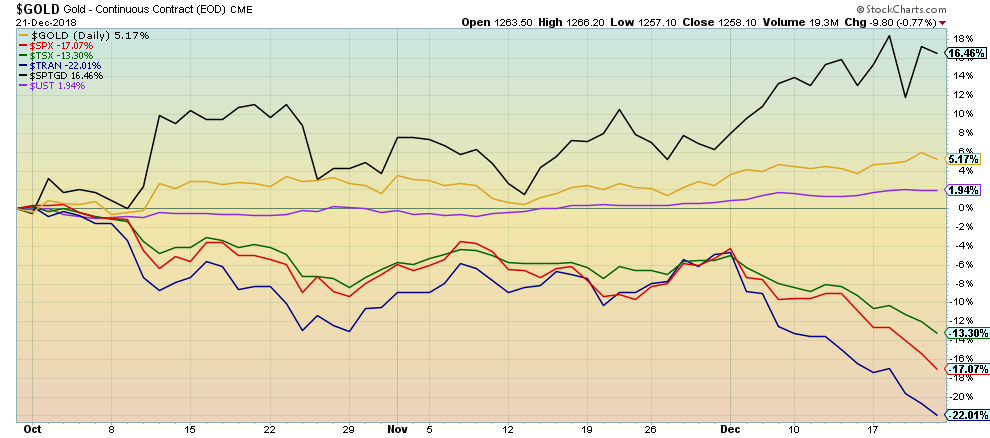
Our chart below shows that gold is up 5% since October 1, 2018—the period coinciding with the stock market top. The TGD has fared even better, up 16.5% while the U.S. 10-year Treasury note (UST) has rallied about 2% (price) (prices move inversely to yields). Meanwhile, the S&P 500 is down 17.1%, the DJT is off 22.0%, and the TSX Composite has fallen 13.3%. Gold and the gold stocks are creeping higher. That is actually positive. Although we do note that the commercial COT for gold and silver has weakened. However, that is not unusual when gold rallies, but it is not yet at levels that would suggest a top. Nor is bullish sentiment towards gold and silver at extremes. We expect gold to top over $1,300 in due course. Possibly even by year-end, although odds are better that it happens in January. The period January to March tends to be seasonally strong for gold.
©David Chapman
What has happened this month is historical and unexpected. Not so much unexpected in that we thought it wouldn’t happen. Just the timing of the decline. We are sure that many have been caught off guard. Looking at year-end statements will not be pleasant. Is the sky falling? Well, for this month anyway, it has been one to remember. But it is just the beginning. Not the end. Dark clouds have gathered. But there is some light and its color is golden.
Markets and trends
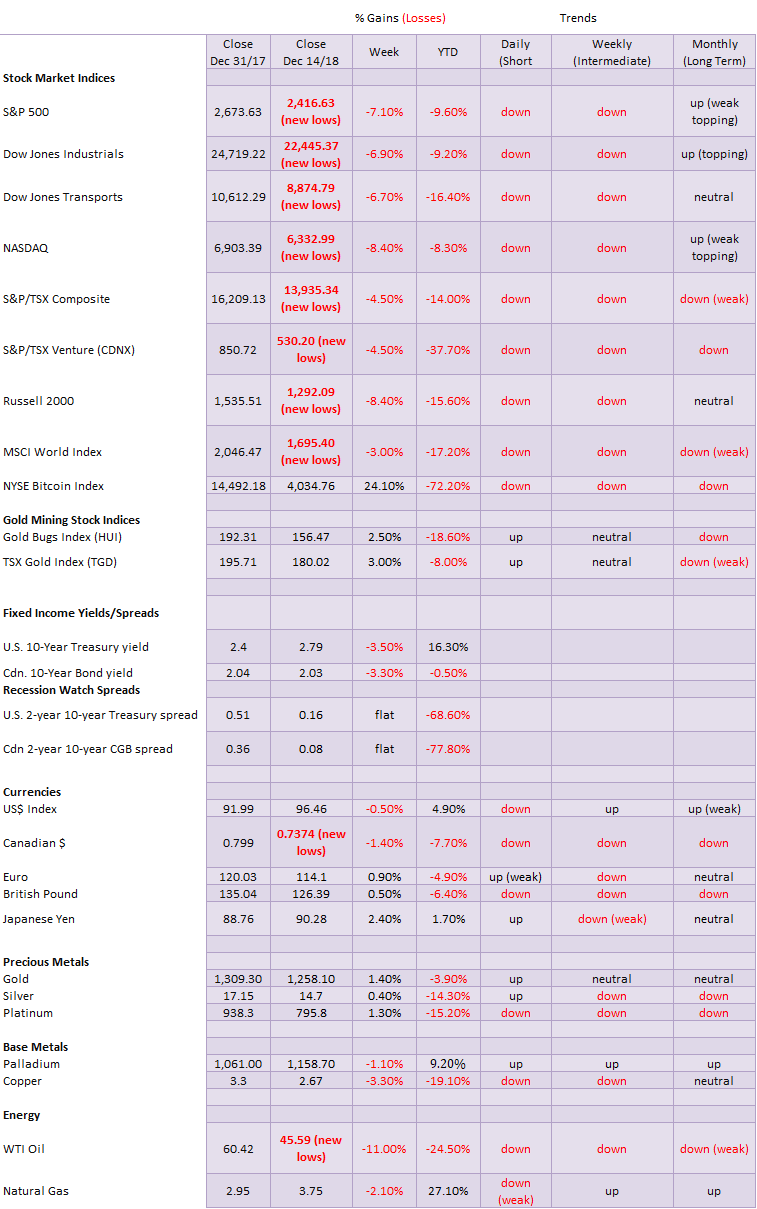
Note: New highs/lows refer to new 52-week highs/lows. ©David Chapman
(All charts are courtesy of StockCharts)
—
DISCLAIMER: David Chapman is not a registered advisory service and is not an exempt market dealer (EMD) nor a licensed financial advisor. We do not and cannot give individualised market advice. David Chapman has worked in the financial industry for over 40 years including large financial corporations, banks, and investment dealers. The information in this newsletter is intended only for informational and educational purposes. It should not be considered a solicitation of an offer or sale of any security. The reader assumes all risk when trading in securities and David Chapman advises consulting a licensed professional financial advisor before proceeding with any trade or idea presented in this newsletter. We share our ideas and opinions for informational and educational purposes only and expect the reader to perform due diligence before considering a position in any security. That includes consulting with your own licensed professional financial advisor.


El Dorado Raises $9M to Expand Cross-Border Fintech Platform
El Dorado, a Latin American fintech improving cross-border financial services, raised a $9 million Series A led by Paradigm with...


Bitcoin Stalls Near $60K as Strategy Moves, ETFs Outflow, and EU MiCA Rules Take Effect
Bitcoin hovers near $60,000 with ETF outflows, while Strategy boosts reserves, sells BTC, and raises dividends to reassure investors. Ethereum...


Cannabis Dominates Global Drug Use: Trends, Risks, and Shifting Markets
Cannabis remains the world’s most widely used illicit drug, with 256 million users in 2024, surpassing all others combined. Growth...


Italy Approves First Hydrogen-Powered Train for National Rail Network
ANSFISA has approved Italy’s first hydrogen-powered train, the Alstom HMU214, for use on the Brescia–Iseo–Edolo line. Capable of 140 km/h,...


Cotton Market Weakness Persists Despite Brief Rebound
Cotton prices fell to new lows last week before a modest rebound. USDA data shows crop conditions remain worse than...
 |
|
 |  |
 |
|
-

 Fintech6 days ago
Talentir Secures €4M to Transform Global Payouts
-

 Cannabis2 weeks ago
WNBA Removes Cannabis From Banned Substances List in New CBA
-
 Markets1 day ago
Cotton Market Weakness Persists Despite Brief Rebound
-
 Cannabis1 week ago
Trulieve NYSE Listing Signals New Era for Global Cannabis Industry
You must be logged in to post a comment Login