Markets
Chaos Unfolds: Trade Wars, AI Rivalry, and Market Turmoil
Week two of Trump’s presidency saw chaos: DeepSeek, a Chinese AI firm, challenged U.S. AI dominance, and Nvidia suffered a record market cap loss. Tariffs on Canada, Mexico, and China sparked a trade war. Canada cut rates, but U.S. inflation held steady. Markets declined, but gold surged, signaling potential economic turbulence ahead.

DeepSeek deep-sixed the markets. Yes, the markets have been making a bounceback, but the initial reaction was a gap-down break. Only the S&P 500 plus a few others such as the S&P 100 (OEX), the Russell 1000 and 3000, and the Wilshire 5000 recovered sufficiently so far to make new all-time highs. But barely. Can it continue? Just when they were rebounding along came the second shock with tariffs on Canada, Mexico and China to be followed quickly by retaliatory tariffs. No one wins in trade wars.
DeepSeek, a Chinese AI company nobody had heard of until suddenly they did, seemed to come out of nowhere. DeepSeek is not a stock-listed company. DeepSeek is a Chinese artificial intelligence (AI) company that develops open-source products that any company can access to make their own products. DeepSeek is owned by a Chinese Hedge Fund, High-Flyer, a company founded in 2023.
It’s the reaction in the stock markets that signals the possibility the market has topped for good. DeepSeek challenges the U.S. AI companies’ business models that depend on exclusive access to Nvidia’s powerful chips. Who needs Nvidia’s chips anymore? You now have DeepSeek. Why didn’t the American companies do the same creating open-source products?
They thought what they did was exclusive and they didn’t have to. DeepSeek undermines the “why” of these companies. Will China and DeepSeek be challenged? Possibly, but now the genie is out of the bottle and U.S. AI companies’ business models have just been kicked. (See also Chart of the Week, MAG7 performance since DeepSeek).
Markets did what they are supposed to do—they “freaked.” On January 27 they gapped down. In technical analysis parlance, we call that a breakdown gap, although it can have multiple names (usually a gap upwards is a breakaway gap but the names become interchangeable). Breakdown gaps are usually on high volume.
Volume jumped, which was no surprise. Nvidia became a poster child. On January 27 Nvidia lost a record $589 billion or 17% in one day, the biggest one-day loss for a stock, ever. Simply, Nvidia, along with a few others of the MAG7, notably Tesla, also crashed. But then they recovered. By the week’s end, four of the seven MAG7 were still up on the year. Some were even making new all-time highs.
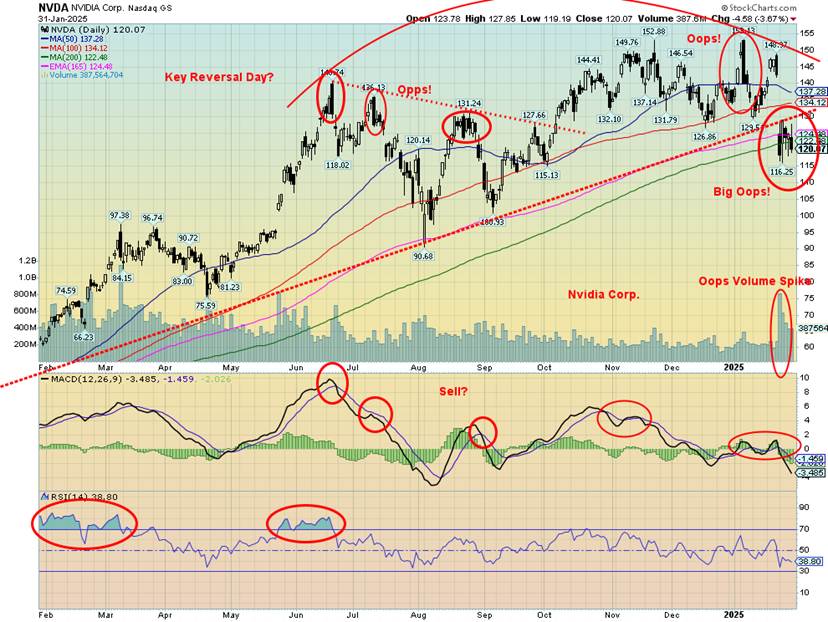
The next few days were spent rebounding in an attempt to fill the gap. Will it be successful or will it fail? Then came the tariffs quickly ending thoughts of a rebound. Nvidia’s chart below is just one big “oops” since June when it first had an outside key reversal day from all-time highs.
That it went on to new highs is not unusual, but the warning “oops” triggered another four “oops” moments, with this past week’s being the biggest. We are now trying to break free from the 200-day MA. Only that low in August at $90.68 stands in the way. A bear market is underway. Nvidia is already down over 20%, the definition of a bear market.
Nvidia chaos
We’ve consistently said that 2025 is going to be a year of chaos and volatility. So far, we haven’t been disappointed as chaos has reigned from the get-go. President Trump is entering the year with equity valuations at the highest level for the start of any president. A handy little table we found shows that S&P CAPE ratios are the highest ever for the start of a presidential term. (The CAPE ratio, also known as the Shiller P/E ratio, is the cyclically adjusted price-to-earnings ratio.
The ratio is calculated by dividing a company’s stock price by the average of the company’s earnings for the last ten years, adjusted for inflation.) In second place was the G. W. Bush presidency back in 2001, where we saw the internet/dot.com top followed by the crash of 2000–2002. G. W. Bush managed to “Oops! I did it again” when the sub-prime loan Lehman Brothers housing crash hit in 2008. In both instances, the markets fell 50% +.
However, in both instances for G. W. Bush, the Fed came to the rescue, lowering interest rates and providing oodles of liquidity to the markets (QE) and the banking system to prevent an even bigger crash. They did the same after the 1987 stock market crash, the 1998 Russian ruble Long-Term Capital Management (LTCM) mini-crash, and more recently the 2020 COVID pandemic crash.
Maybe it’s no surprise then to discover that since 2000 U.S. federal debt has exploded by $30.7 trillion (538%), total debt (governments, corporations, consumers) is up $76.1 trillion (298%), while GDP has gained $20.2 trillion (215%). It has taken $3.76 of new debt to purchase $1 of GDP. What happens when the next crisis hits? Are they running out of bullets? The fuel has been zero percent interest rates (ZIRP) and oodles of debt.
No, it is not as if the U.S. has been the only culprit, as central banks and governments in the developed world (G7) have followed the same blueprint to varying degrees. It’s probably no surprise that global debt is now around $360 trillion, 326% of global GDP. And the U.S. has almost one-third of it.
Every week appears to bring us new chaos. This past week saw the botched run-out of freezing the federal loans and grant programs. The closing sparked mass confusion and lawsuits. Medicaid was one of the programs negatively impacted. Funds are received by schools and charities and for food stamps and more. The impact is felt by all states.
The freeze also extended to all foreign-aid programs. Because of confusion and lawsuits, it took two days for the Trump administration to back down. If the freezing had been allowed to stand, one could ask: what does one need Congress for? They control the purse strings. Or do they? Or does only the president hold the purse strings? Undoubtedly, this will go to the Supreme Court.
The second confusion is the letter extended to some 2,000,000 federal government employees, offering buy-outs if they resign now. Again, the legality is being questioned and confusion and disruption are reigning. Many are wondering if they will get paid. There is no guarantee they will. As well, a government stop-gap funding bill only lasts until March 14.
After that, it is a question mark as to what happens next as funding bills have been contentious in the past. The funding bill could even involve cutting income taxes further, as well as extending the previous tax cuts. It has been shown that these cuts primarily benefit corporations and the very wealthy.
The week ended with the news that the Musk controlled DOGE had gained control of the U.S. treasury payments system. That system is responsible for sending out cheques to almost everyone notably Social Security and Medicare along with interest on the debt. Will it be legally challenged as well?
With the Fed standing pat on interest rates this past week, it immediately brought rebukes from the White House who want lower interest rates. The Fed standing pat was fully expected by the market as we note inflation is down but has recently ticked incrementally higher. Given that the most recent GDP numbers (Q4 advanced) showed GDP growing 2.3% vs. the expected 3% and the previous reading of 3.1%, many feel the U.S. economy is still humming along.
Unemployment is rising but hasn’t hit crisis proportions. This past week’s weekly claims came in at 207,000, well below the expected 228,000 and last week’s 223,000. Next week, February 7, 2025 we get the January employment numbers. The expectation is that 205,000 jobs were created vs. December’s 256,000. Watch for downward revisions. Unemployment (U3) is expected to remain at 4.1%.
Finally, the Fed’s favourite measurement of inflation, known as Personal Consumption Expenditures (PCE), came in at 2.6% (December) which was largely expected. But it is the highest in seven months. It is also up from November’s 2.4%. (See the following chart). The Fed rate remains above the key measurements of inflation: CPI, Core CPI, and PCE.
With the GDP still good and unemployment higher but nowhere near crisis levels, many continue to believe that the Fed is engineering a soft landing, the goldilocks economy. A warning is that these things tend to start slowly, then suddenly accelerate. Is this time different? We suspect not. The events of the past two weeks have not as yet being worked into the economy.
CPI, Core CPI, PCE, Fed Rate 2020–2025
Our next chart shows the latest Conference Board consumer confidence and consumer expectations, both of which fell this past month. The latest Consumer Confidence came in at 104.1 vs. last month’s 109.5 and the expected 105.6. Consumer expectations also fell more than expected. Is confidence in the U.S. economy waning? All this is before the events of January.
Housing is a very key part of the economy, but here things look shaky. Yes, lower interest rates help, but mortgages are priced off the bond market. It is interesting to note that, despite a small bounceback in the housing indicators (housing starts, new and existing home sales), they remain well below the highs of 2006–2008. The Fed cut rates but longer-dated interest rates rose, leaving consumers no better off.
Despite no Fed cut, chaos continues to reign. Gold and silver are reacting to that as there is a rush to safe havens and gold set new all-time highs once again. We can’t help but note that credit card delinquencies are rising, auto loan defaults of sub-prime loans are rising, and commercial real estate continues to be shaky.
Layoffs are underway at many companies, but unemployment is a lagging indicator.
Conference Board Consumer Confidence and Consumer Expectations 2007–2025
Housing Starts, New Home Sales, Existing Home Sales 1960–2025
Interestingly, and maybe it comes as no surprise, but insiders are selling. Our colleague Brahm Satov of CIBC Wood Gundy noted it recently, so we view this as a good add-on to conclude with. Brahm noted that as markets become more expensive, the probability of high future returns diminishes. Take profits and reduce exposure is the recommendation.
Seems we are now at all-time highs for insiders selling, according to the chart below from The Financial Times (www.ft.com). If the insiders are getting out, is that a signal we are nearing or at a top? Smart money is always the first to leave and the first to buy. Note: even Warren Buffet of Berkshire Hathaway (BKR) has raised some $350 million in cash. It’s the largest stockpile of cash in history for BKR. The question becomes: what does he know that others don’t?
The Insiders 2005–2025
Are the tariffs the final nail in the coffin? It was announced that 25% tariffs will be placed on Mexico and Canada and 10% on China. Exempt for the moment was energy (oil and gas). The markets freaked and sold off. Will Monday bring another round of selling? Uncertainty rules. Tariffs are by their nature inflationary and create considerable uncertainty. There are no winners in trade wars. Apparently, China announced that all U.S. imports will face a 75% tariff. Canada also announced retaliatory tariffs with Mexico to follow. The trade wars are on.
All of the recent action and chaos coming out of the White House has had some believe that the Trump administration may be deliberately trying to crash the economy. It would, of course, be to their benefit. We can’t help note that, following the housing sub-prime crash of 2008 equity funds, hedge funds and others swept in to buy up distressed housing at pennies on the dollar.
So, crashing the economy has some basis and would highly benefit the oligarchs. Where to hide? Many are recommending gold. Other places to hide might include other currencies such as Swiss francs and Japanese yen. Cash is obviously safe. We also note that blue chips—i.e. the Dow Jones Industrials (DJI)—did well this past week compared to other indices featuring growth stocks.
We live in interesting times.
Chart of the Week
MAG7 Performance January 21–31
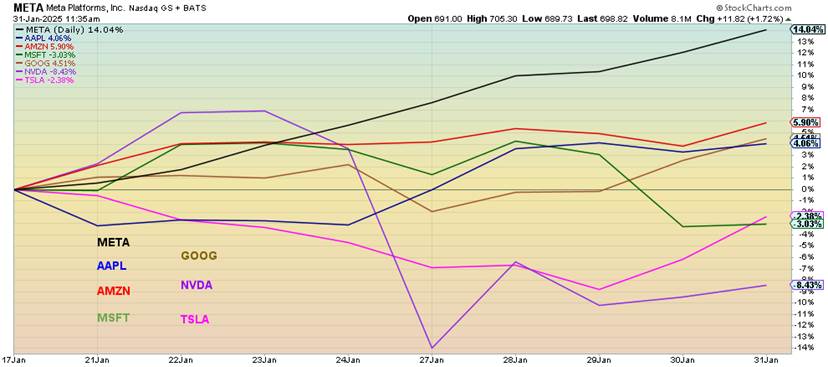
Following DeepSeek, the MAG7 were deep-sixed. Oops, hold that thought. Well, not as much as many might have thought. It was so bad that Meta, Amazon, and Google all jumped to new all-time highs. Apple lagged. The losers were Nvidia, Microsoft, and Tesla.
So much for the MAG7 bubble bursting, for the moment at least. It was bubble on. The expectation was that the MAG7 will continue to benefit from the AI revolution and profits will flow. We suppose cuddling up to Trump won’t hurt either. Nvidia (noted earlier) along with Tesla and Microsoft look the weakest—Nvidia because its powerful chips are threatened by DeepSeek’s open-source system.
Two years ago, Nvidia was trading at $11. Now it is $120 but down from the peak of $153. Tesla also took it on the chin but not because of DeepSeek. Falling sales hurt Tesla. It’s now trading at $404, down from the peak of $488. In 2020 you could have bought it at $24. Finally, Microsoft gapped down as well and now looks toppy. It’s trading around $415, but that’s down from the all-time high of $467 in June. Microsoft fell 6.5% this past week.
As for the rest, well, it seems to be “party on.” After all, Zuckerberg (Meta), Bezos (Amazon), Musk (Tesla), Brin (Google), Ballmer/Gates (Microsoft), and Huang (Apple) are all multi-billionaires. Poor Cook (Apple) has to settle for being a very large multi-millionaire. Most are so big that some countries pale in comparison.
Inequality, unfortunately, has been a by-product of our age, which is why we have no problem comparing today to the period of the Gilded Age and the Roaring Twenties. Note: both of these eras ended eventually, but it took depressions and wars to bring them to an end. The Gilded Age was officially over with World War I, but before that had been a couple of steep recessions/depressions. The Roaring Twenties culminated in the
Great Depression and World War II. Is this time different? Not likely. It’s just different. Ironically, the two ages ended with millionaire presidents in the U.S. The Gilded Age ended with William McKinley and Theodore Roosevelt while the Roaring Twenties ended with Herbert Hoover. Millionaires all. Notably, all were Republican presidents. Irony? Coincidence?
Irrespective of this, the MAG7 bubble seems to be still alive and well. Things, however, are not looking up for Nvidia and Tesla. Meta and Microsoft are spending oodles of money to purchase Nvidia chips to build data centres. Apple, Amazon, and OpenAI are spending oodles to build chips to compete with Nvidia.
They’ve all been like meme stocks. We have a lot of them in the cryptocurrency world as well. Nobody announces when the party is over. It just happens. Ask the Nifty Fifty of the 1960s–1970s. Ask the tech stocks of the 1920s or the railway stocks of the Gilded Age. Or the housing market in 2007.
Markets & Trends
| % Gains (Losses) Trends | ||||||||
| Close Dec 31/24 | Close Jan 31/25 | Week | YTD | Daily (Short Term) | Weekly (Intermediate) | Monthly (Long Term) | ||
| Stock Market Indices | ||||||||
| S&P 500 | 5,881.63 | 6,040.53 | (1.0)% | 2.7% | up | up | up | |
| Dow Jones Industrials | 42,544.22 | 44,544.66 | 0.3 | 4.7% | up | up | up | |
| Dow Jones Transport | 16,030.66 | 16,306.84 | (1.8)% | 2.6% | neutral | up | up | |
| NASDAQ | 19,310.79 | 19,627.44 | (1.6)% | 1.6% | neutral | up | up | |
| S&P/TSX Composite | 24,796.40 | 25,533.10 | 0.3% | 3.3% | up | up | up | |
| S&P/TSX Venture (CDNX) | 597.87 | 623.75 (new highs) | 0.4% | 4.3% | up | up | neutral | |
| S&P 600 (small) | 1,408.17 | 1,448.24 | (0.5)% | 2.9% | neutral | up | up | |
| MSCI World | 2,304.50 | 2,420.26 | 1.7% | 5.0% | up | up | up | |
| Bitcoin | 93,467.13 | 101,795.81 | (3.0)% | 8.9% | up | up | up | |
| Gold Mining Stock Indices | ||||||||
| Gold Bugs Index (HUI) | 275.58 | 312.70 | 2.2% | 13.5% | up | up (weak) | up | |
| TSX Gold Index (TGD) | 336.87 | 390.99 | 3.8% | 16.1% | up | up | up | |
| % | ||||||||
| U.S. 10-Year Treasury Bond yield | 4.58% | 4.54% | (1.9)% | (0.9)% | ||||
| Cdn. 10-Year Bond CGB yield | 3.25% | 3.09% | (6.4)% | (4.9)% | ||||
| Recession Watch Spreads | ||||||||
| U.S. 2-year 10-year Treasury spread | 0.33% | 0.34% | (5.6)% | 3.0% | ||||
| Cdn 2-year 10-year CGB spread | 0.30% | 0.43% | 16.2% | 43.3% | ||||
| Currencies | ||||||||
| US$ Index | 108.44 | 108.29 | 0.8% | (0.1)% | up (weak) | up | up | |
| Canadian $ | 69.49 | 68.26 (new lows) | (2.1)% | (1.8)% | down | down | down | |
| Euro | 103.54 | 103.70 | (1.2)% | 0.2% | down | down | down | |
| Swiss Franc | 110.16 | 109.81 | (0.5)% | (0.3)% | down | down | neutral | |
| British Pound | 125.11 | 123.98 | (0.7)% | (0.9)% | down | down | down (weak) | |
| Japanese Yen | 63.57 | 64.48 | 0.6% | 1.4% | neutral | down | down | |
| Precious Metals | ||||||||
| Gold | 2,641.00 | 2,835.00 (new highs)* | 1.1% | 5.2% | up | up | up | |
| Silver | 29.24 | 32.26 | 3.5% | 10.3% | up | up | up | |
| Platinum | 910.50 | 1,043.70 | 7.4% | 14.6% | up | up | up (weak) | |
| Base Metals | ||||||||
| Palladium | 909.80 | 1,071.80 | 6.2% | 17.8% | up | up (weak) | down | |
| Copper | 4.03 | 4.28 | (0.9)% | 6.2% | up | neutral | up (weak) | |
| Energy | ||||||||
| WTI Oil | 71.72 | 72.53 | (2.9)% | 1.1% | neutral | neutral | down | |
| Nat Gas | 3.63 | 3.08 | (10.7)% | (15.2)% | down | up | neutral | |
Week two of the Trump presidency and the chaos just keeps on going. This week saw attempts to control the payment systems, including funds already authorized by Congress. We also learned at the end of the week that attempts are being made by Musk’s team to take control of the payments system at the U.S. Treasury, including already firing key officials. Congress has the final say on the payment systems. If they are taken over by the president, as one pundit pointed out, you no longer need a Congress.
It was also a dystopian week with the bizarre blame from the president on the air crash over the Potomac River in Washington. Everybody was blamed and every reason assigned to the crash, ignoring the fact that before the crash occurred the head of the FAA had been fired, air traffic controller hiring was frozen, the aviation safety commission was disbanded, and employees of the FAA were given buyout ultimatums along with the rest of the federal civil service.
Apparently, one air traffic controller was doing the job of two. More chaos is expected for the coming week. It is noteworthy that the payments system and keeping payments going impacts everything from Social Security cheques to paying interest on the debt.
Chaos was also unleashed over DeepSeek, the Chinese AI company that deep-sixed the stock market. Markets gapped down on January 27 but then recovered. However, tariffs were hinted at and then confirmed and on Friday the market up move was aborted, with a stock market sell-off in the afternoon as the fear of tariffs set in. And this is only week two.
On the week, the S&P 500 (SPX) fell 1.0%, the blue-chip Dow Jones Industrials (DJI) rose a small 0.3%, the Dow Jones Transportations (DJT) continues to diverge widely with the DJI as it fell 1.8%, and the tech-dominated NASDAQ fell 1.6%. The S&P 500 Equal Weight Index fell 0.5% while the NY FANG Index fell 2.1%. The S&P 400 (Mid) was off 1.1% while the S&P 600 (Small) dropped 0.5%.
In Canada, the TSX Composite rose 0.3% and the TSX Venture Exchange (CDNX) appeared to break out, making new 52-week highs. However, on Friday it fell and finished the week up 0.4%. In the EU, the London FTSE made all-time highs, up 1.8%, the Paris CAC 40 was up 0.3%, the German DAX made all-time highs, up 1.6%, and the EuroNext gained 1.4%. In Asia, China’s Shanghai Index (SSEC) on a holiday-shortened week fell 0.1%, the Tokyo Nikkei Dow (TKN) was off 0.9%, and Hong Kong’s Hang Seng (HSI) gained 1.1%. The MSCI World Index rose 1.7%. Bitcoin fell about 3.0%.
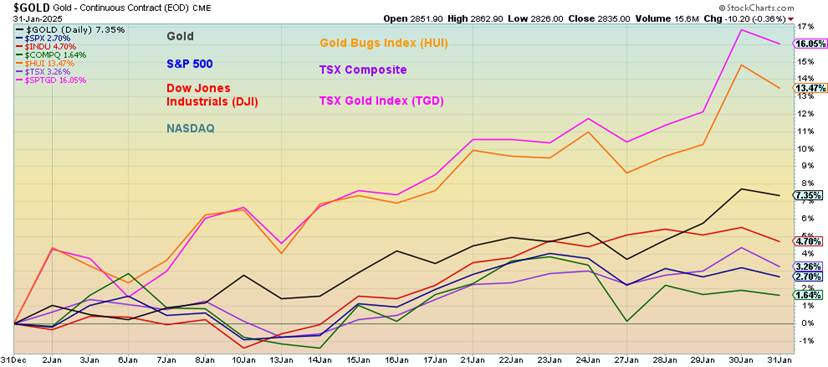
The month of January is over and the winners for the month were the gold indices. The Gold Bugs Index (HUI) was up 13.5%, and the TSX Gold Index (TGD) gained 16.1%. Gold was up 7.4% and, while not shown, silver gained 10.3%. The S&P 500 was up 2.7%, the DJI gained 4.7%, and the NASDAQ was up 1.6%. Golds remain our number one place to be in 2025, irrespective of ups and downs.
Indeed, if the stock markets follow Friday’s down day again on Monday, we suspect gold may also follow. But remember that back in 2008 and again in 2020 gold was the first out of the chute. The gold stocks get hit harder than physical gold. And physical gold tends to outshine the stock markets. Gold, unlike stocks or bonds, has no liability.
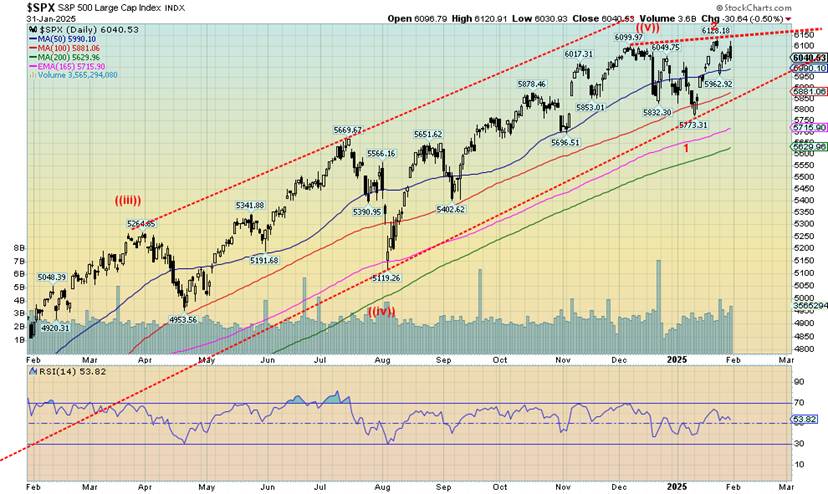
The SPX appears to be making a potential top. No, it is not as yet confirmed. First, we need to fall through 5,960, then through 5,775 to confirm a top. Once through 5,775, potential downside targets could be 5,400. The 200-day MA could provide some support near 5,600. But the reality is we have now had two weeks of chaos and more appears to be on the way. What is happening is unprecedented.
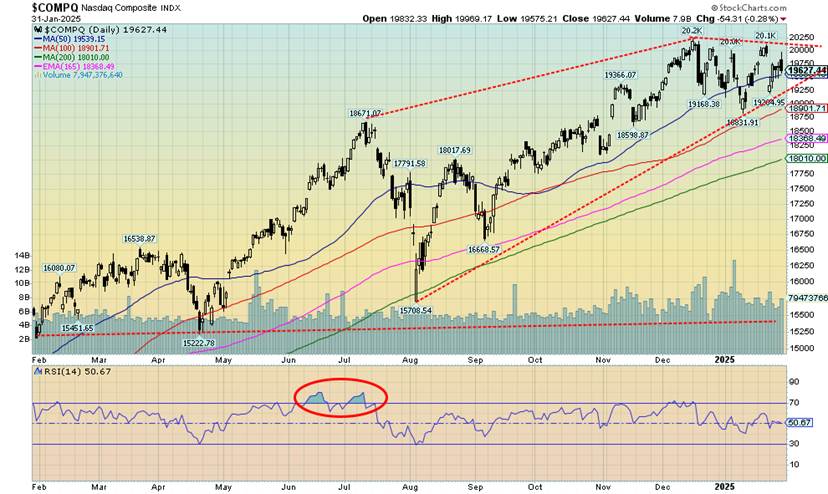
That was quite a gap down for the NASDAQ on January 27 as DeepSeek deep-sixed the market. Then came the recovery. But the recovery may have aborted on Friday as fear of tariffs sunk in. On the week, the NASDAQ lost 1.6%. You could say it was led by the MAG7 and the FAANGs. The NY FANG Index fell 2.1%. But the really big loser was Nvidia, down a whopping 15.8%, following its record decline for a single stock (estimated at $589 billion) on January 27.
Nvidia wasn’t the only big loser as Broadcom fell 9.6% and Microsoft was off 6.5%. But other MAG7 stocks made all-time highs including Meta, Amazon, and Google. Snowflake also made an all-time high, but it is not a member of the MAG7. Meta was up 6.4% and Apple gained 5.9%.
The NASDAQ is making an interesting pattern. It’s almost a rare diamond pattern. The middle part should be higher than the left or right side. Nonetheless, it is looking interesting and we do suspect it is top. Under 19,250 will be the first good sign of a top. Under 18,825 would seal the deal and potentially project a decline to 17,450. New highs would change that scenario. However, we now put low odds on any new highs. Markets are too troubled. The question is, after Friday’s decline, could we start to crash on Monday?
Despite a down Friday along with other stock indices, the TSX bucked the down week, gaining a 0.3%. The TSX Venture Exchange (CDNX) did a bit better, up 0.4% as it made 52-week highs. Despite that, the CDNX remains mostly moribund, down 44% from its 2021 highs and down 81.5% from its all-time high set in 2007. It seems like a daunting task for the CDNX. The CDNX appeared to be breaking out on Thursday, but Friday’s negative day pushed it back under the breakout line. So we need more evidence we are breaking out. Some 50% of the CDNX is junior mining stocks.
On the week, eight of the TSX sub-indices were up and six were down. Leading the way up was Information Technology TTK, up 4.4% to fresh 52-week highs. Golds TGD were next, up 3.8%. Of the losers, Energy TEN was the bigggest, down 2.8%, while Consumer Discretionary TCD, which could be quite negatively impacted by tariffs, fell 1.5%.
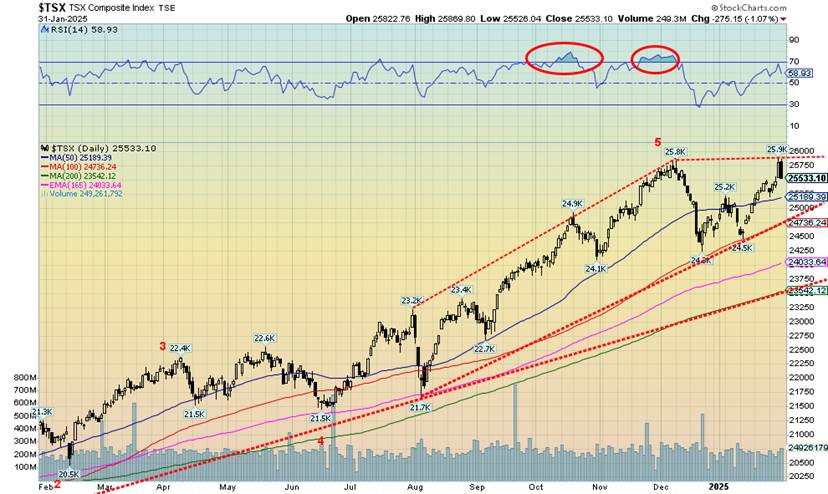
Has the TSX created a roof? We fell just short of new all-time highs. Technically, we could consider this a potential double top. But we need to break under 24,700, then 24,500 to suggest the top. If that happens, targets could be down to 22,000/23,000. New highs would end thoughts of breaking down. However, we put low odds on that happening now.
U.S. 10-year Treasury Note, Canada 10-year Bond CGB
Bond prices rose this week as yields, which move inversely to prices, fell in the early part of the week. U.S. treasuries sold off on Friday in response to the notice about pending tariffs. Still, the U.S. 10-year treasury note fell to 4.54% this past week, down from 4.63% the previous week. In Canada, the Government of Canada 10-year bond (CGB) fell to 3.09% from 3.30%, helped by the Bank of Canada (BofC) lowering the bank rate once again by 25 bp to 3.00%.
The FOMC also met this past week and, as was widely expected, the Fed stood pat. That’s much to the chagrin of President Trump, who wants lower interest rates. But ticking up inflation might frustrate him on that.
That said, a major fight between Trump and Fed Chair Jerome Powell could be on. That would not be good. Former Fed Chair Arthur Burns fought with President Richard Nixon, but then appeared to accede to his desire for lower interest rates, despite clear signs of rising inflation before the 1972 election. Nixon won the election. But Burns and the Fed lost some credibility. The Fed’s independence is paramount in order to keep political manipulation out of the monetary system. All central banks operate under the same premise.
Nonetheless, the tariffs spooked the bond market after hitting a low the previous day. The PCE prices, which came in largely as expected but still somewhat elevated, did nothing to impact the bond market. But the threat of tariffs sent bond prices lower. The bond market is potentially Trump’s Achilles’ heel. He can fight with the Fed but the Fed only impacts the short end of the curve. The bond market, which is huge and global, does not respond to threats from any president. If foreigners who hold some $8 trillion of U.S. treasuries decide to sell, there is little he can do.
Ditto for funds, even in the U.S. It would put pressure on dealers and others to buy these bonds and naturally then meet them by lowering prices (higher yields). That in turn would have a negative impact on the mortgage market and everything priced off the bond market. It would also negatively impact corporate bonds that price off of U.S. treasuries. BBB credits, the lowest investment level rating, could be neagtively impacted and some could fall below BBB into junk bond status. The bond market is larger than the stock market.
Yields are at trendline support. A break of 4.50% could send yields lower. But a move back above 4.63% would be negative.
Tariffs might actually be good for the U.S. dollar. The Cdn$ was hit Friday on the tariff moves. The Cdn$, which fell 2.1% this past week, hit fresh 52-week lows, closing at 68.26. The Mexican peso dropped 2.0% this past week. Other currencies also fell. The euro was off 1.2%, the Swiss franc was down 0.5%, the pound sterling dropped 0.7%, but the Japanese yen defied the down move, thanks to threats of higher interest rates gaining 0.6%. The Chinese yuan was also off but the drop was small.
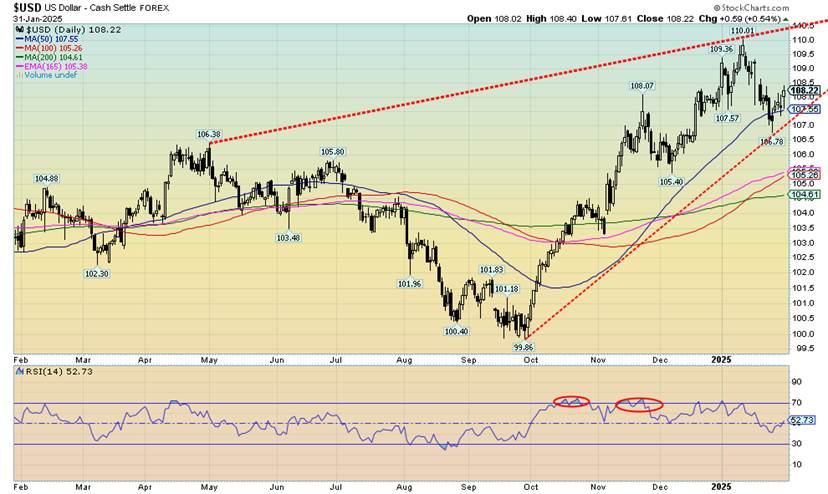
After hitting a low of 106.78 earlier in the month, the US$ Index has been rebounding. However, we need to break out over 109.25 to suggest new highs above 110.00. Tariffs could push the US$ Index higher, at least initially. But where things might go wrong is in the bond market if foreigners decide it’s time to dump U.S. treasury securities en masse. That in turn could lead to a falling US$ Index as they take their U.S. dollars to convert back into their home currency. There is resistance up to 109; hence, a breakout over 109.25 could be positive. Another break of 107 would be negative and we could fall towards 105.
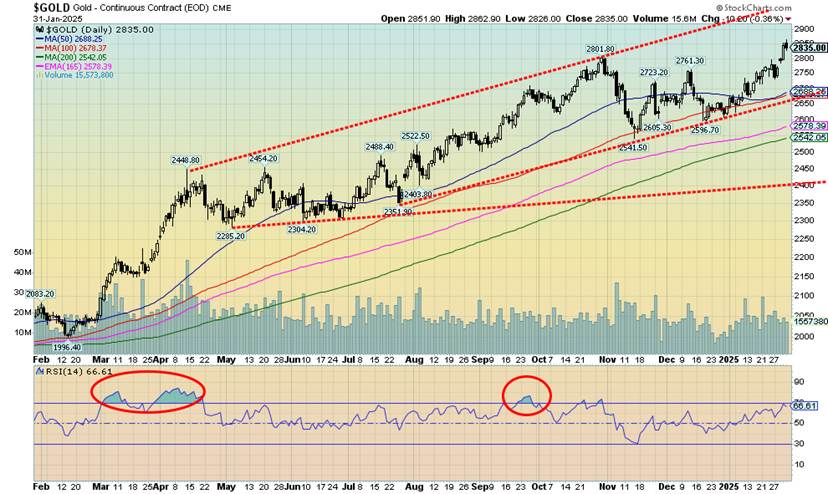
Gold is the safe haven in times of geopolitical troubles, inflation/deflation, and market turmoil. Gold has been around as a monetary metal for over 3,000 years and is viewed as a reliable store of wealth. Gold has no liability. Given recent market uncertainty and volatility, it may be no surprise that gold rose 2.0% this past week to record highs at $2,835. Because of the strong US$ Index, gold had no trouble making all-time highs in all currencies. Gold is also protection against currency depreciation.
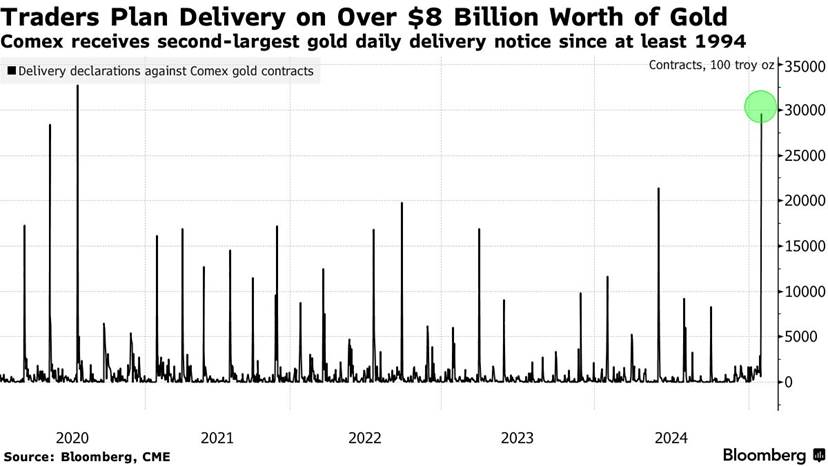
There is no doubt that Trump is rattling the markets. And that is positive for gold. But what we are seeing is something we haven’t seen before. There is a rush on to acquire physical gold. “There is incredible demand for physical gold in New York markets,” according to Peter Spina of Goldseek (www.goldseek.com). It is noted that Trump’s tariff plans could send gold to $3,500. Shortages are developing for physical gold.
JP Morgan, the world’s largest bullion dealer, is delivering some $4 billion of gold bullion for settlement of futures contracts. Despite this, gold did pull back on Friday after the announcement that tariffs would indeed take place: 25% on Canada and Mexico (with oil & gas exempt for the moment) and 10% on China. 100% tariffs are threatened on the BRICS who have been trying to develop an alternative to the U.S. dollar and an alternative to the global payments system known as SWIFT. In a word, this could soon get ugly.
Other metals were also up. Silver gained 3.5%, while platinum was up 7.4%. Of the near precious metals, palladium gained 6.2% but copper waffled down 0.9%. We’d prefer to see copper leading.
In all, some $8 billion worth of physical gold could be delivered by the various bullion banks to cover futures contracts. So far, it is the second largest daily delivery notice since 1994. Gold futures have surged over spot prices. Gold finished the week for futures at $2,835 while spot was $2,800. A large physical settlement is noteworthy, as the futures market usually only sees paper trades. Usually positions are rolled over or cashed out, not replaced with physical good.
Despite the huge delivery, we don’t know whether this was for arbitrage purposes or for existing short positions. The big five bullion banks besides JP Morgan are Goldman Sachs, BNP Parisbas, Deutsche Bank, and Morgan Stanley.
Regardless of short-term gyrations and pullbacks, gold is going higher. Unlike Bitcoin, you can actually touch it, hold it. Friday might be start of a pullback, or not. As long as we hold above $2,650/$2,700 we’re going higher. Holding $2,800 would be positive, but if not, down to $2,750 would still be okay. $2,900 is in sight where we might expect some resistance.
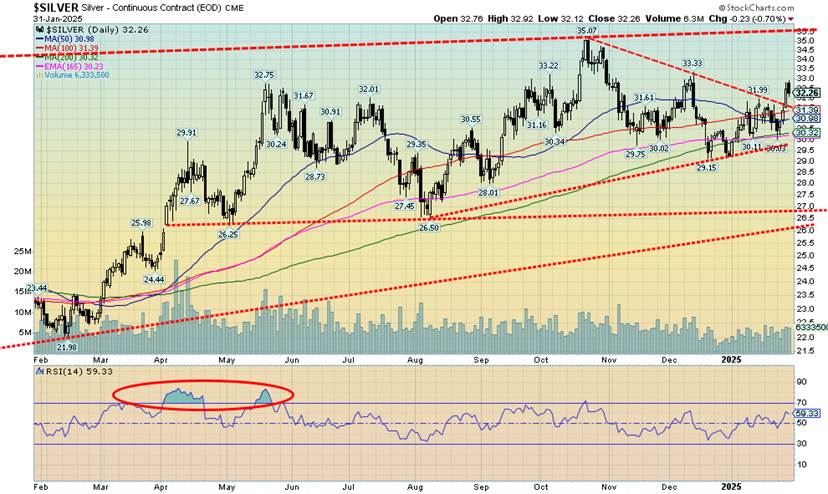
For a change, silver enjoyed a good week, surpassing the gains seen for gold. Silver gained 3.5% and is now up 10.3% in January. We also surpassed $32, a point we previously noted that needed to be taken out if we are to go higher. Still ahead, however, is that we need to take out $33.75/$34 to tell us that we should see new highs above the October high of $35.07. If that happens and we clear $35, then our next targets could be $39/40. However, that leaves us a long way from the all-time highs near $50 seen in 1980 and 2011. As we have noted, the reality given inflation is we need to see silver at $175 or $65 to equal the 1980 and 2011 highs on an inflation-adjusted basis.
We did break our downtrend from the October high. A pullback could take us down to $31.50 and we’d still be okay. But if we were to fall back under $31 and particularly under $30 we’d be in much more trouble. It would be helpful if we can soon take out that high in December of $33.33. We remain positive and bullish on silver but can’t rule out pullbacks. The final key point is $30 as we do not want to see that level breached. RSI is at a relatively neutral 59 so it does have considerable room to move higher.
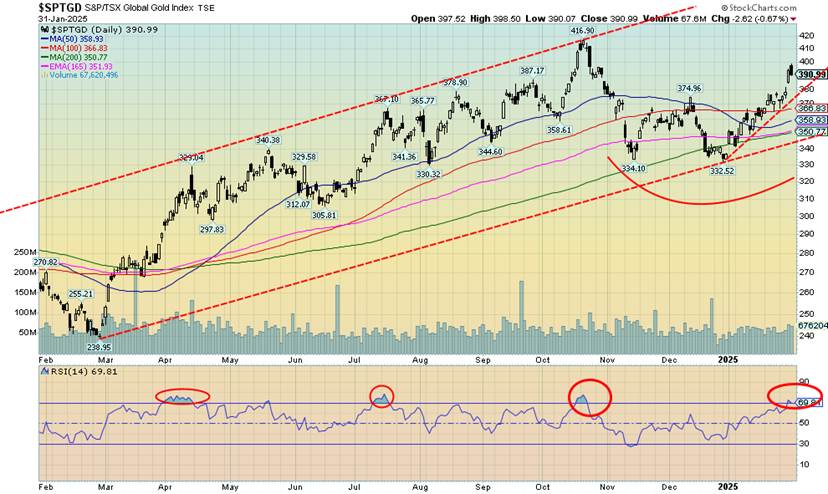
It was another up week for the gold stocks as the TSX Gold Index (TGD) gained 3.8% and the Gold Bugs Index (HUI) jumped 2.2%. The two indices are the best performing, up 16.1% and 13.5% respectively for January. If there is a fly in the ointment, Friday’s tariffs that sparked a stock market sell-off also hit the gold stocks. The TGD fell 0.7% on Friday but held its gains for the week.
We’ve had a nice move up from that December low, but we can’t help but note that the RSI was overbought, over 70 (briefly). Overbought is a condition that can linger for some time. The TGD needs to break out over 400 to suggest to us that new highs above the October high of 417 could be seen. We believe we will eventually see new highs, but for the moment the upward thrust could be on hold.
A breakdown under 380 would be negative and could send us to support near 365 and even as low as 350. The move down from the October high appears to have unfolded in an ABC corrective fashion. But we need that close over 400 to tell us that the low is in and we could expect new highs.
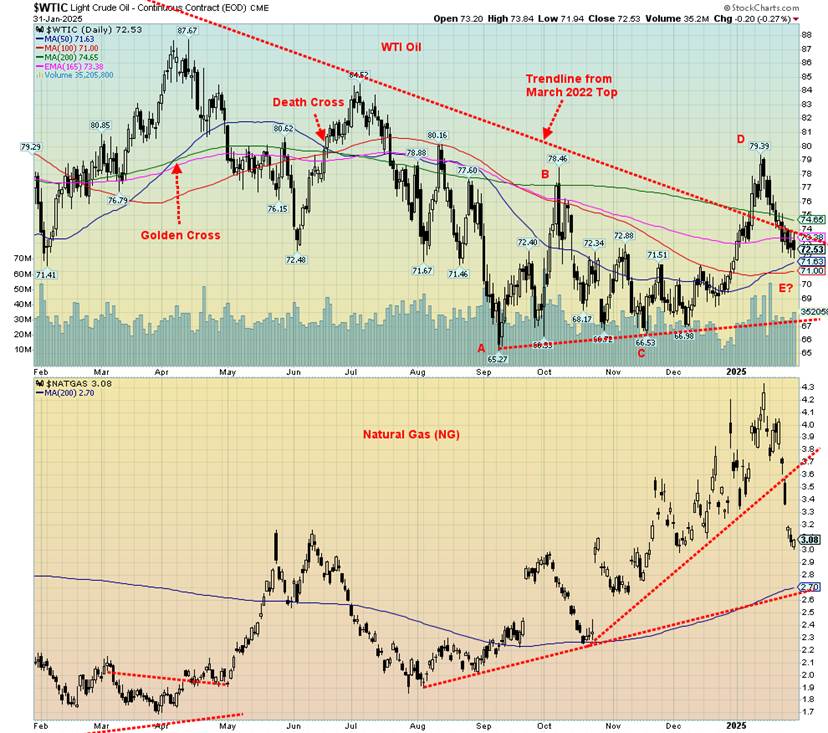
Oil prices can’t seem to get out of the way of themselves. For the second consecutive week, they fell. WTI oil was down 2.9% while Brent crude fell a smaller 1.3%. Natural gas (NG) was more mixed as warmer weather in North America and plentiful supply pushed Henry Hub NG down 10.7%. It was the opposite in the EU as colder weather and supply issues pushed NG at the EU Dutch Hub up 7.8%. The energy stocks respond to what’s happening in North America as the ARCA Oil & Gas Index (XOI) fell 3.4% while Canada’s TSX Energy Index (TEN) was off 2.8%.
Tariffs could be the catalyst for higher oil prices. So far, tariffs on Canada’s energy supplied to the U.S. have been deferred to around mid-February. But it does create a lot of uncertainty. Canada supplies roughly 52% of the U.S. oil & gas imports. It also represents some 97% of Canada’s oil & gas exports. The U.S. has the refineries to deal with Canada’s heavy oil. Other countries do not, which makes it difficult for Canada to just switch to them. Pipelines are established and plentiful. Shipping oil by sea is potentially dangerous, given the potential for oil spills.
Another catalyst for higher prices could be Trump’s request to the oil companies to “drill, baby, drill.” The oil companies have said that can’t happen without higher oil prices. That’s the opposite of what Trump wants, which is lower oil prices. No surprise that all the easy oil has been found. More oil has been found, but it’s located in more challenging environments or the deep sea. “Drill, baby, drill” can happen, but only at higher prices.
Then there is the Middle East where a dust-up with Iran could send oil prices soaring. That’s always a risk.
__
(Featured image by Solen Feyissa via Unsplash)
DISCLAIMER: This article was written by a third party contributor and does not reflect the opinion of Born2Invest, its management, staff or its associates. Please review our disclaimer for more information.
This article may include forward-looking statements. These forward-looking statements generally are identified by the words “believe,” “project,” “estimate,” “become,” “plan,” “will,” and similar expressions, including with regards to potential earnings in the Empire Flippers affiliate program. These forward-looking statements involve known and unknown risks as well as uncertainties, including those discussed in the following cautionary statements and elsewhere in this article and on this site. Although the Company may believe that its expectations are based on reasonable assumptions, the actual results that the Company may achieve may differ materially from any forward-looking statements, which reflect the opinions of the management of the Company only as of the date hereof. Additionally, please make sure to read these important disclosures.
Copyright David Chapman 2025
David Chapman is not a registered advisory service and is not an exempt market dealer (EMD) nor a licensed financial advisor. He does not and cannot give individualised market advice. David Chapman has worked in the financial industry for over 40 years including large financial corporations, banks, and investment dealers. The information in this newsletter is intended only for informational and educational purposes. It should not be construed as an offer, a solicitation of an offer or sale of any security. Every effort is made to provide accurate and complete information.
However, we cannot guarantee that there will be no errors. We make no claims, promises or guarantees about the accuracy, completeness, or adequacy of the contents of this commentary and expressly disclaim liability for errors and omissions in the contents of this commentary. David Chapman will always use his best efforts to ensure the accuracy and timeliness of all information. The reader assumes all risk when trading in securities and David Chapman advises consulting a licensed professional financial advisor or portfolio manager such as Enriched Investing Incorporated before proceeding with any trade or idea presented in this newsletter.
David Chapman may own shares in companies mentioned in this newsletter. Before making an investment, prospective investors should review each security’s offering documents which summarize the objectives, fees, expenses and associated risks. David Chapman shares his ideas and opinions for informational and educational purposes only and expects the reader to perform due diligence before considering a position in any security. That includes consulting with your own licensed professional financial advisor such as Enriched Investing Incorporated. Performance is not guaranteed, values change frequently, and past performance may not be repeated.


Crypto Lending Hits $30 Billion, Becomes Key DeFi Pillar
The decentralized crypto lending market has surpassed $30 billion, signaling a structural shift in capital use. Protocols like Aave and...


Advances in LDL Cholesterol Management for Familial Hypercholesterolemia: From Statins to Innovative PCSK9 and CETP Inhibitors
PCSK9 inhibitors have transformed LDL cholesterol management in familial hypercholesterolemia, with new antibodies and CETP inhibitors like obicetrapib expanding options....


Italian Unlisted Banks Lag on ESG Sustainability
Standard Ethics’ benchmark of 25 major unlisted Italian banks finds only 36% meet full ESG sustainability standards, while 60% lag...


Cotton Prices Rise Amid War Tensions, Weather Risks, and Supply Concerns
Cotton prices rose last week amid the US–Iran conflict, production cost increases, and adverse weather. Hot, dry conditions in key...


Bitcoin Slides, Ethereum EEZ Emerges, Worldcoin Hits Low
Bitcoin slipped to around $67,000 amid geopolitical tensions and ETF outflows, while high mining costs push miners toward AI deals...
 |
|
 |  |
 |
|
-

 Impact Investing2 weeks ago
Antarctica Warming Reshapes Global Atmospheric Circulation
-
 Crypto2 days ago
Bitcoin Slides, Ethereum EEZ Emerges, Worldcoin Hits Low
-

 Business1 week ago
Anemic Labor Market and the End of Passive Money Flows
-

 Fintech6 days ago
DZ Bank Pioneers Blockchain Bond Issuance, Advancing Tokenized Finance