Business
The COVID-19 pandemic is a catastrophe for the world’s economy
As governments race to try and contain the spread of the COVID-19 they have created a second monster. Social distancing and shutting down huge swaths of the economy may help slow the spread of the COVID-19, but it is creating an economic disaster on a scale never imagined before. Add in the collapse of the energy sector and the monster just got bigger. There are not enough lifeboats.
Having images of the 2008 financial crash and the sinking of the Titanic dancing in my head is not what we’d consider a good time. Yet those two events are what comes to mind watching the carnage unfold because of the COVID-19 crisis. Fortunately, we weren’t around for the 1929 crash or we’d be visualizing that one as well. We were around for the 1987 stock market crash, but in the end the fallout from that one was fairly contained. And no, we weren’t around for the 1912 sinking of the Titanic either; however, James Cameron brought that one to life with his 1997 film, a film that remains one of the most iconic of our time.
It is quite a feat thinking of helicopter money. Images of helicopters flying around, unloading buckets of money down on the populace as they scurry around like maniacs trying to fill their pockets and even beating up the other guy so they can grab his share too are not something we’d really like to dwell on. But that is effectively what is being proposed. U.S. Treasury Secretary Steve Mnuchin has said the administration plans to send money to Americans immediately. The same idea is being proposed in the EU. Senator Mitt Romney, R-Utah wants the government to send every adult $1,000. Senator and Democratic Presidential candidate Bernie Sanders, D-Vermont wants to send $2,000. Cost? About $500 billion. What’s another trillion for the deficit? But that’s for this month. What about next month? Or the month after that if the COVID-19 crisis persists, as the experts expect.

The helicopter money seems to be the least of it. They need the Carpathia, but instead it is a rowboat coming that could take four months or longer, not four hours. Tellingly, even the Carpathia was too late. The U.S., Canada, Australia, Japan, EU (France, Germany, Italy), China, U.K., and more have unleashed a plethora of fiscal and monetary measures to counteract the disruption sparked by the COVID-19. But to what effect? Fiscal and monetary measures include the following, depending upon the country:
- Lowering of interest rates
- Quantitative easing (QE) – bond-buying
- Increased repo operations
- Broadening of collateral for repos
- Loans to business
- Packages for small and medium business and workers negatively impacted
- Selective tax cuts
- Increased and enhanced unemployment insurance
- Stimulus packages for the economy
- Lowering of reserve requirements
- Cuts to lending facilities
- Outright purchases of commercial paper, bankers’ acceptances, and other money market instruments (another form of QE)
What this is going to do to deficits is unknown, but one thing is guaranteed: deficits will not go down as they will soar. But by how much? The U.S., with Federal government debt already at $23.6 trillion and 108.7% of GDP, is already past the danger point of a debt to GDP ratio over 100%. In Canada, we are reading that this year’s budget deficit could exceed $100 billion, a record.
Social distancing and quarantine may be a solution for the disease, but they are a disaster for the economy. Small and medium business make up 70% of the consumer economy, but with restaurants, bars, and retail already suffering, unemployment is sure to soar for gig workers, part-time workers (who make up 15–20% of the total employed in both Canada and the U..S.), the self-employed and freelancers. They do not have the fall-back that many others have of unemployment insurance or other support packages to assist workers negatively impacted by this. As for the businesses, at least 35–50% of them can’t survive beyond a month and will go bankrupt. Estimates on how long this situation will last is months, not weeks. We can only hope that it turns out to be the latter. They cannot all be bailed out. There are not enough lifeboats.
The reality is that in North America at least (probably the same in the EU as well) people are not prepared for a prolonged recession. In a worst-case scenario, the recession, which has most likely started, could turn into a depression. According to some U.S. numbers, 60% of Americans have less than $1,000 in savings, four in ten would have trouble meeting a sudden $400 expense, 78% of workers live paycheck to paycheck, and 28 million Americans are not covered by any health insurance. We are hearing of outrageous prices being charged in the U.S. for testing for COVID-19. There are not enough lifeboats.
The layoffs have already started. Airlines, automobile companies, entertainment companies, shipbuilders, hotels, retailers, and more are already amongst those that have announced layoffs here in Canada and the U.S. Job losses already number in the 10s of thousands. They say nothing about the small businesses—bars, restaurants, coffee shops, beauty salons, and more—that will, in the end, just disappear as they close their doors for good. In the U.S., the most recent weekly jobless claims leaped by 70,000, well above expectations and the highest since 2012. The March nonfarm payrolls are not due out until April 3, 2020. Could the March nonfarm payrolls be a negative number? In attempts to keep their doors open, numerous companies are trying other measures to keep their staff, including issuing pay cuts. However, expect their earnings to be downgraded.
According to a Reuters survey of economists, as many as 1.5 million new claims could be seen in next week’s release of the weekly initial jobless claims. Goldman Sachs is saying upwards of 2.25 million. A poll by SurveyUSA is even worse. The poll suggests that 9% of the U.S. workforce (14 million people) won’t take home a paycheck this week while another quarter are working reduced hours. Could the nonfarm payroll for March be negative 1,000,000? Here in Canada, it appears that there have been 500,000 new applications for employment insurance, representing 2.6% of Canadian employment. Percentage-wise, these numbers were last seen during the Great Depression—1932 to be precise. There are not enough lifeboats.
And now we learn about the collapse of Ronin Capital, a Chicago-based clearing firm operating on the Chicago Mercantile Exchange (CME). Ronin’s clients could not meet margin requirements as the margin required kept being raised because of the extreme volatility. No lifeboat for Ronin and their clients.
As consumer confidence wanes, big-ticket items will be deferred. Paying the price already is the tourism industry as airlines, cruise lines, the entertainment industry, and more reel from the collapse. Bankruptcies will follow. Eventually, this could flow into the over-leveraged housing market and we could see a housing crash of 10% to 50%. The Canadian consumer is amongst the most indebted in the world. Bankruptcies are sure to follow. Foreclosures and evictions could rise. There are not enough lifeboats.
The negative impact on the economy will not show up until the Q1 GDP numbers are available. Expectations are that they will be ugly. J.P. Morgan has forecast a 41% decline annualized for Q1 for China. For China’s Q2, a 22% decline. For the EU, a 22% decline in Q1 and 14% in the U.S. Q2 could be even worse. These aren’t recession numbers. They are depression numbers. Sure, they forecast a huge roar-back by Q4 but that is filled with “ifs.” And the big if is if the pandemic is brought under control and the shutdowns that currently prevail were to end. China is showing signs of coming out of it. But many are questioning this, particularly in the western part of the country where 700 million still live in relative poverty. In the EU and the U.S., the numbers are increasing, not abating.
For years, many of us have warned about the flow of easy money through QE and the massive growth of debt, particularly corporate and consumer debt. That is not to ignore the massive growth of government debt, whether it is federal, provincial, state, or municipal. But it is the corporate debt bomb that is the most worrisome as upwards of $20 trillion globally could be at risk. The sudden, unsustainable rise of the U.S. dollar could also tip many foreign companies over the edge as their debt is primarily in U.S. dollars. How this feeds back into the quadrillion dollar derivatives market is anybody’s guess. And at the heart of this, the central banks are running out of bullets. There are not enough lifeboats.
Unfortunately, this isn’t the half of it. As the global economy wavers, the danger is that there is social collapse as well. The economic repercussions of the COVID-19 are not fully understood. They could, if this lasts for months, impact the way the world operates. If demand falls, then supply follows as plants close and their workers are let go. Lower interest rates aren’t going to help if you’re battling a contagious disease. If people are afraid or now forbidden to go to restaurants because of the fear of infection, the number of restaurants will contract substantially. By extension, globalization is under threat. It could be positive if, as some claim, a return to a self-sufficient society follows. But that is not always the case as some countries have goods and services that others need and vice-versa and that is the essence of globalization.
The longer this persists and the free flow of goods and people is constrained, the more likely this could become the norm. Millions normally travel every year. But now borders are shut. When will they open? We don’t know. History has witnessed plagues before. One is reminded about the collapse of the Roman Empire. Ironically, two plagues had a considerable negative impact on the empire. First was the Antonine Plague (165–180 AD) that killed an estimated 5 million. This came at the end of what was known as Pax Romana and ushered in a century or more of military emperors, warfare in the provinces, civil wars, usurper emperors, and the eventual splitting of the empire into two—Western and Eastern. The second one was the Plague of Justinian (541–542 AD) that killed 30–50 million. This ushered in what became known as the Dark Ages. Back then there were definitely not enough lifeboats.
Already there are emerging winners and losers. The losers, of which there will be many, will be pushed further with downgrades to their credit, something that is already underway from the rating agencies such as S&P and Moody’s. Industries that are negatively impacted, some more severely than others, include: airlines, cruise lines, hospitality, automobile companies, railroads, energy companies, housebuilders, manufacturing and industrials, metals and mining, media (mostly television—how long can they last without sports?) lodgings (hotels, motels, B&Bs, Airbnb’s), entertainment, casinos, restaurants, banks (as credit deteriorates and loan losses mount), emerging markets and their financial institutions. Industries that we can be neutral on include: healthcare, pharmaceuticals, telecom and cable, consumer staples. Winners are few: technology (both software and hardware) and supermarkets.
We don’t know the extent of this or how long it will last. We came across a missive, alleged to have come from Goldman Sachs, suggesting that upwards of 150 million Americans could be infected with the coronavirus due to its communicable nature. While that is on par with the common cold, the danger zone is this is not the common cold or even the common flu. It’s worse. And any cure could be weeks, months, or over a year away. The race for a cure is underway and it involves countries and huge pharmaceutical companies as the cure could be worth billions. Industrial espionage would not be unusual. It took roughly two months to reach 100,000 cases on March 6. That increased to 200,000 12 days later. It took only three more days to reach 300,000. At the current rate, the number of cases could soar past 1,000,000 by early April.
The common flu infects on average from one individual, 1.3 others. Coronavirus infects from one individual, 2–2.5 others (the R0, or basic reproduction number). The common flu incubates for roughly 1–4 days; for coronavirus, 1–14 days. Only 2% of those who catch the common flu are hospitalized and the fatality rate is 0.1% or less. For coronavirus, the hospitalization rate is 19–20% and the fatality rate upwards of 4%. These are numbers according to the World Health Organization (WHO), Centers for Disease Control and Prevention (CDC), and the National Center for Biotechnology Information (NCBI).
If we project these numbers to the U.S. population, one could see a fatality toll of upwards of 4,000,000. So far, what has been officially reported is that the world has seen over 300,000 cases with over 13,000 deaths. To date, it has impacted 188 countries and territories plus one international conveyance, the Diamond Princess. That covers almost every country in the world (there are 197 listed). There are no reports from North Korea but, given its position between China and South Korea, the number of cases there could be in the thousands.
There are also reports and some evidence that China could be understating its current numbers. The coronavirus is expected by some to peak in roughly 8 weeks. Even at the current reporting growth, that could easily add another 1.5 million cases and 60,000 deaths. But can the health care systems handle it? Italy has had serious problems and problems are mounting everywhere else including the U.S. There are not enough respirators, masks, gowns, or even beds in many cases. And there are definitely not enough testing kits, something that is apparently untenable in the U.S. There are not enough lifeboats.
And into the midst of all of this came a most damning story. Apparently, as reported by MSM, Bloomberg, and others, some U.S. Senators sold stock holdings after receiving sensitive briefings at a high-level meeting that included corporate leaders in late January about the emerging threat of COVID-19. All this took place before the stock market plunged and while the Trump administration and GOP leaders were downplaying the potential damage the virus might cause. Apparently, there are lifeboats for some. 62% of first-class passengers survived the sinking of Titanic. As for the others, 43% of second-class passengers survived while only 25% of third-class passengers survived. Only 23% of the crew survived. Where were the lifeboats? There were not enough.
Mr. Andrews, there aren’t enough lifeboats.
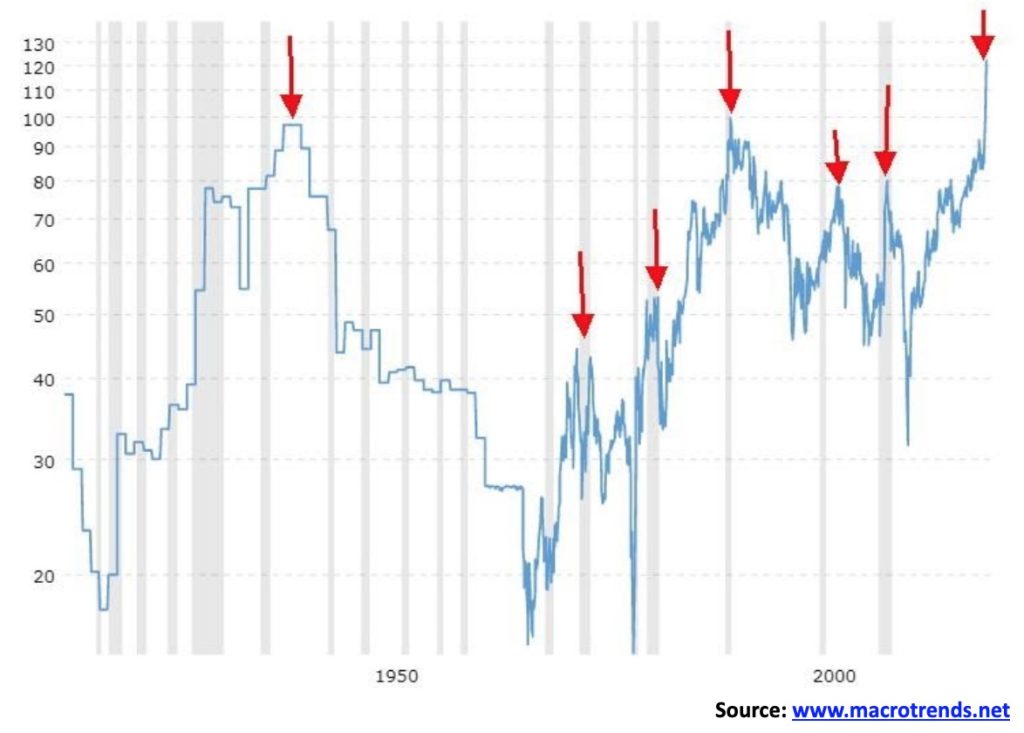
Overlooked amongst the record-breaking days of the DJI was the gold/silver ratio, reaching new astounding heights. When the gold/silver ratio hit a peak this week at 131.41, it was apparently the highest ever achieved, dating back over records 5,000 years old. The ratio of gold to silver in nature is 17.5. That’s a long way from 131.4. Dating back 5,000 years during the time of Pharaoh Menes (circa 3100 BCE), they set the ratio at 2.5. During the period of King Hammurabi of Babylon (c. 1810–1750 BCE), the ratio was set at 6. Under the legendary Greek king Croesus (c. 560 – c. 546 BCE) the ratio was set at 13.33. Croesus was known more for his love of gold and it was during that period that Greek gold and silver coins came to be.
Under the Romans, the ratio was changed again. It was set at 12 and by the time of Constantine 1 (280–337 CE) the ratio was set at 10.5. In 1792, the U.S. set the ratio by law at 15. In 1803, France set it at 15.5. The highest ever achieved before this year was an average rate of 99.76 in 1940.
One thing became clear in looking at this 100-year chart of the gold/silver ratio: it is that the gold/silver ratio tends to peak as recessions are getting underway (recessions represented on the chart in gray). The 1940 peak, which is our first red arrow, was achieved during the early days of WW2. Before that, it did achieve an average of 77.09 in 1936 at the height of the Great Depression. In 1931, as the Great Depression was really getting underway, the ratio averaged 71.25.
The ratio made peaks in 1973 as the 1973–1975 recession got underway, and again in 1981–1982 during the 1980–1982 recession. The next highest peak occurred in 1991 during the recession of the early 1990s. The peak in 2003 missed the 2000–2002 high-tech/dot.com recession, but it was back on target, topping in December 2008 at the height of the 2007–2009 Great Recession and the Lehman Brothers’ financial collapse. That low came in 2011 as gold hit over $1,900 and silver topped out around $50. The previous low was seen in 1979–1980 when gold hit a peak of $875 and silver also peaked around $50. So, could this record-breaking gold/silver ratio be already portending the coming of the next Great Recession? Or worse?
At these levels, owning a bit of silver might be a wise idea. We do note, however, that 1 OZ silver coins are trading at Silver Gold Bull at upwards of Cdn$7 over spot. Normally they trade at $2/$3 over spot. Interesting as well that Silver Gold Bull notes to expect delays in shipping and many products are limited or out of stock due to unprecedented demand.
Under ideal conditions, we’d love to congratulate everyone for participating in a record week. Actually, it is a series of records. Except they are records for all the wrong reasons. Just as we thought we had seen all the records broken for the largest point drop in Dow Jones Industrials (DJI) history, along came March 16, 2020—an astounding 2,997-point drop, dwarfing the previous record set on March 12, 2020, with one of 2,352. Nine of the ten largest point drops in DJI history have been seen since February 24, 2020.
But a different record came about that fateful day of the 2,997-point drop. The percentage drop that day was 12.93%, making it second-largest percentage decline to the historic October 19, 1987 drop of 22.61%. We can say the October 1987 crash is probably safe. The drop surpassed both the October 28 and October 29, 1929 declines. Combined, that 1929 drop is probably safe but who knows in this market.
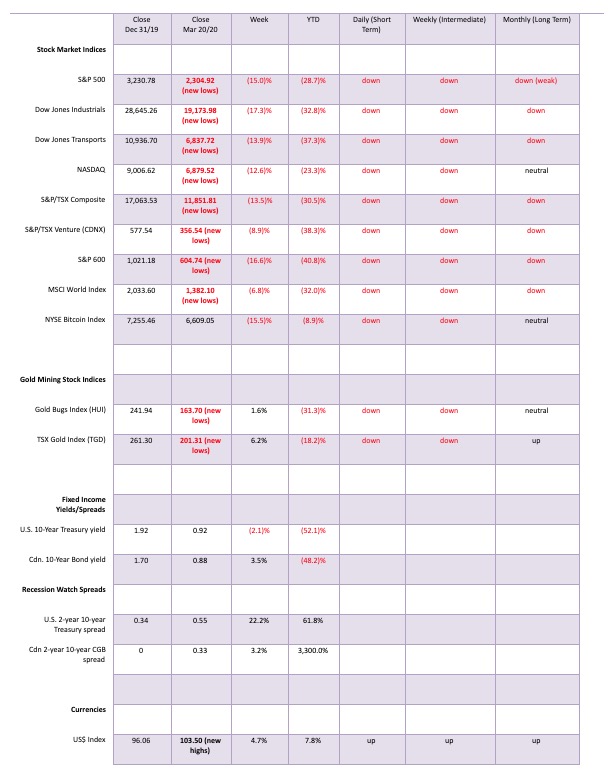
Markets were hammered this past week as the COVID-19 crisis gripped. The S&P 500 fell 15.0%, the DJI was down 17.3%, the Dow Jones Transportation (DJT) creamed 13.9%, and the NASDAQ lost 12.6%. Most indices are now down 30% + on the year. The S&P 600 small-cap fell 16.6% and is now down over 40% on the year. The TSX Composite was off 13.5%, but the TSX Venture Exchange (CDNX) in a potentially positive sign only fell 8.9%.
Elsewhere, it was the same. The MSCI World Index dropped 6.8% (a surprise), the London FTSE fell only 3.3%, the Paris CAC 40 was off 1.7%, and the German DAX dropped 3.3%. Still, all are down over 30% on the year. Tokyo’s Nikkei Dow (TKN) fell 5.0% while China’s Shanghai Index (SSEC) dropped 4.9%. All in all, a miserable week.
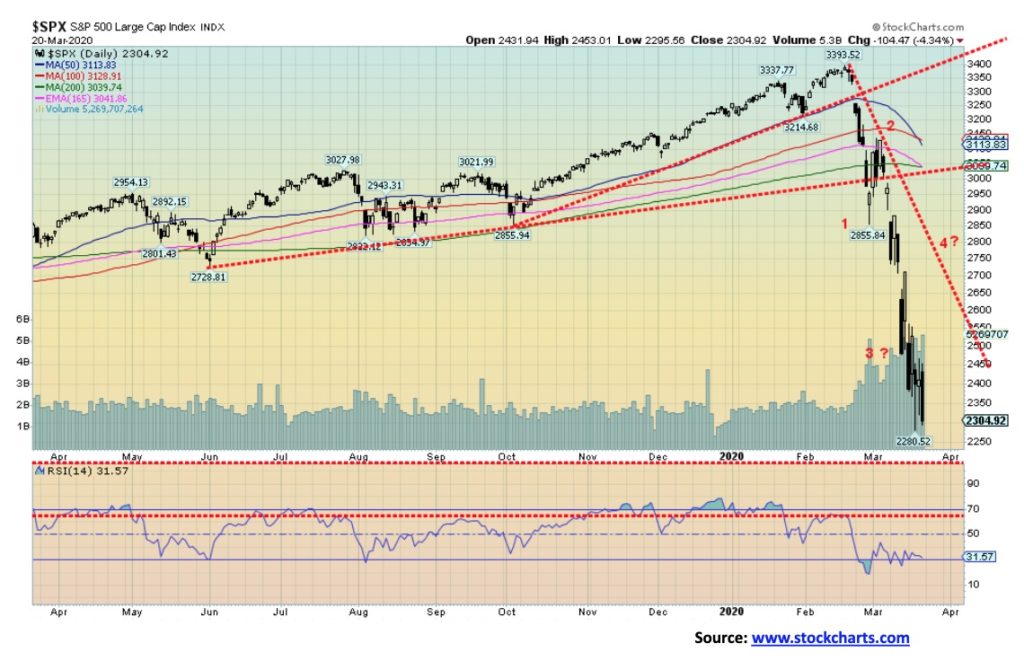
The speed of the transition from bull to bear is something we’ve never seen in 50 years in markets. Even with other declines such as the 2008 financial collapse there were decent warning signs. Other than lofty levels, this market gave no warning. It was poof and down 30%. The market has effectively wiped out in a heartbeat three years of gains and in some cases four years of gains. This is a bear market for the record books and dare we say it portends not a recession but a depression. Unfortunately, we can’t predict when a bottom will occur. We can only say that, given the right conditions, a rebound rally could occur anytime. Or we could go even lower. One hedge fund manager is predicting a decline of 74%.
Oversold is merely the excuse someone going bankrupt says when they are hoping and praying the market rebounds. The market can stay oversold longer than he can stay solvent. And there are, we understand, a number of hedge funds in trouble plus other funds. That could add to the malaise if they are forced into liquidation. Forced liquidation attracts no bid and they could care less about everyone else. The baby gets thrown with the bathwater and that includes gold, even though it has outshone everyone else.
The drop has been unnerving. Who cares about Fed cuts when everyone is going to be unemployed or going bankrupt? That doesn’t put the market back where it was. Recovery in this market could be a long trudge. Possibly years. Think 1929 or Japan 1990. It took until 1954 for the DJI to recover its 1929 high and Japan is still waiting 30 years later.
When all is said and done, we could be near at least a temporary bottom. There has been considerable babble about drugs that might be a cure or at least a stabilizer for COVID-19. The trouble is, it could also turn out to be false hope as for everyone that has a cure there is another one who says that isn’t feasible. But we are not seeking the truth, only a potential tradeable rebound that might get its trigger from announced cures. Certainly, Trump has every incentive to embrace whatever cure comes his way, especially one coming from Israel. This is not to say it isn’t, but merely that different factions have their own political agendas and the COVID-19 crisis is already very political. Shelter in Place and Emergency Powers is something that we have never experienced. They give the state immense powers. But how long will these extreme powers remain in place?
China and South Korea appear to have stabilized their cases. So, what’s their secret and why aren’t they sharing it with the West? That’s hard when Trump is blaming China for the crisis and name calling heightening xenophobic attacks. As we note, COVID-19 has become very political with competing factions. But all we are interested in is a tradeable rally.
We noted these crashes usually go through three phases: a crash, a recovery, and then a long grind to the downside. The first phase is in place even if it may not have bottomed just yet. A return to the bull market of the past 11 years is not going to happen. However, many if not most, will remain in denial.
Governments are doing all they can to provide liquidity to the street, but one has to be concerned about the mounting debt in a world with already far too much debt. And then unemployment is going to rise and, by all indications, rise sharply. Will a housing crash follow? Quite probably. Wall Street will be bailed out, but it is Main Street that really needs to be bailed out. Main Street was swimming in debt; now they will be drowning in it.
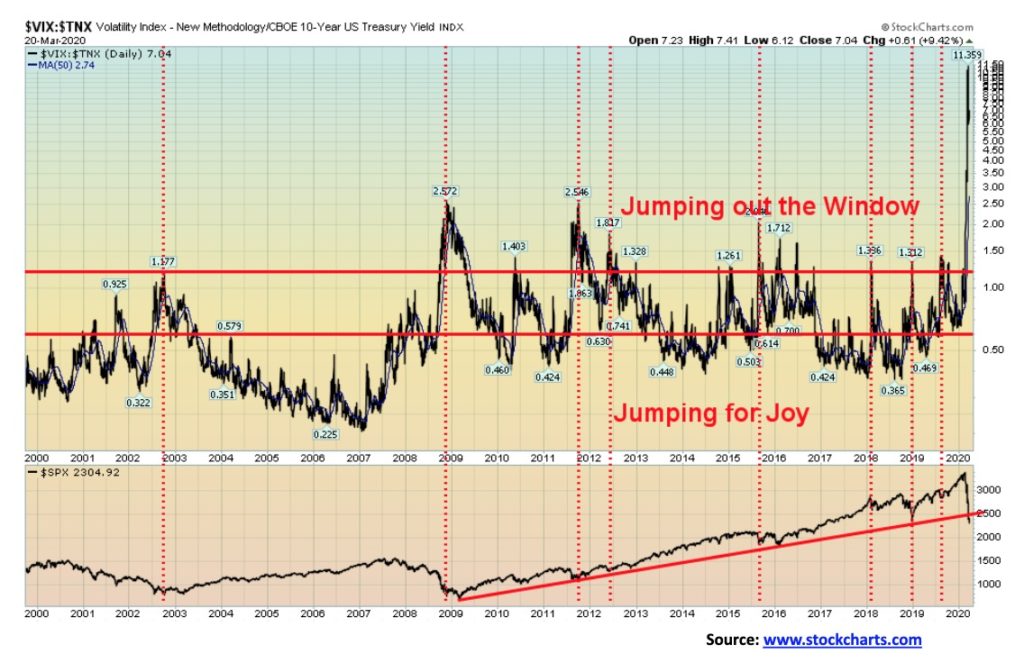
There are some small divergences between the S&P 500 and the VIX volatility indicator and even between large-cap and small-cap. Does that indicate a rally? Not necessarily. Below is another take on the VIX as a ratio with 10-year U.S. treasury notes. Volatility exploded to the upside and, while there are some divergences being seen between the S&P 500 and VIX, there are none visible here. The S&P 500 has broken the long uptrend line from the March 2009 low. A long bear is just about assured.
We don’t enjoy being the bearer of bad news, but what we have just witnessed is unprecedented. Unless, of course, you were there for the 1929 crash. However, it is highly unlikely anyone alive today was an active participant in that as most alive today would be children. The crash of 2020 could be our 1929. A generational shift. The early returns are not encouraging. Our best hope is that some treatment is announced, even if it turns out later to be a dud. It would give at least temporary relief and it could also help spark a rally that lasts for a few months; i.e., our phase 2 of this bear. The downtrend line from the top is the most enticing. Resistance is up near 2,700. But even that’s a 17% move from current levels. Otherwise, the low might not yet be in. The election 2016 low is at 2,083 and the February 2016 low is at 1,810. A break under 2,200 could set up the former. A break under 1,990 could set up the latter. The 1929 first phase was a 47% drop. That level today would take the S&P 500 down to 1,800 and the February 2016 low. We can’t rule that out, not yet anyway. That is the nature of this bear.
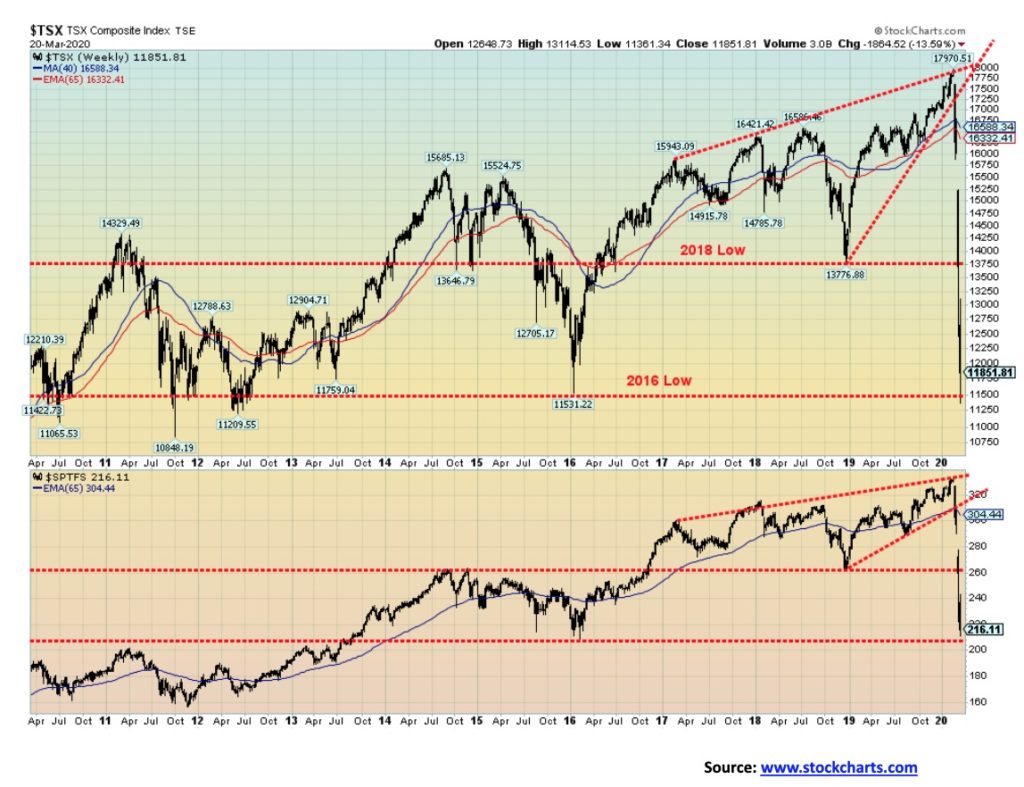
We have never seen such swift devastation. In a mere four weeks, the entire bull market from the lows of February 2016 has been wiped out. Technically, there is considerable support in here because of lows for the TSX in 2010, 2011, 2012, 2013, and 2016. Any serious breakdown through 11,500 could send us swiftly back to the lows of 2009 near 7,500. For the TSX Financials there is support here, but the next level is down to 160, then down to the lows of 2009 near 90. Altogether, that would imply a 60% drop for the TSX and a 73% drop for the TSX Financials. At this stage we can’t say that can’t happen. It has been that kind of drop and we freely admit we don’t know where the bottom is. First, we need to find some consolidation above the 2016 lows. Then we need to regain at minimum 13,800 for the TSX and 265 for the TSX Financials. We have less faith in financials, mainly because they could be facing substantial loan losses. We also note that every TSX sub-index and the TSX hit new 52-week lows with one exception—Information Technology. Despite making new lows, the TGD closed higher on the week, a reversal. Materials also managed to eke out a small gain after making fresh 52-week lows.
There has been an area that has shone in this carnage. As we have pointed out numerous times, gold has outperformed. We put together a table below that shows performance of gold in Cdn$ vs. the TSX and each of the TSX sub-indices. The table speaks for itself:
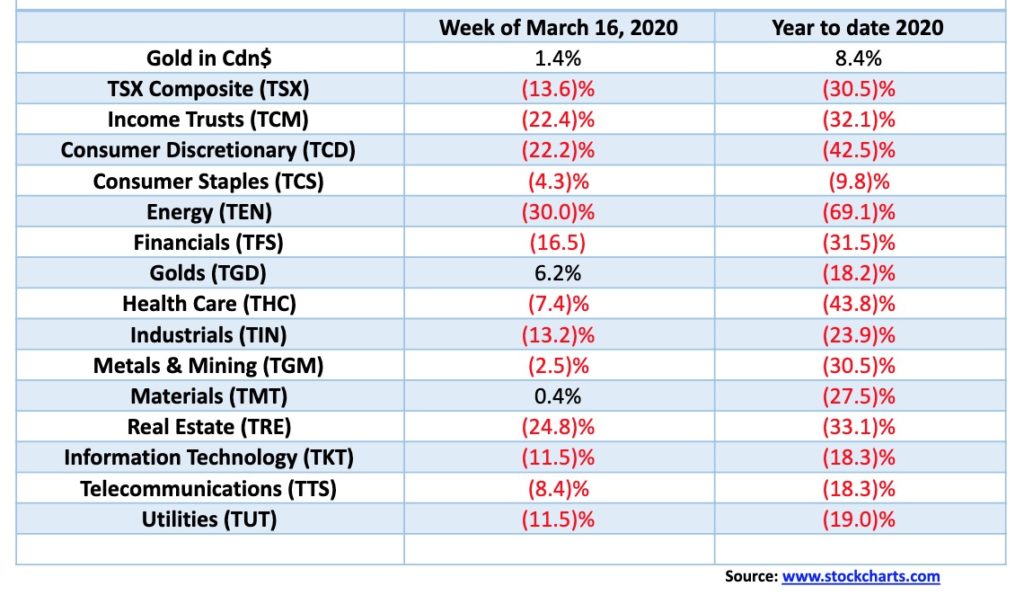
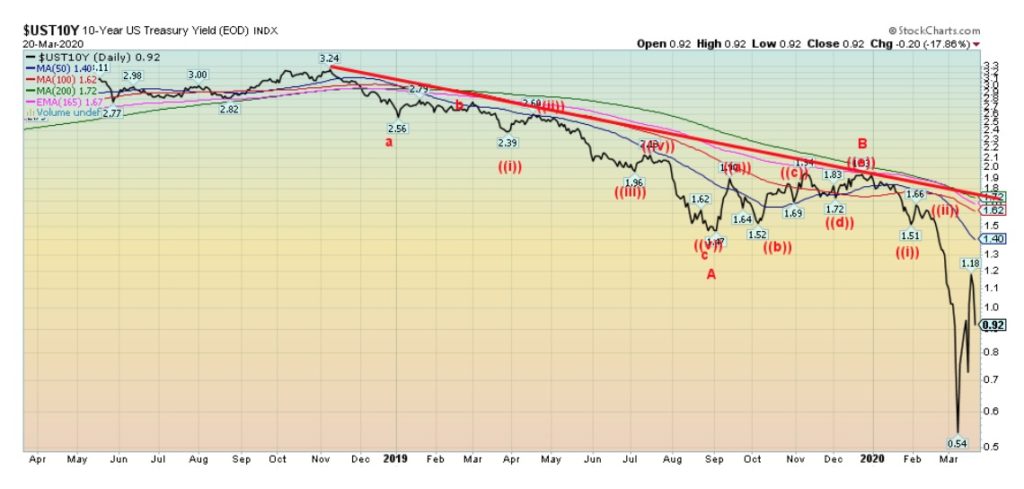
The U.S. 10-year treasury note fell slightly this past week to 0.92% from 0.93% the previous week. It hit a peak a little over a week ago at 1.18% on fears of increased debt being issued by the U.S. treasury to combat the COVID-19 crisis and bail out the banks. Rates initially fell after the Fed cut the Fed rate to zero on March 16, 2020, but rose sharply after that on fear of increased debt. Treasury bonds provided no cushion from the collapsing stock market. Normally one expects yields to fall when stocks are falling. Not this time. The fear of too much debt being dumped on a market already saturated with debt is most likely more than they can handle. Mortgage rates were perversely rising, even as the Fed cut rates to zero. Banks are not lending money as they are too fearful, despite receiving handouts through repo programs and QE. They will have cash but they could also be facing large loan losses.
For months we wondered about the Fed’s repo program. And today we still don’t know. All we know is that is did not have anything to do with QE. It was staving off a liquidity problem in the banking system as banks were unwilling to lend to each other. And we still don’t know the extent of this. Our concern is that with mounting government debts interest rates are going to rise, not fall as many expect. Unless the Fed is going to buy everything. And that is possible as well.
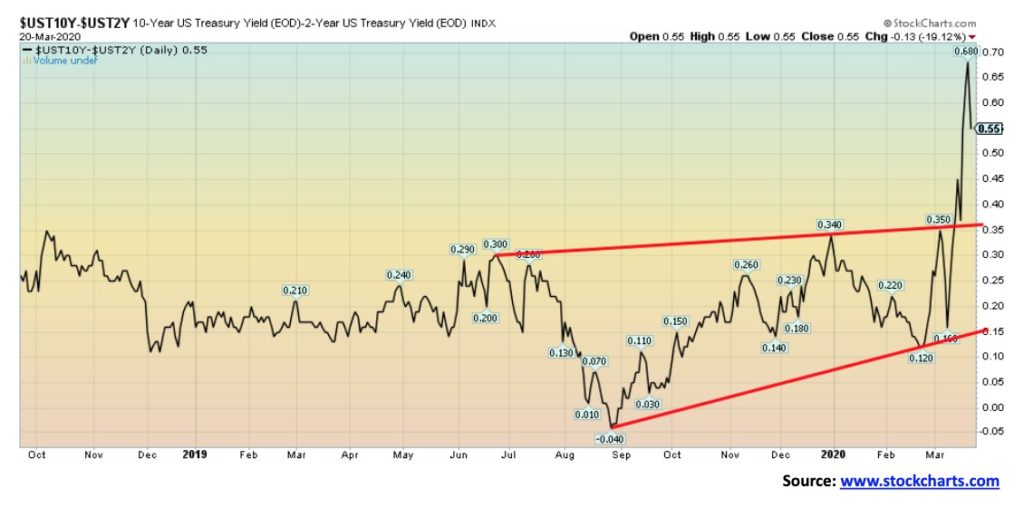
The recession watch spread keeps widening this time out to 55 bp up from 45 bp the previous week. The recession spread always has in the past widened as the potential for a recession grips. We believe a recession has already started. The spread should widen further before it finally stops.
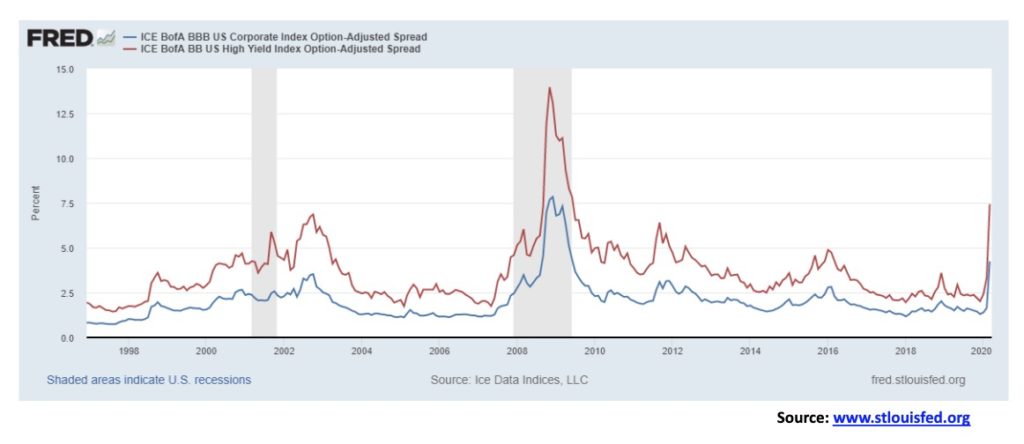
Credit conditions continue to deteriorate. BBB debt, the lowest investment-grade debt spread over 10-year U.S. treasuries, is now at 4.25%, the highest seen the financial crisis of 2008. The spreads on BB debt, the highest-ranked junk bond debt, is now at 7.43%, also the highest since 2008. Officially, a recession hasn’t started but all the signs are there. The question is, how much of the U.S. corporate debt rated BBB or lower totaling at least $10 trillion is going to blow up in this crisis. Already downgrades have started and, once they start, the pension funds, insurance companies, mutual funds, and more holding BBB debt have to get rid of it as they are not allowed to hold below investment grade debt. Except there probably will be no bid. We have always noted that the collapse of the corporate bond market in the U.S. and Canada is a bigger danger than the government debt.
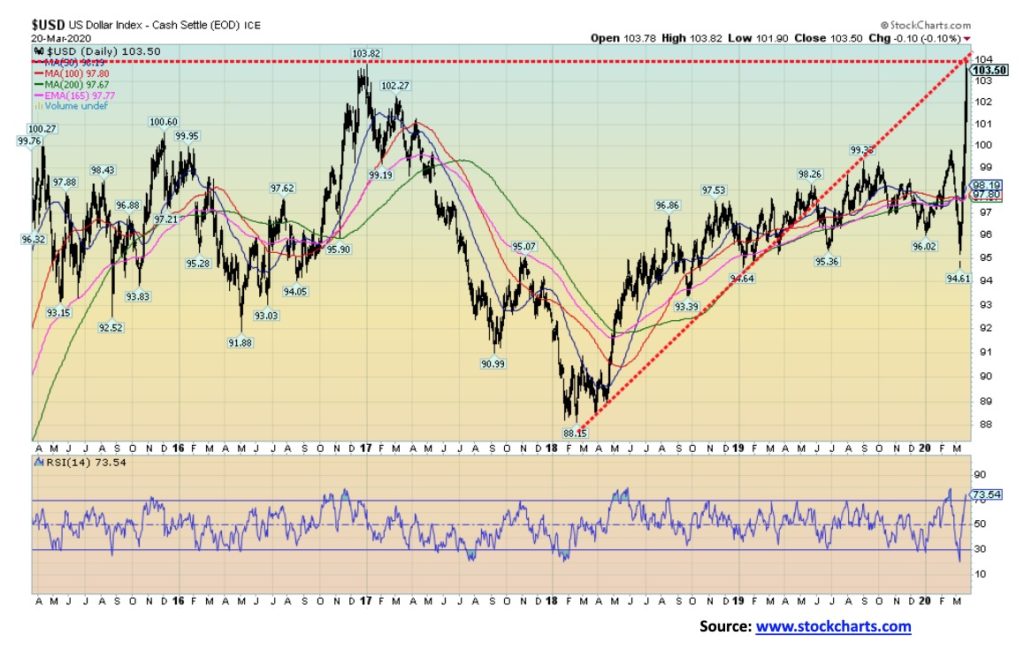
Nothing has demonstrated more that the U.S. dollar is the world’s currency than the action this past week. Seems everyone is scrambling for U.S. dollars. As if that is going to save them. The U.S. dollar’s dramatic reversal was as spectacular as the collapse of the stock market, except in the opposite direction. The US$ Index equaled the high of 2016 this week at 103.82 and could go higher. Although, as our chart shows, we are potentially at a level that could offer stiff resistance for further gains. The sharp rise in the U.S. dollar is a disaster for the billions of dollars of debt denominated in U.S. dollars issued by foreign entities. Their earnings are in their home currencies, yet they have to pay back U.S. dollars. We expect defaults on a wide scale. Moves like this are usually unsustainable, but under current circumstances, it is difficult to say.
The surge in the U.S. dollar is coming primarily from emerging markets as they slash interest rates and the COVID-19 crisis grips the world. Capital flows into the U.S. dollar have reached record levels in the billions in less than two months. Some currencies such as the Russian ruble and the Mexican peso have collapsed 20% or more. The rush out of Asia is on the scale of what took place in 1997 during the Asian financial crisis. Central banks are scrambling to deal with the problem, but if this continues one can see the makings of a potential Plaza Accord as was seen in 1985. But given the un-cooperation that prevails these days, we don’t put much hope in that happening. The market didn’t even react to the Fed cutting interest rates to zero putting U.S. rates on par with many others.
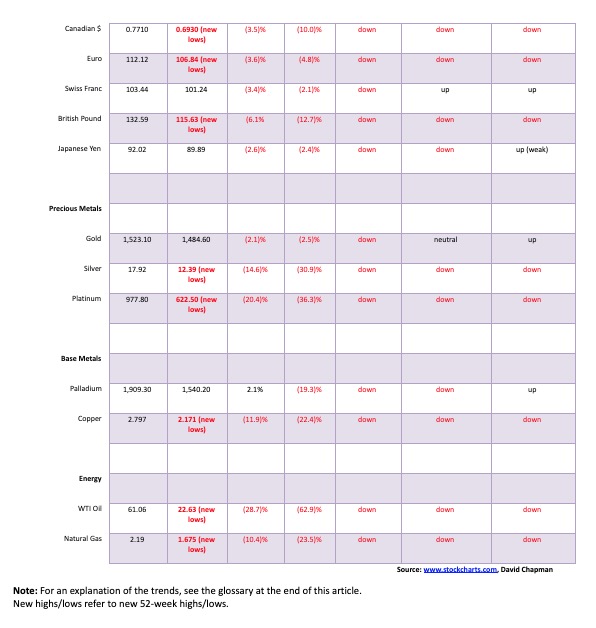
The euro as expected was the main beneficiary of the US$ Index’s rise falling to new 52-week lows losing 3.6% on the week. The Swiss franc remains the strongest losing only 3.3% but is still positive on the year. The pound sterling was hammered down losing 6.1% (Brexit?) and is now down 12.7% on the year. Finally, the Japanese yen lost 2.6% and is down 2.3% on the year. Yes, the Canadian dollar also fell losing 3.5% and is now down 10.0% on the year.
Our concern is the euro. Europe or more specifically the EU is in a mess of trouble. Its banking system is teetering on the brink of collapse. The U.K. has already backed out of the union. Italy, the world’s 8th largest economy, is on the brink of collapse. There has been a significant rise of right-wing, anti-immigrant, leave the EU parties, with some on the brink of winning elections and seizing power. Germany, the EU’s largest and strongest economy, cannot nor is it willing to bail out any who might be in economic dire straits. If the EU along with the euro should collapse the countries with their history of centuries of conflict and war could soon degenerate once again into warring camps.
With the U.S. dollar strengthening as it is, currency wars, which have already been going on for several years, could intensify. Given the current mistrust between countries, the odds of another Plaza Accord is slim to none. What had been at least a slow rising U.S. dollar has turned into a parabolic U.S dollar and that has potential negative consequences for the world and even the U.S.
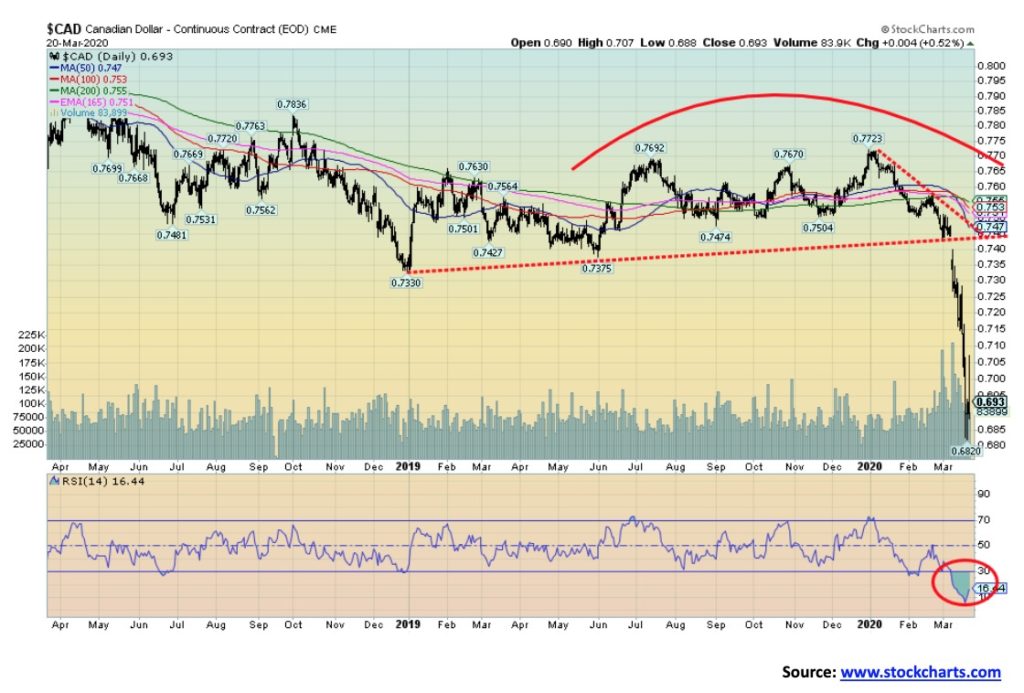
The crash of the Canadian dollar. The Canadian dollar has fallen below 70 for the first time since January 2016. We came within one bip of the 2016 low. Could we challenge the all-time low of 61.86 seen in early 2002? It’s possible. We are a petro dollar and all who have significant exports dependent on oil and gas have seen their currencies crash. Norway is another good example of a crashing petro currency as the Krone has collapsed as well. It’s good for exporters but trade is falling. For everyone else it’s terrible. Canada, who imports significant amounts of food is going to start to see rising food prices. It’s great for tourists from other countries, particularly the U.S., but with borders closed that becomes a non-starter. We are grossly oversold but that is also moot as everything these days seems grossly oversold. We need a spark and for the energy sector that doesn’t seem to be forthcoming. The Canadian dollar could fall lower. Best we can hope for is some stabilization around current levels.
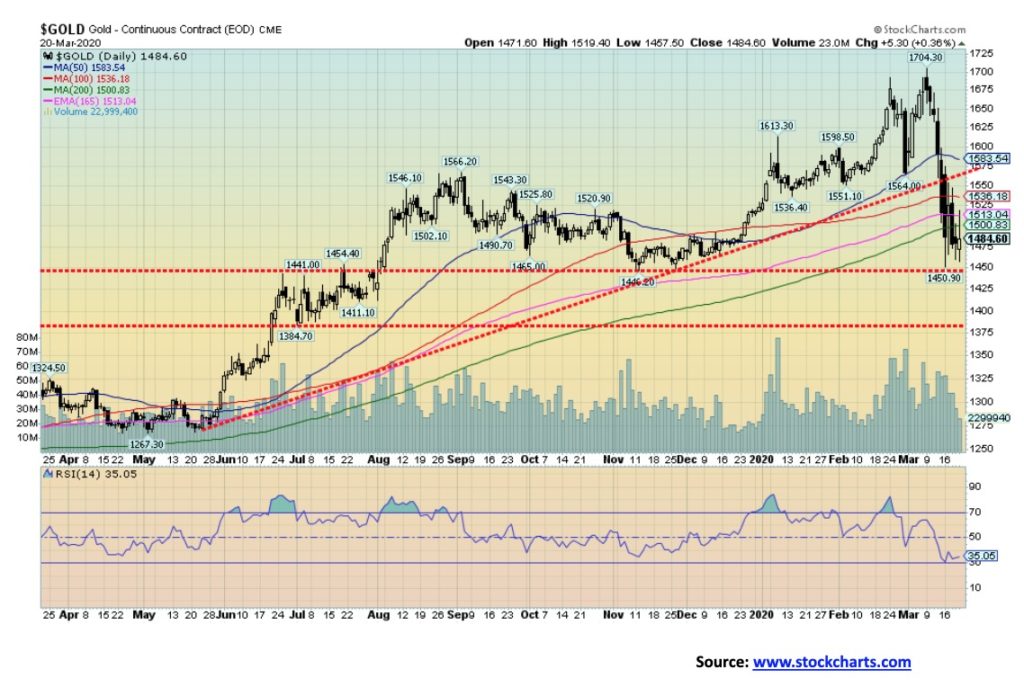
Gold continues to outperform all others save cash and some maturities of treasury notes and bonds. This past week gold fell 2.1% and is now down 2.5% on the year. That certainly beats the 30%+ that most stock indices are down. Gold continues to outperform. Silver was hammered down 14.6%, with platinum down 20.4%. Industrial metals such as copper fell 11.9% but palladium bounced back, gaining 2.1%.
Demand for gold and silver coins is brisk. One-ounce gold coins such as American Gold Eagles are offered at Silver Gold Bull at Cdn$2,427 a premium of about $270 to spot gold in Cdn$. We couldn’t even find any Gold Maple Leafs offered on their website. They do note that deliveries are impacted and some products may be sold out. Not helping matters, the Royal Canadian Mint has shut down for the next two weeks. And we understand the German mint has also shut down. With mints closing, supply will be negatively impacted.
Despite strong demand for product such as coins and bars, the gold market is ruled by paper gold. The bullion banks are notorious short-sellers. Gold fell into a zone of support that ranges from $1,440 to $1,460. A breakdown under $1,440 could send it to the next level at $1,370/$1,380. If that level falls, then we are looking at the May 2018 lows of $1270. We like to be optimistic and note that while silver is making new lows, gold is not. We noted at the top that gold was making new highs but silver was not. Now we have the opposite. However, that doesn’t mean an instant rally. Gold is trying to find some value above $1,450 but we need to take out $1,535 then $1,585 to convince us we are going higher. Otherwise, the trend is turning down. Just not the steep decline like everything else. Gold is doing its job of outperforming. The DJI/Gold ratio is down to 13 and our target of 9/10 remains in focus. However, that could just mean both move lower but gold falls less.
One area as we note later is that the gold stocks have been performing well in the past week. They actually rose on the week while everything else was falling. Could they be portending a rebound?
While gold’s 31-month cycle could be coming into focus, gold’s longer cycle of 7.83 years still seems further away. The last 31-month cycle low was the August 2018 low at $1,167. The next one is due by early 2021 with a range of six months either side. So that now seems early, but if the low came later this year it would fit. Gold’s longer cycle of 7.83 years was last seen in December 2015, making the next one due anywhere from 2021 to 2024. The longer 23.5-year cycle last seen in 2001 is due from 2021 to 2027 so there is a lot of overlap in there. Given the drop, there is a real possibility we are in the throes of making those lows although it still could put the final low out later this year or next.
For that reason, we are not presuming we are going to suddenly rally and see new highs above $1,704, although we see plenty of bullish forecasts out there. We have seen one consistent bearish forecast suggesting we are going to fall below the 2015 low of $1,045. We won’t say it can’t happen, only that we find that surprising. With the sharply rising U.S. dollar, it is possible. But a sudden sharp rebound rally could be seen. If that happens, then we would be sellers into the rally. With everything on sale and a rush for cash, even gold gets sold.
Gold’s long-term uptrend remains intact as the longer-dated chart below shows.
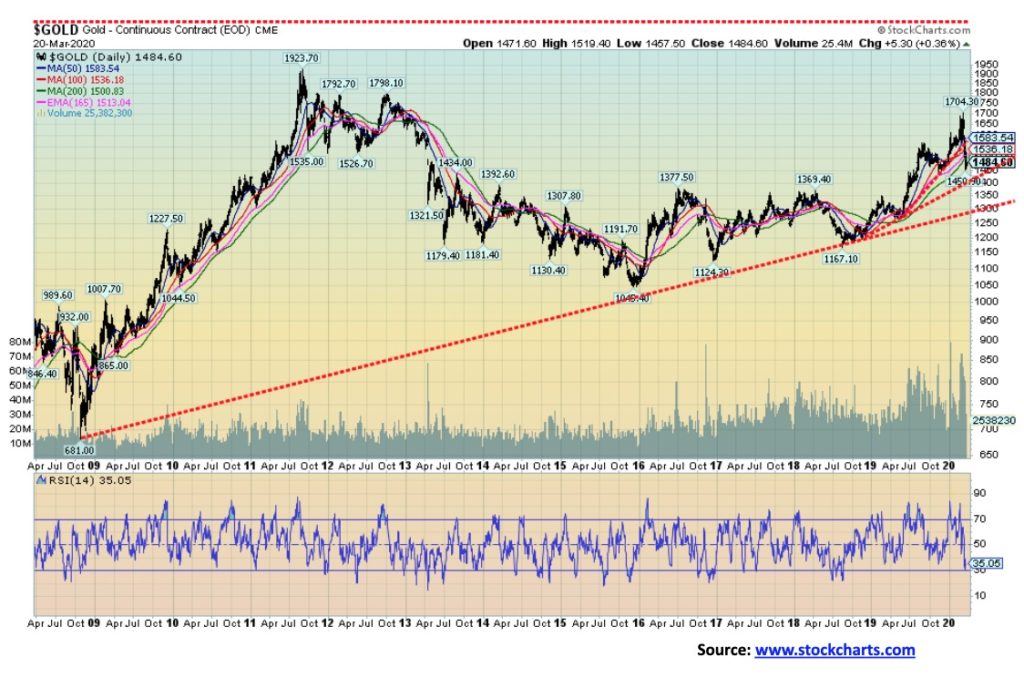
Gold broke its uptrend line from the May 2019 low. But the uptrend line from August 2018 remains intact and it definitely is above the uptrend line from 2008. That’s why we have concern if gold broke under $1,400 and especially under $1,370 first and then $1,280. Under $1,280 then the 2015 low would be in focus. We are not going to say that we can’t break down. But the reality is we need to take out points to the upside. Above $1,585/$1,600 things would look better.
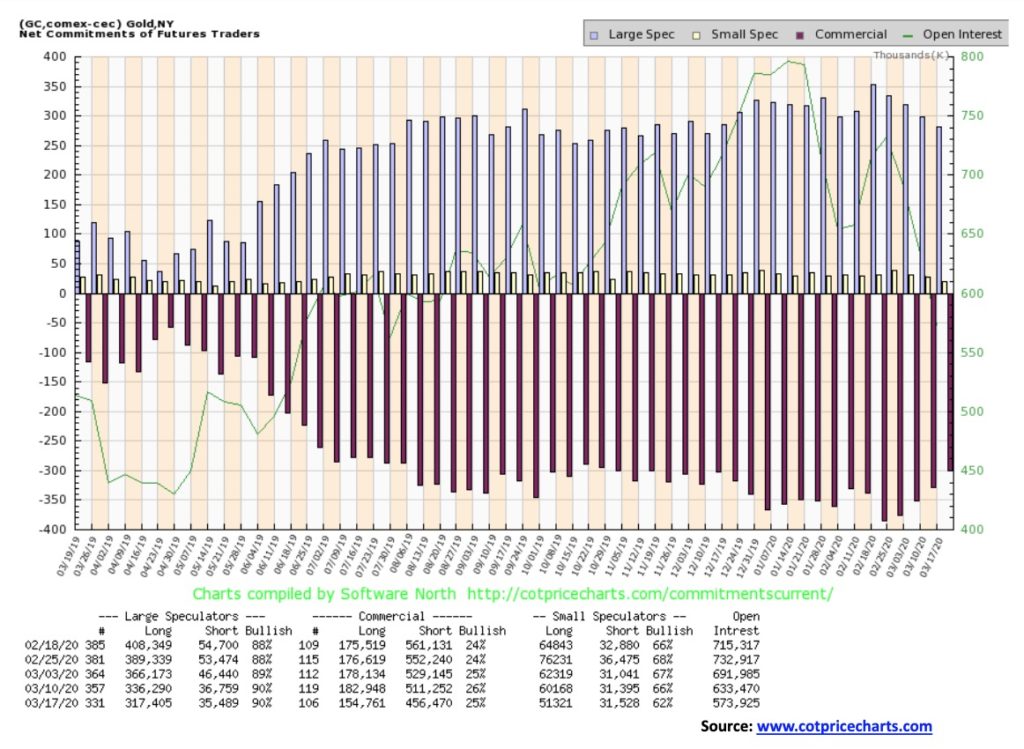
The commercial COT for gold continues to tread water. It actually slipped this past week to 25% from 26%. However, there was a huge drop in short open interest by roughly 54,800 contracts, once again suggesting massive short covering. The long open interest did not cooperate with us and it too fell but a much smaller amount, about 28,100 contracts. Open interest keeps falling which does suggest to us at least that the shorts are covering and the next move should be up. But we wish they’d take on new longs to convince us that the trend could turn up.
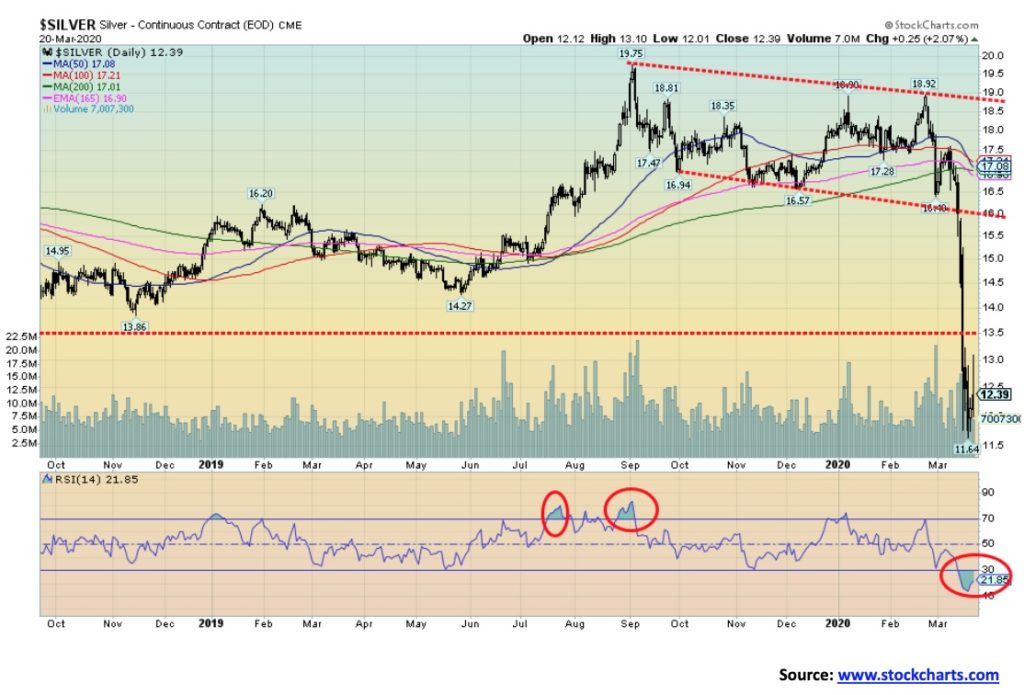
Silver has crashed along with the stock market. This past week silver prices fell to their lowest since the 2008 financial crisis as they plunged 14.6% on the week and are down 30.9% on the year. Things are not quite as bad in Canadian dollars as the plunge this week was only 11.5% and is down 15.7% on the year. Still, in both cases, silver made 52-week lows. With a low of $11.64, this past week silver was barely above the 2008 low of $8.40. In order to sound somewhat encouraging, we note that silver is making new lows but gold is not. Gold is not even close. A divergence and hopefully a positive one. It was like that at the top when gold was making new highs at $1,704 but silver was well below its high of this year of $19.75 and even further below its 2016 high of $21.23. Gold took out both those levels easily.
Technically silver is oversold enough to get at least a bounce. But, as they say, being oversold is merely a state and today’s oversold can get even more oversold. A rebound may be in the offing as silver outperformed gold on Friday, actually gaining 2%. A rebound to $13.50 could be in the offing but the lows of 2016 and 2018 at $13.62 and $13.86 could act as resistance. Regaining $14 would be a positive development. As to below us, well there is little in the way of a further sharp decline to the 2008 low of $8.40.
It seems too early to be silver’s 7-year low. Silver has exhibited some strong tendency to make lows roughly every 7 years. Since the double bottom low of 1991–1993 silver saw significant lows in 2001, 2008, and 2015. So, in theory the next one isn’t due until 2022. But could it be coming in early? Silver’s longer cycle is roughly 18.5 years and there is an argument that the 2008 low was one such cycle low. So, in that case the next one isn’t due until 2026. But again, it could come in early although 2020 is awfully early. Either that or silver is pointed down for the next few years and will have trouble recovering. Our best hope right now is a rebound rally, but unless we can overhaul above $14, silver will most likely fail and fall back once again and potentially test that 2008 low of $8.40.
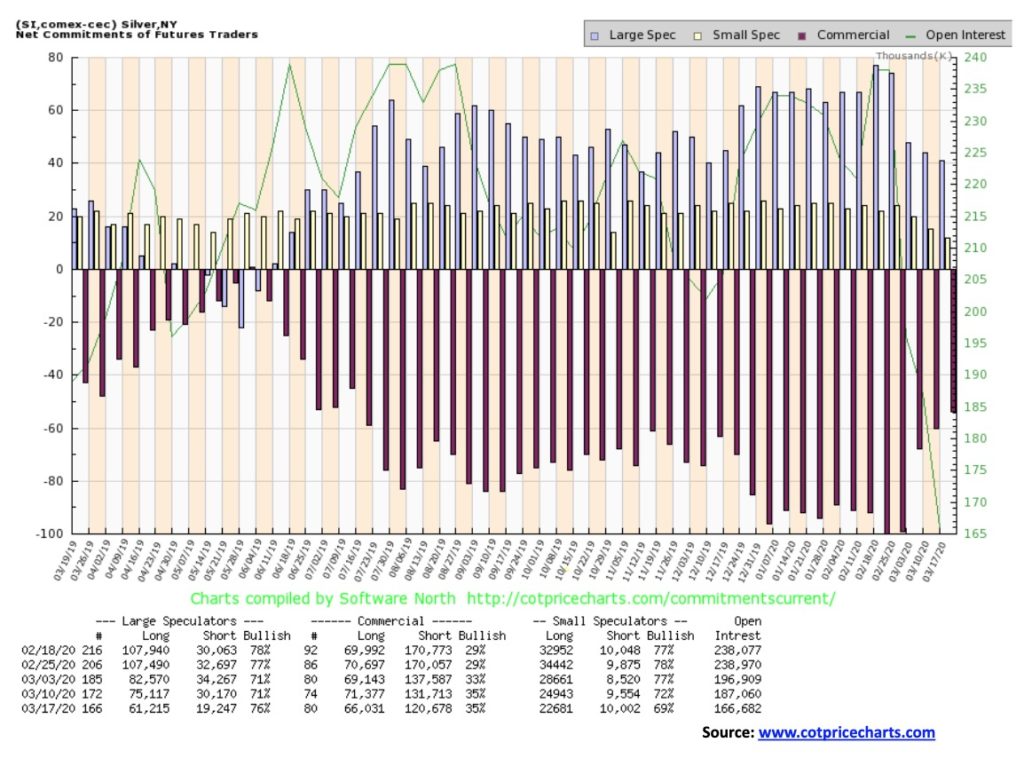
The commercial COT for silver was flat this week at 35%. However, the shorts continue to cover as short open interest fell by roughly 11,000 contracts. Long open interest also fell but by only about 5,300 contracts. As with gold, overall open interest fell. The silver COT like the gold COT tells us that the shorts are definitely covering on these plunges but the longs are not being established, not yet anyway.
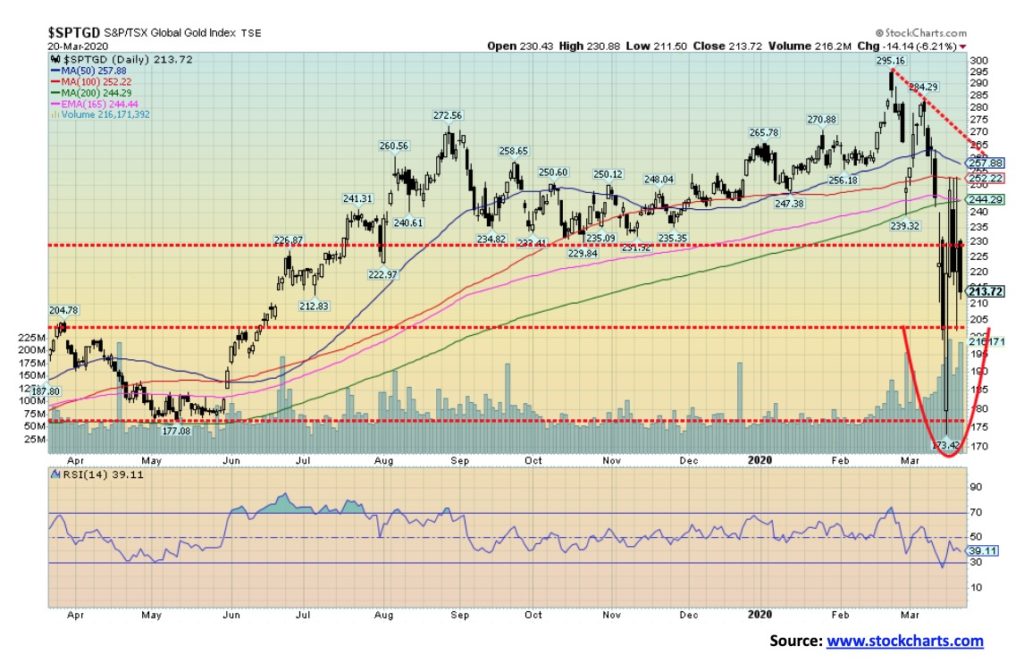
The gold stocks have oddly become the rock stars. When everything else is collapsing and hitting fresh 52-week lows, it was a shock to see the gold stocks rise phoenix-like this past week. The TSX Gold Index (TGD) was the top performer of the week, up 6.2%. On the year, however, it is still down 18.2%. The Gold Bugs Index (HUI) hasn’t fared as well because of large multi-national, more integrated firms in the index. The HUI did gain 1.6% but remains down 31.3% on the year.
Could the gold stocks be portending a rise in gold prices? Gold fell this week while silver was acting like the stock market—plummeting. But on March 16 the TGD put in a massive reversal up day with a gain of 8.5% on the day but, more tellingly, it was the opening plunge to new lows only to reverse and close up sharply higher that was really impressive. The TGD barely made new 52-week lows before reversing. The HUI also barely made fresh 52-week lows before reversing to the upside. Now the TGD is consolidating with some sharp up and down days. That’s the good news. The bad news is it is all below the 200-day MA, signaling that, at least for the moment, the bear remains. A breakdown under 200 would set up a test of the lows. The reality is we need to take out 265 on the upside to convince us that this is over. The high on the week was 253 so that level needs to be taken out as well. The HUI continues to look weaker than the TGD.
So, while we are encouraged by the sharp rebound this past week we are not out of the woods and the risk remains to the downside. But as long as the low of 173 holds there is some hope of building value here before moving higher.
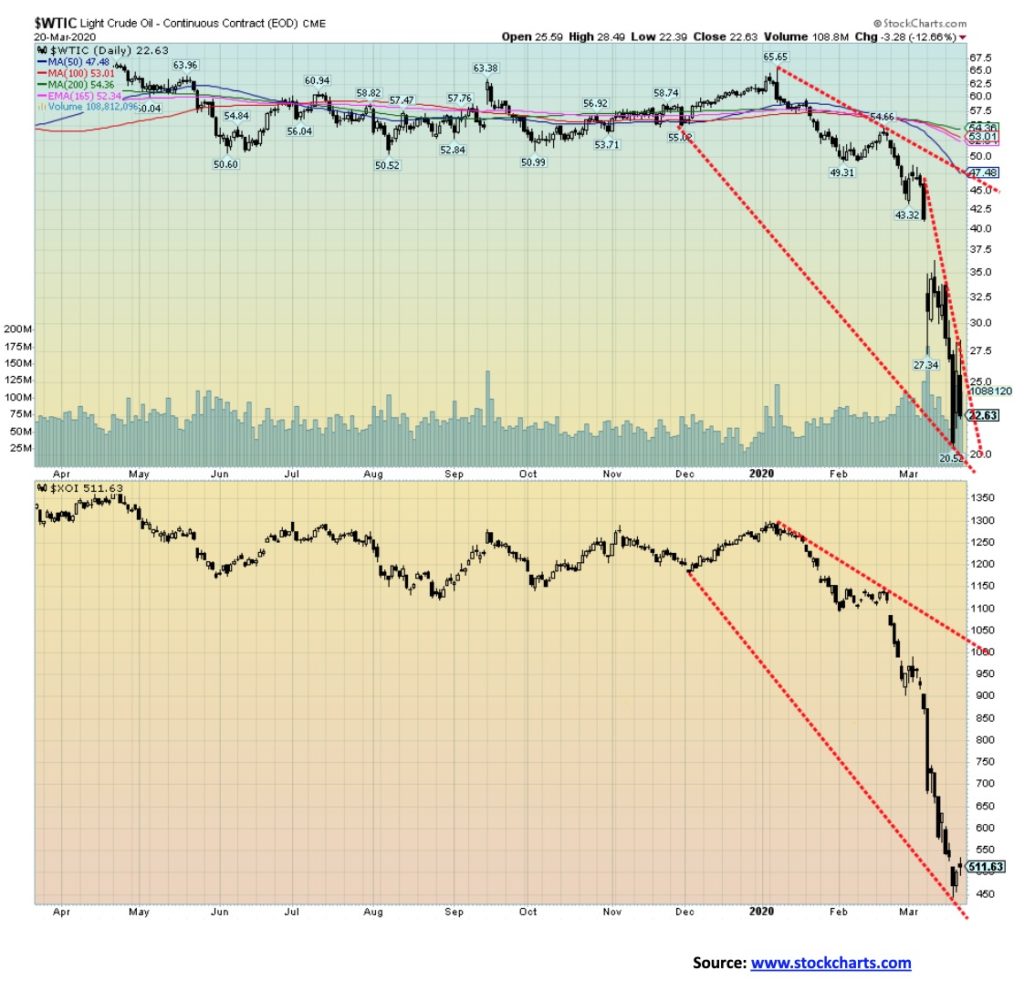
The oil and gas industry has become a disaster zone. As one pundit declared, it’s Operation Desert Storm, Hurricane Katrina, Enron, 9/11, and Lehman Brothers all rolled into one. A pessimistic scenario from Citigroup says WTI oil could fall to $5. Unless there are shale shut-ins, one analyst thinks it could even become negative. Unless there is a way to stop the war between Russia and Saudi Arabia. But this is a death fight. The U.S. is trying to intervene, but unless the U.S. is prepared to end Russian sanctions, there is no reason why Russia should co-operate. That leaves the U.S. facing potentially huge production cuts devastating their oil industry. Alberta will just sink and is currently cup in hand asking for the Federal Government to bail them out.
It was a wild week for oil prices. Both oil and gas plunged to multi-year lows with WTI oil down 28.7% on the week and 62.9% on the year. Natural gas (NG) fell 10.4% and is down 23.5% on the year. The energy stocks have been massacred. The Arca Oil & Gas Index (XOI) fell 19.4% on the week and is down 59.7% on the year. The TSX Energy Index (TEN) is even worse, off 30.0% on the week and 69.1% on the year. These are depression numbers. Many companies will never recover and will just cease to exist. At the end of the day we may just be left with the big integrated firms like Exxon and little else. Producers, drillers, and suppliers will just disappear.
On March 18 WTI oil plunged $6.12 or 22.7% as fear gripped the market. On March 19 WTI oil surged $5.08 or 24.4% a record up day as the market was encouraged by a possible trillion-dollar package from Washington. On March 20 that collapsed as WTI oil fell $3.28 or 12.7% and closed the week at multi-year lows.
There is an estimated debt of $32 billion out there for oil services companies. That’s just in the U.S. Much of it comes due this year and up to 2024. Our best guess is it will all default. Plants are closing, drilling is stopping, refining is halting, and if the price collapse isn’t getting them the coronavirus is. CAPEX cuts total $31 billion. The U.S. shale industry lost $2.1 billion last year. That number may seem fanciful now.
Technically we can’t tell where the bottom is. Arguing that we are at a support zone could prove to be just day-dreaming. There is little we can say except to say avoid, stay away. Oh, there will be little rallies, but we see little here that is encouraging.
—
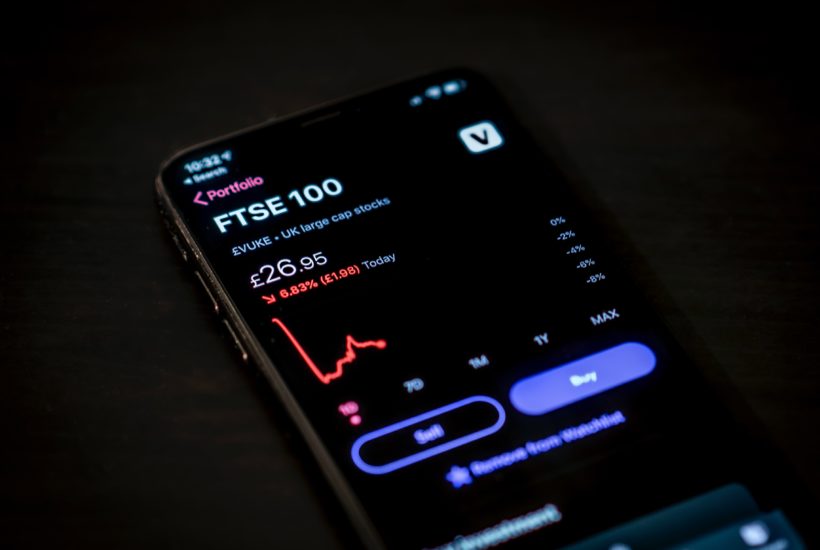
(Featured image by Jamie Street on Unsplash)
DISCLAIMER: This article was written by a third party contributor and does not reflect the opinion of Born2Invest, its management, staff or its associates. Please review our disclaimer for more information.
This article may include forward-looking statements. These forward-looking statements generally are identified by the words “believe,” “project,” “estimate,” “become,” “plan,” “will,” and similar expressions. These forward-looking statements involve known and unknown risks as well as uncertainties, including those discussed in the following cautionary statements and elsewhere in this article and on this site. Although the Company may believe that its expectations are based on reasonable assumptions, the actual results that the Company may achieve may differ materially from any forward-looking statements, which reflect the opinions of the management of the Company only as of the date hereof. Additionally, please make sure to read these important disclosures.


Bitcoin Stalls Near $60K as Strategy Moves, ETFs Outflow, and EU MiCA Rules Take Effect
Bitcoin hovers near $60,000 with ETF outflows, while Strategy boosts reserves, sells BTC, and raises dividends to reassure investors. Ethereum...


Cannabis Dominates Global Drug Use: Trends, Risks, and Shifting Markets
Cannabis remains the world’s most widely used illicit drug, with 256 million users in 2024, surpassing all others combined. Growth...


Italy Approves First Hydrogen-Powered Train for National Rail Network
ANSFISA has approved Italy’s first hydrogen-powered train, the Alstom HMU214, for use on the Brescia–Iseo–Edolo line. Capable of 140 km/h,...


Cotton Market Weakness Persists Despite Brief Rebound
Cotton prices fell to new lows last week before a modest rebound. USDA data shows crop conditions remain worse than...


Eli Lilly Hits $1 Trillion Valuation Amid Strong Bullish Momentum
Eli Lilly stock hit a record high, surpassing $1 trillion market value after strong product demand. Shares surged over 7%,...
 |
|
 |  |
 |
|
-

 Crowdfunding2 weeks ago
Temotiva Launches Crowdfunding Campaign to Advance Preventive Mental Health
-
 Crypto7 days ago
Bitcoin Holds Steady as Microtransactions Surge and ETF Inflows Continue
-

 Biotech2 weeks ago
AseBio 2025 Report Highlights Growth and Future Potential of Spanish Biotechnology
-
 Cannabis5 days ago
Tilray (TLRY) Falls as Bearish Momentum Persists Despite Marketing Push