Featured
The three stages of bull & bear markets
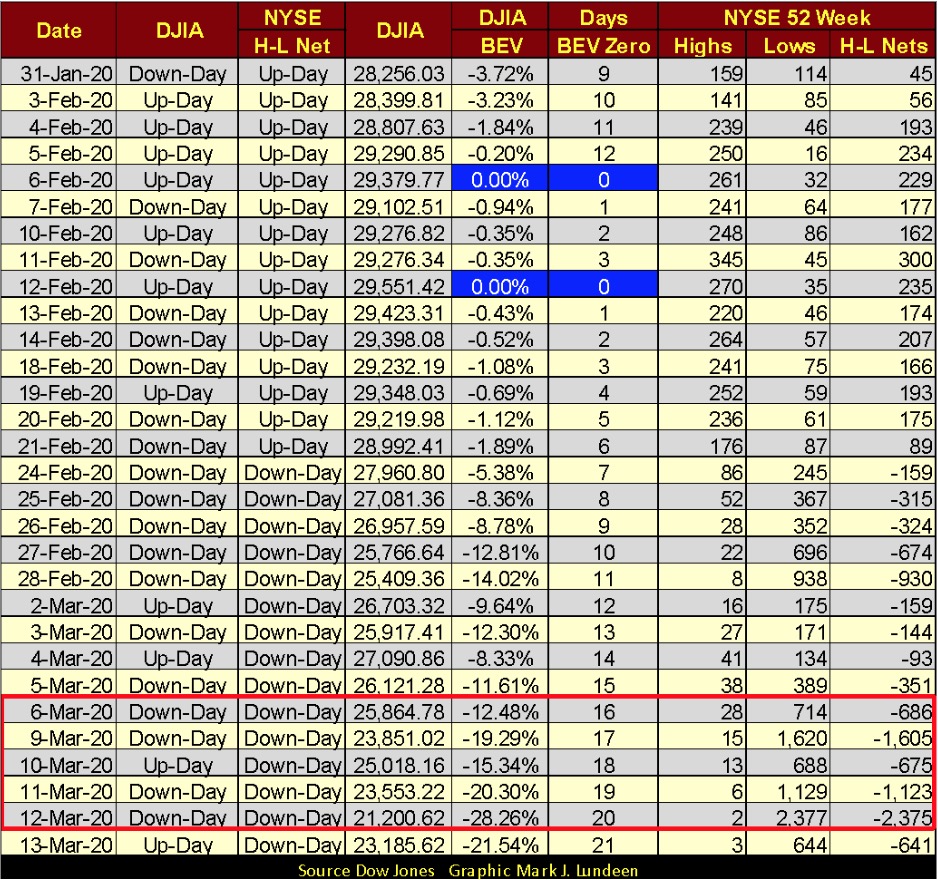
Every day this week the Dow Jones saw a 2% day, a day of extreme-market volatility and almost broke below its BEV -30% line on Thursday. Thursday to Friday shows last week’s market volatility as it is rarely seen in the stock market. This past week Mr Bear also took an interest in the bond market, which up to this week was a direct beneficiary of the deflating stock market.

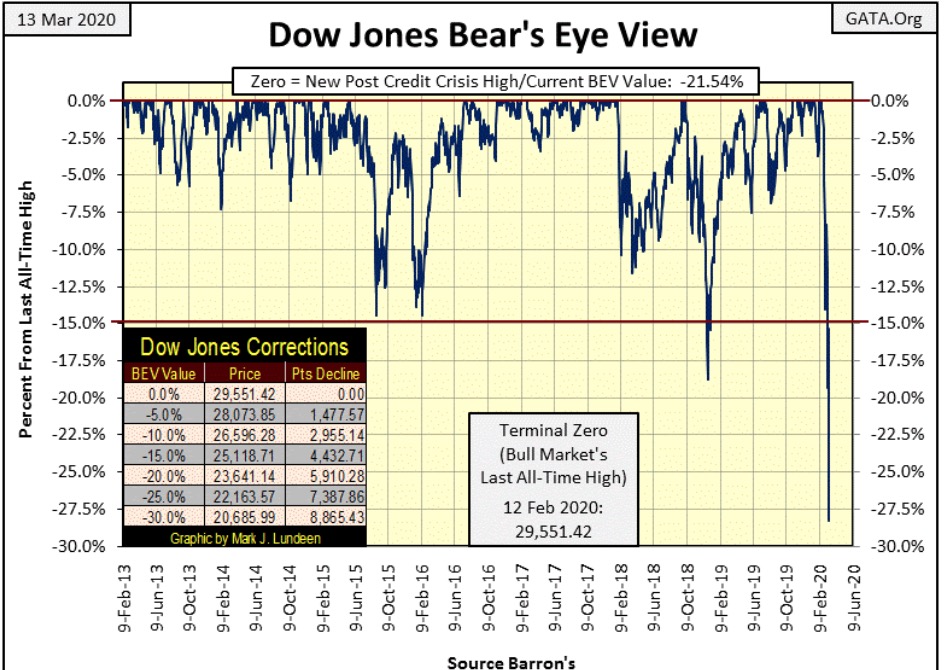
What a wild week; I’m overwhelmed! In my articles, I usually find a narrative theme with which to insert my graphics in. But this week the only theme that comes to mind is what an awful week it was – just awful. Come to think of it, that’s actually a pretty good theme to use for a week like this. So all hands standby for heavy rolls to both the port and starboard, as here’s the Bear’s Eye View of the Dow Jones.
Every day this week the Dow Jones saw a 2% day, a day of extreme-market volatility and almost broke below its BEV -30% line on Thursday. It’s hard to believe, but the Dow Jones saw its last BEV Zero (all-time high) just a month ago (twenty-two NYSE trading sessions ago) on February 12th. Since then the bottom has fallen out of the stock market as painfully evident in the BEV chart below.
Starting next week, I’m recalibrating my Dow Jones Corrections based on something more than just a 30% decline. Thursday saw the Dow Jones’ BEV value close at -28.26%.
Looking at the daily BEV values of the major market indexes I follow below, Thursday saw the market lows of the week, with the Dow Jones (#10) seeing a -9.99% drop from Wednesday’s close. That’s a Dow Jones 2% day and then some! Sure, on Friday the Dow Jones (and the other indexes below) made good most of their losses from Thursday, but look at how the Dow Jones did it; by advancing +9.36% from Thursday’s close, another one of those BIG-BEAR Dow Jones 2% and then some days.
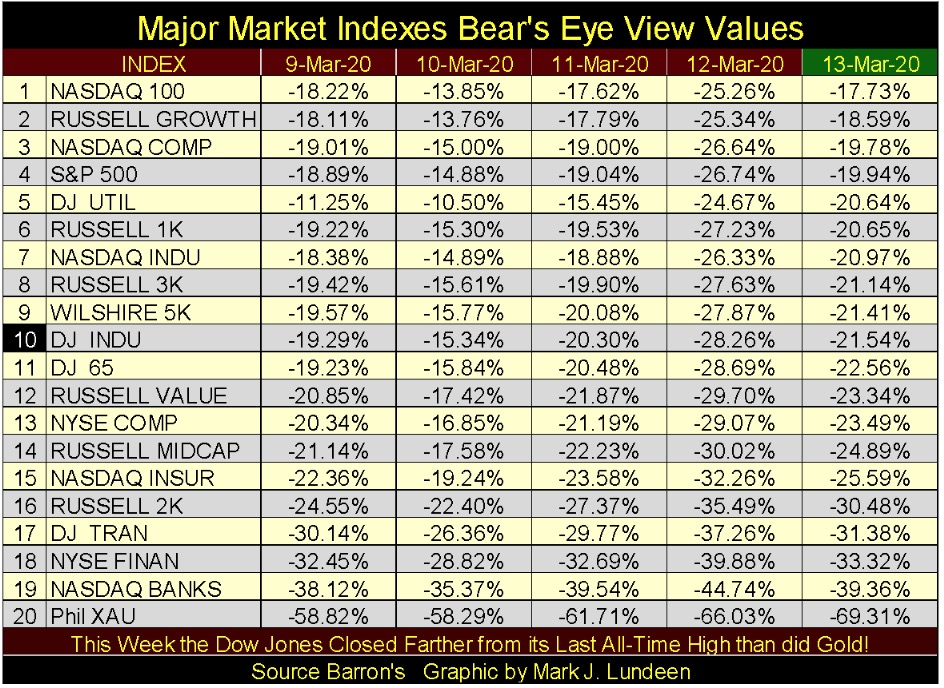
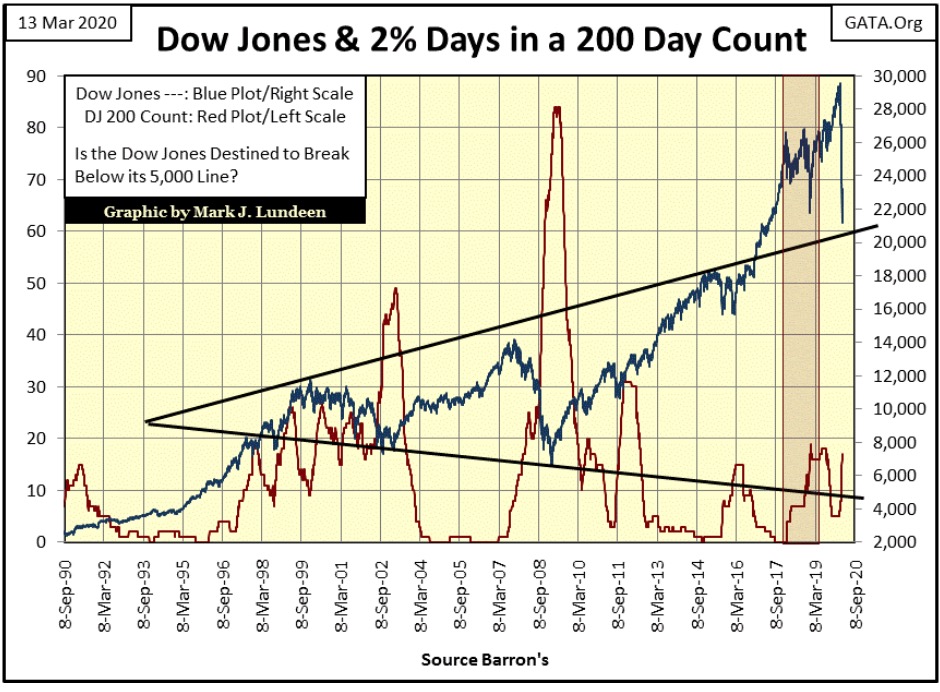
Don’t kid yourself. In a bear market, extreme market volatility; Dow Jones 2% days whether they move down by -9.99% one day or up +9.36% the next are BIG-BEAR MARKET EVENTS. This is especially so when these extreme days begin piling up in the Dow Jones’ 200 count, which moved up by five to seventeen at this week’s close.
Don’t try to compute Dow Jones 2% day percentages from the above BEV values, as they are based on their last all-time highs, while Dow Jones 2% days are percentage moves from one day’s closing to the next. But-as-that-may-be; looking at the BEV values above from Wednesday to Thursday and then from Thursday to Friday shows last week’s market volatility as it is rarely seen in the stock market.
Moving on to Mr Bear’s report card below, apparently he’s entered a psychotic rage since late February. Every day this week saw the Dow Jones move more than 2% from its close of the day before – a lot more than 2%. And this week saw four NYSE 70% A-D Days; days of extreme market breadth – Wow! On Monday and Thursday, the A-D ratio reached 95%, or on Monday only 70 issues advanced while 2973 declined and on Thursday only 67 advanced while 2998 declined.
Extremes such as these, A-D Ratios of 95%, are seen in maybe slightly more than a handful of daily closings in a century. The market has gone for decades without any, and here we see two 95% A-D Ratio days in one week? These extremes in daily declines to advances speak to just how overvalued the stock market was and continues to be.
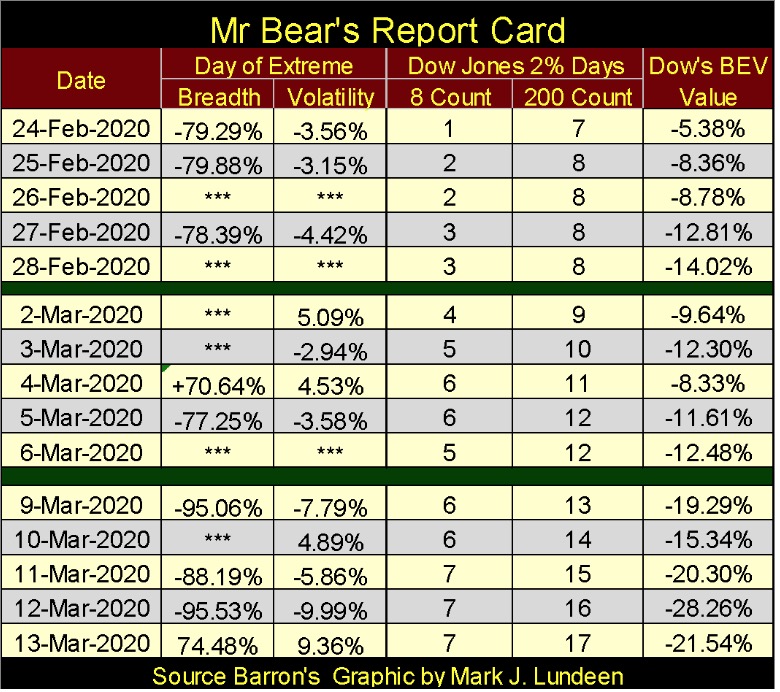
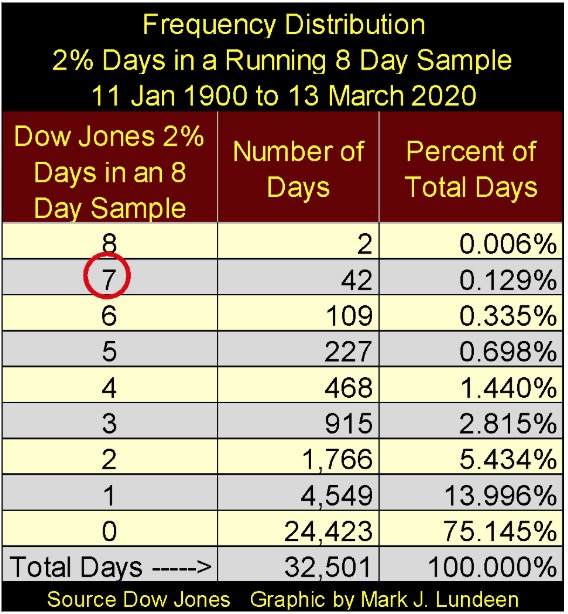
The 8 & 200 counts for the Dow Jones increased this week (below). If this really is a bear market, and it is, we’ll see the Dow Jones’ 200 count increase to far above 20 as 2020 progresses in the chart below. And while the 8 count, is based on an eight-day sample, will never rise up above 8 in the chart below, during a prolonged bear market it can refuse to decline back down to a zero value for a prolonged period of time as the Dow Jones continues seeing maybe only one or two 2% days every week.
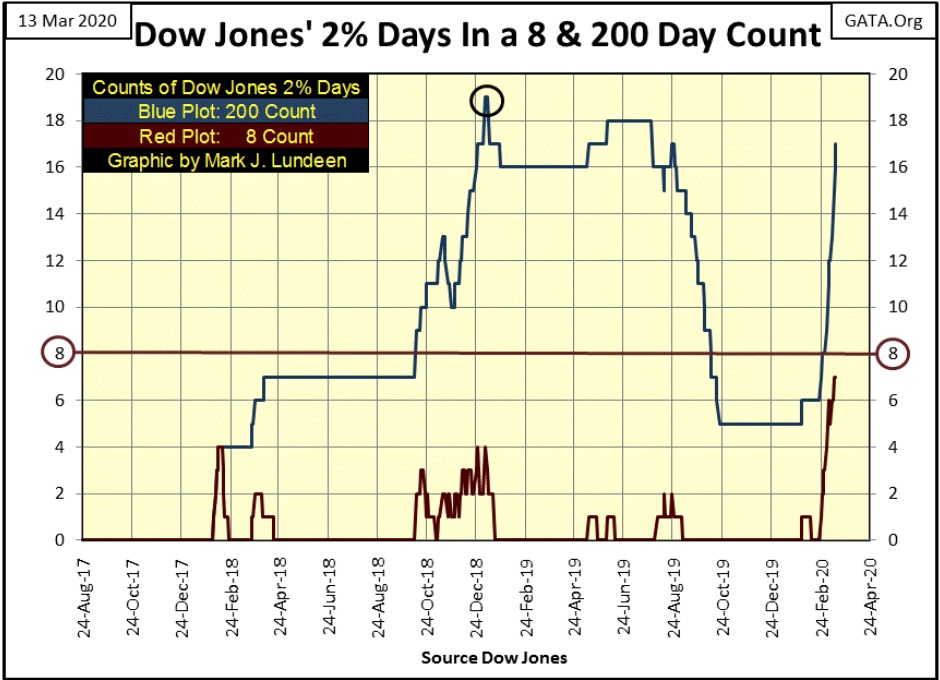
This week the Dow Jones’ 8 count closed at a 7 for three days. To prove what an extreme week we’ve just seen, look at the Freq Distribution Table for the Dow Jones’ 8 count below. Since 1900 (120 years) the Dow Jones has seen its 8 count rise up to a 7 in only forty-two daily closings, and three of these were from last week.
As expected, with the rising of the Dow Jones’ 200 count below, the Dow Jones itself has deflated. If this really is a Big-Bear Market we’ll see these trends continue until this bear market comes to full term.
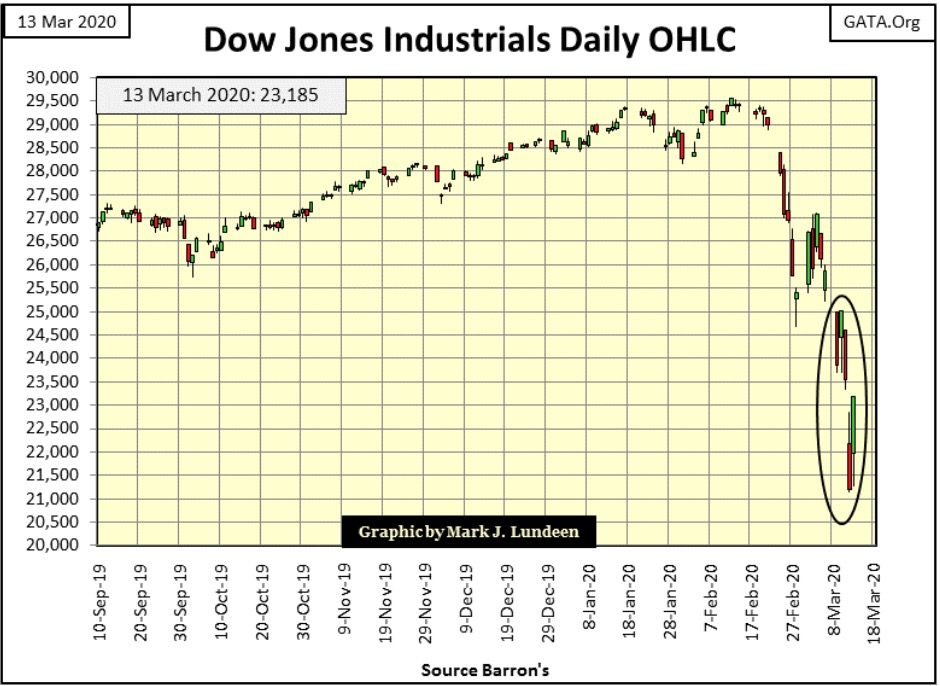
The British have some colorful phrases in their daily use of English we Americans have never picked up on. One of them is most appropriate when describing the Dow Jones in daily bars below – Bloody Hell!
When was the last time the Dow Jones traded around 21,000? Three years ago in March of 2017. It took the “policymakers” three years to inflate the Dow Jones from 21,000 to its last all-time high of 29,551 of February 12th. And Mr Bear claws all that back in only twenty-two NYSE trading sessions – ya, Bloody Hell!
What makes this chart so remarkable is comparing the daily volatility seen in the bull market, before February 21st, with that since the bear market began on February 24th. It’s as if someone turned on a switch and everything changed.
Who knows; maybe that is actually what happened below. There are many in positions of power in the government, media and finance who are no lovers of President Trump. 2020 being a presidential election year, a big-bear market might just be what these power brokers and “policymakers” would like to see.
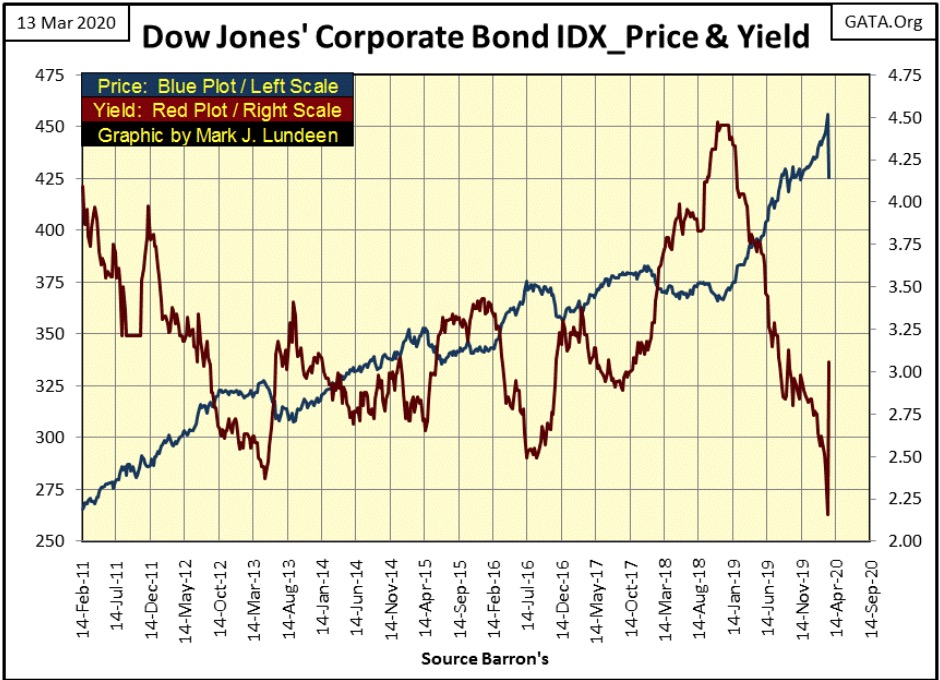
This past week Mr Bear also took an interest in the bond market, which up to this week was a direct beneficiary of the deflating stock market. But this week all that changed as corporate-bond prices (Blue Plot) and yields (Red Plot) went from bull market to bear. The Treasury-bond market also took a bearish turn this week.
One week does not establish a market trend, so maybe next week the bond market will once again begin inflating. But if the top is in on the bond market, and it too begins deflating with the stock market, all hell is going to break loose as the big Wall-Street banks are counter-parties to all this in the OTC derivative market.
Currently, this isn’t a factor in the financial markets as these derivatives are out of the money. But should bond yields continue to rise, the big banks one day are going to be presented with a bill from their counter-parties in the bond market that they can’t pay.
And as during the 2000 to 2002 High-Tech, and 2007-09 Sub-Prime Mortgage bear markets, we’ll have yet one more of those 21st Century Bloody-Hell Moments in the financial markets, courtesy of Wall Street’s best and brightest.
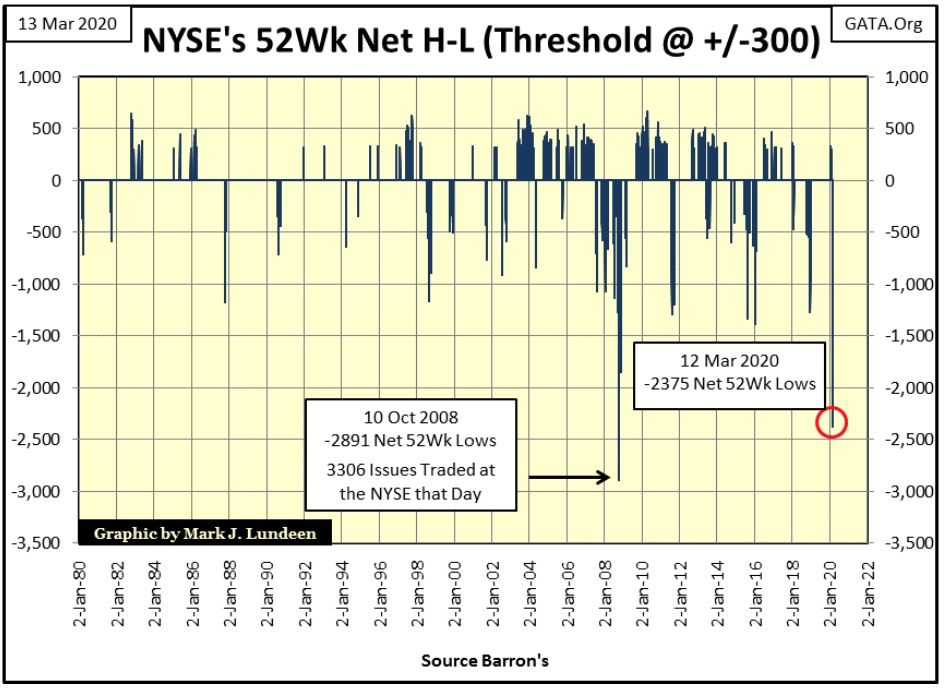
Looking at the NYSE 52Wk High & Low data in the table below, we see the H-L Nets (far right column below) went negative beginning February 24st, with the growth in 52Wk Lows expanding to 2377 on Thursday.
This is an extreme not seen since October 2008 (chart below). But there is a big difference between October 2008 and March 2020; the market topped in October 2007, and that extreme in NYSE 52 Wk Lows didn’t happen until one year later. This week’s extreme in NYSE 52Wk Lows happened only a month after the bull market top in February 12th.
What does this mean? I don’t know but I doubt we’ll like it when we find out.
All of the above extremes are market events seldom seen in the stock market. Seeing so many of them happen in a single week is yet another extreme market event that will be hard for even Mr Bear to reproduce.
So, believe it or not, I’m expecting a reprieve from Mr Bear sometime in the weeks to come. That’s not to say there won’t be bad days in the next few weeks, I suspect there will be. But we won’t see the historic extremes, or as many of them as we saw this week. In fact, by summer I wouldn’t be surprised should the stock market see a nice advance from its current lows.
Why would I think this is possible? Take a chart of any bear market that has taken a few years to play out, there are always tradeable bounces in it before the bear market deflates to its ultimate bottom. Bulls are quick to jump on to these corrections within a bear market, but then hang on long after they are over.
So, I’d be very warry of any advance from here, as it may prove to be what was once called a Dead-Cat Bounce. For nimble investors; a Dead-Cat Bounce is a tradable correction in a big-bear market, a trade that one gets into knowing it will not last long. But for most retail investors a Dead-Cat Bounce is Mr Bear’s siren song to lure them into his meat grinder one more time, as no bear market ever ends with a Dead-Cat Bounce. Big-bear markets end in despair and hopelessness, which many current bulls will discover at considerable cost to themselves.
One of the most influential market commentators of the 20th century was Richard Russell of The Dow Theory Letter. A brilliant-market insight of Mr. Russell’s was on the psychological make up of bull and bear markets. Mr. Russell observed how both bull and bear market evolved in three stages as the stock market traveled from one psychological extreme to the other; from despair to euphoria in bull markets and from euphoria to despair in bear markets.
The following are from my recollection of Mr. Russell’s comments on the evolution of bull and bear markets I read years ago. I’ve also taken the liberty of adding some items of my own not mentioned by Mr. Russell, but I’m sure he would approve.
* Bull Markets *
Stage #1 of a new bull market begins at the absolute bottom of the old bear market, where market sentiment at the bottom of the bear market is bleak, with no hope of things ever turning around. At this point where things absolutely can’t get any worse, they begin to get better; and a new bull market is born, though most former-market participants, battered and bruised by Mr Bear are incapable of believing it.
In stage #1 of a bull market, market valuations are fantastic, though few have the courage (or the means) to take advantage of any bargain Mr Bear has left behind for the bulls. During the previous bear market companies with weak balance sheets or dubious-business plans have been ruthlessly eliminated, leaving the list of survivors from Mr Bear’s program of market hygiene a list of winners.
In stage #1 of a bull market, should an investor decide to buy, they’ll do so on their own. No one is going to hold their hand to reassure them of the wisdom of buying at the bottom of a bear market, as psychologically most people remain mired in the former bear market. It’s well recognized by most survivors of the bear market; the only reason the market would advance a dollar is because it’s ultimately going to decline by two. That may have been true during the bear market, but not anymore.
To most of the world, still mired in bear-market psychology, buying stocks is a mugs’ game. But in stage #1 of a bull market dividend yields are very competitive, if not superior to what banks and the bond market are offering. So, early bulls are well paid to wait, maybe for years until market valuations once again begin to inflate.
Stage #2 of a bull market comes at the point where intrepid investors slowly return to the market, a trickle at first but increases steadily as market valuations increase and dividend yields decline. Corrections in the early stages of a bull market can be sharp, inspiring fear that Mr Bear is once again at the door. But he’s not. Stage #2 is the longest period of a bull market as it advances with little excitement or broad-public participation.
Stage #3 of a bull market is exciting with broad-public participation as the stock market feels like a safe place to place for investors to hold their hard earned money in. Investor returns in inflationary-capital gains far exceed what a bank or a bond has to offer them, so the stock market really is the place to be.
However, market valuations in stage #3 ultimately increase to the point of being asinine as dividend yields decline far from where they once were. But few care about dividends as everyone now realizes market valuations doubles every few years and all market declines are excellent buying opportunities. This continues until things can’t get any better, and it is at this point that a new bear market is born.
* Bear Markets *
Stage #1 of a bear market begins looking and feeling exactly like the stage #3 of the previous bull market – except it ain’t! But most investors are slow in realizing the change in the market place; where market declines were once buying opportunities, the market has now evolved to where market advances become opportunities to sell. Though in stage #1 most investors fail to use these selling opportunities to lock in profits and they will suffer for it.
Stage #2 of a bear market sees diminishing public participation in the stock market as market valuations deflate and dividend yields rise. One by one investors finally accept their losses as they exit, promising to never again invest in the stock market as they leave. Though there are still some who believe the bottom is in, and have faith the bull market and good times will once again return. It will, but these stubborn bulls are wrong in their timing and severity of the market decline and may not live long enough to see the coming bull market.
Stage #3 in a bear market is noted by the total collapse in investor confidence, and despair that the bear market will never come to an end. The stock market becomes an object of ridicule as investor sentiment becomes despondent as dividend yields rise to something over 6%. And so things go, until once again a day comes when a bull market is born on Wall Street, not that anyone notices it.
This sounds so easy – but it’s not.
Let’s take a look at gold, a market I consider to be in its stage #2 of a massive bull market that began in early 2001. Is that so? All I can say to justify that is to direct your attention to gold’s BEV chart below.
Gold, scorned and scuffed at by most main-stream market commentators, is still behaving very bullishly in its BEV chart below. Unlike the Dow Jones, which in its BEV chart is deflating from its last all-time high, gold’s market action is still inflating from its market low of December 2015. That is a huge difference!
And as is typical of any bull market in its stage #2, few see gold’s current market decline as a buying opportunity. Well, if the current decline isn’t a buying opportunity then what is it? Are you afraid gold will once again break below its lows of December 2015 ($1053)? Or maybe even its lows of the 1980-2001 bear market ($253)?
As I see it, in a world pregnant with massive counter-party defaults pending in the debt and derivatives market, potentially in the hundreds-of-trillions of dollars of defaults, precious metals being assets with no counter party risks is the place to be. I believe that is also the opinion of the smart-money crowd in 2020. So yes; the current decline in the price of gold (and silver) is an opportunity to purchase the old monetary metals at lower prices than they were at a few weeks ago.
When the pending tsunami of counter-party defaults strikes is something I don’t exactly know. It may be unknown to the public until one morning we all hear about it together in the news; a new and unexpected debt crisis in an economic area few people today would suspect; for instance in the American shale-oil industry.
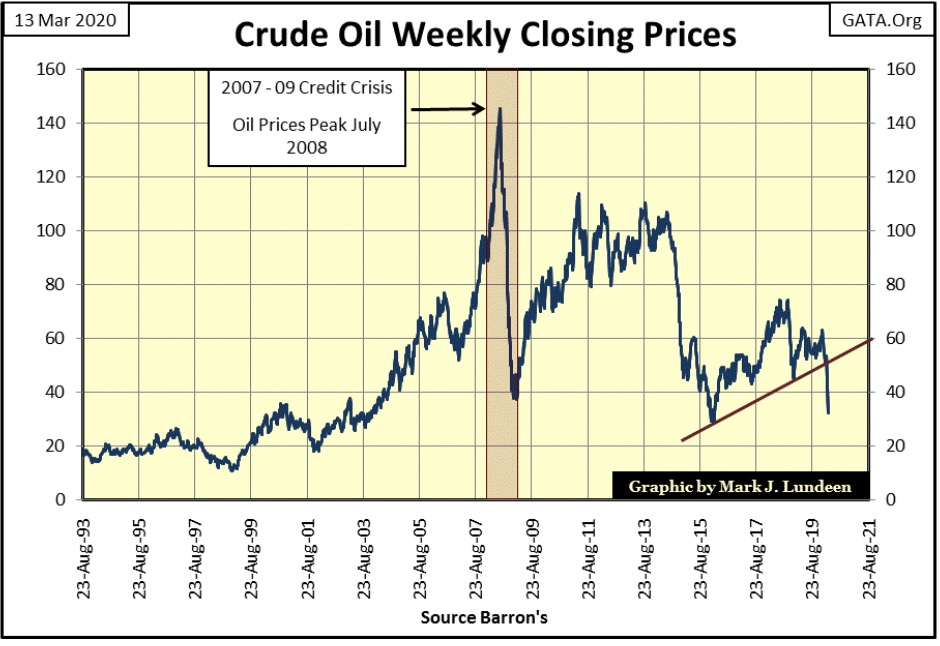
Shale oil is good oil, except it must be mechanically freed from its host rock via a hydraulic process called fracking, and that costs money. Oil Fracking companies are heavily indebted, which is fine as long as they can pay their bills. But with crude oil closing the week at $31.50 can these companies continue servicing their debts should these low oil prices continue for a few months or even a year or so?
I’m not a financial analysis, so don’t ask me. But I do follow the markets and when one sees as many markets extremes as we did this week, one has to suspect that basic assumptions made when oil-fracking companies and hedge funds took on their debt obligations will soon be proven to be incorrect.
Crashing oil prices and rising interest rates and bond yields could drive companies and hedge funds to ruin and see them default on their massive debts in the process. And if I wrong about the oil-fracking companies; in a big-bear market this will be proven to be true somewhere else in the economy. That’s what Mr Bear does; he stress tests basic assumptions made in economic models used by the financial system during the previous bull market, and many will fail.
It’s mercenary to think like this; but what is bad for them is good for gold, silver and the precious-metals mining companies. So far gold has deflated with the stock market. Let’s see what gold and silver do when bond yields begin rising.
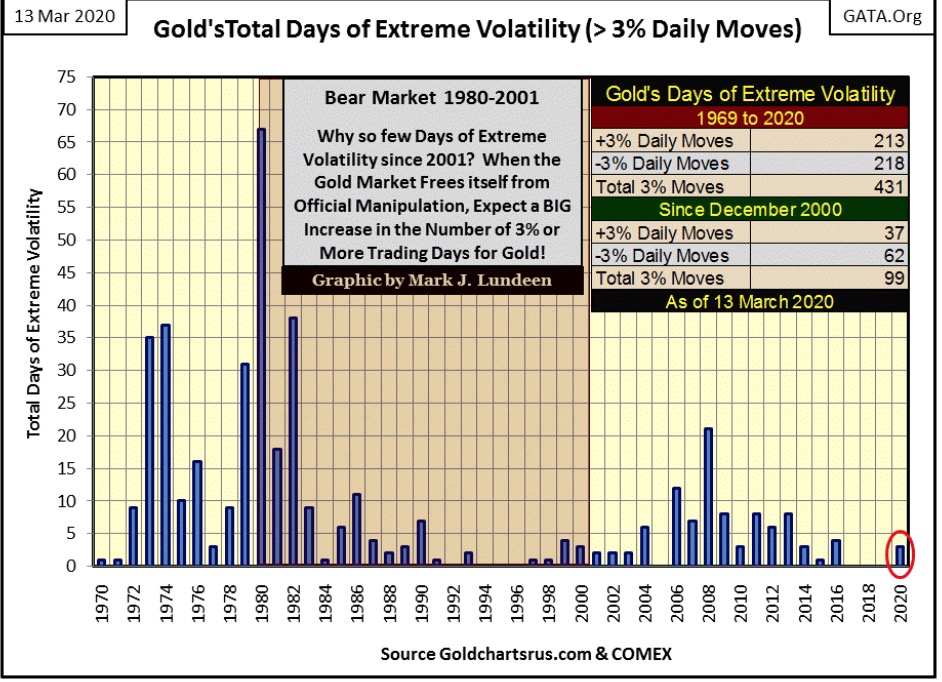
We see a change in the gold market below. Not since November 2016 has gold seen a day of extreme volatility, which for gold is a 3% day. Now in the first three months of 2020 we’ve seen three. Yes, so far they have all been negative 3% days, with two of them this past week; ouch!
But in the coming weeks and months, I don’t think it will matter as bull markets for gold and silver thrive on rising volatility. I’m expecting some big +3% days for gold and +5% days for silver coming our way as 2020 progresses towards 2021.
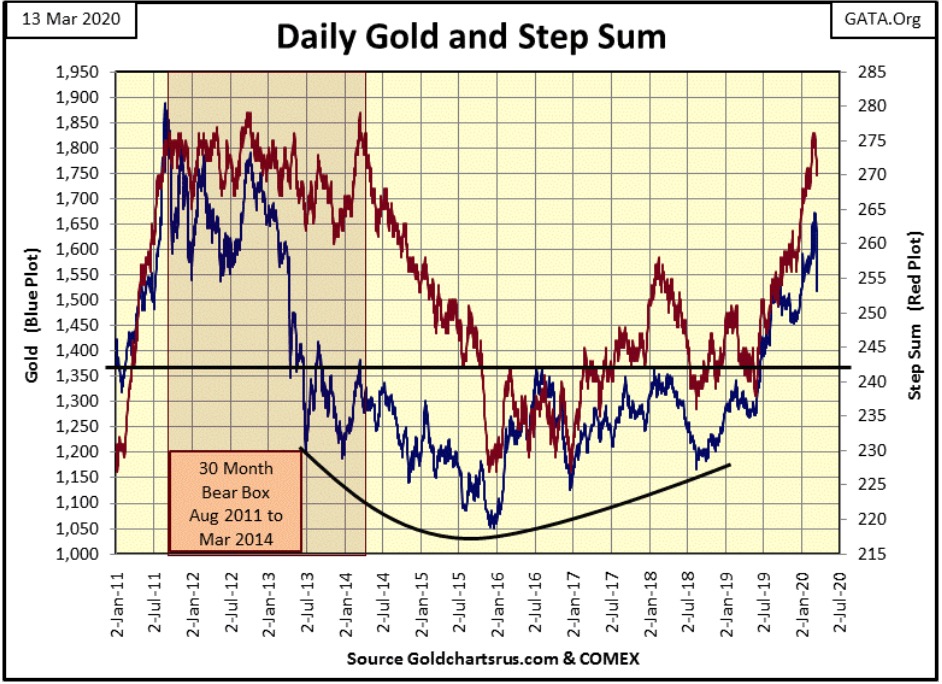
Last week wasn’t kind to gold or its step sum in the chart below. But as I said before bull markets in their stage #2 see sharp corrections. This is something we don’t have to like; just something we have to learn to live with. By the first of May, this chart should once again be looking darn bullish. And if it isn’t? We have six weeks to consider that.
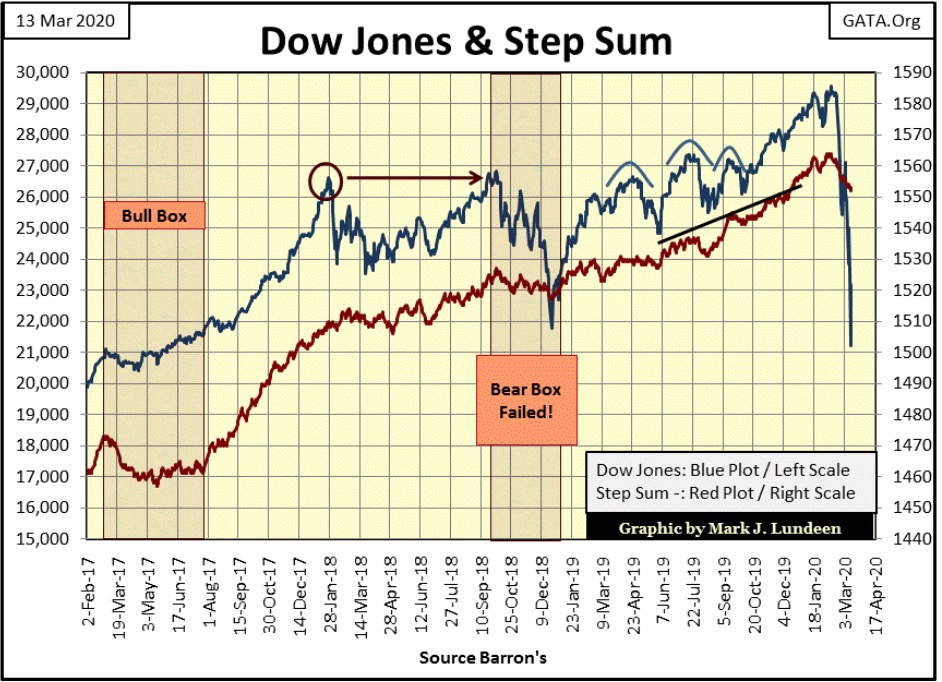
The Dow Jones and its step sum below have all the appeal of a box of damaged goods. But this bear market is going to last longer than most people expect, and it won’t go down in a straight line from the bull market’s last all-time high to its ultimate bear market low.
Along the way we need to anticipate some sharp bullish corrections (advances) in the Dow Jones below. After a week of market extremes that we’ve just seen, I’m thinking we are due for one, and it may go on for a few weeks or months too.
Now to gold and the Dow Jones step sum tables; but first thing first – gold may be down by 3.27% since February 7th, but the Dow Jones is down by 20.33%. Had we used Thursday’s data gold would have been up 0.47% while the Dow Jones would have been down by 27.15%.
Gold’s 15 count closed the week at -5, a bit oversold, but not excessively so. If gold is on a bull market we should soon see some action to the upside from here. It may take a few weeks before it happens, but if we’re not at the bottom of the current correction, we’re not far from it. $1450 should be a solid floor in the gold market.
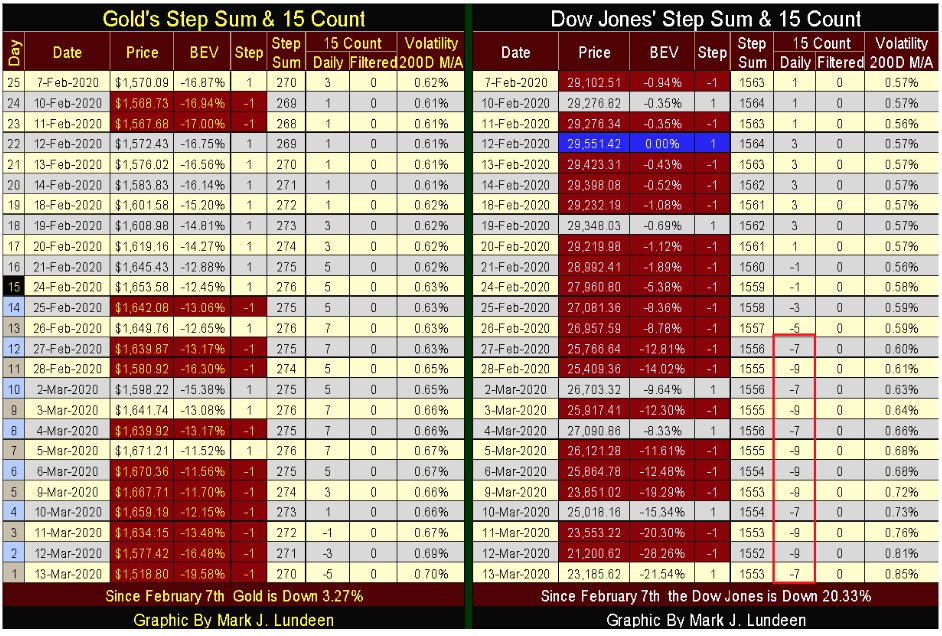
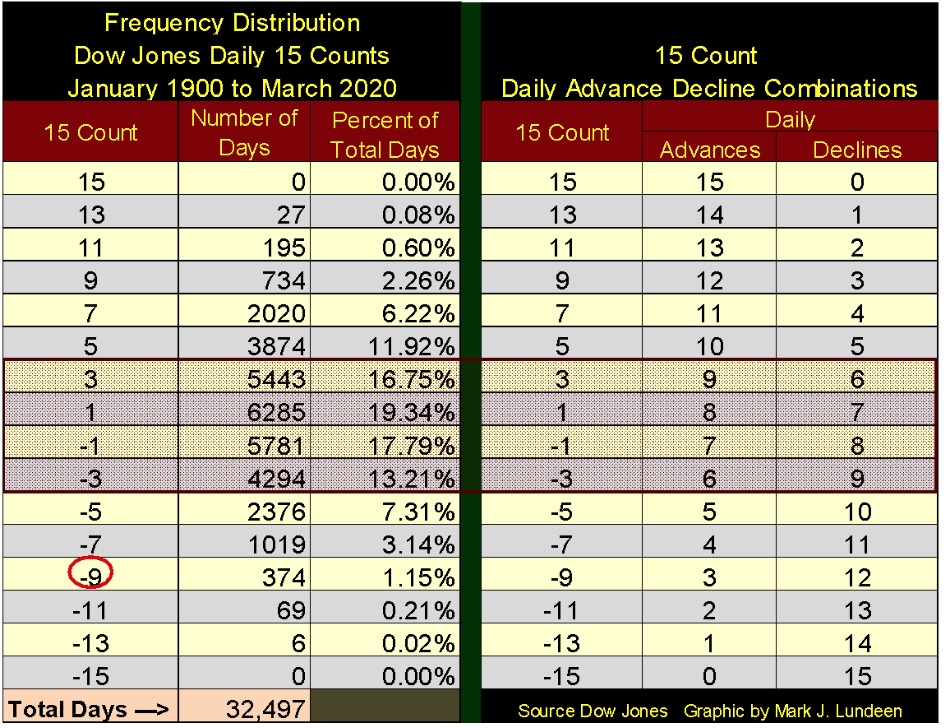
Looking at the 15 count for the Dow Jones; since February 27th it a solid block of -7s & -9s. This is yet one more market extreme seen in this market, as seen in the Freq Distribution table below. We see seven -9s above, but since January 1900 (120 years) there have only been 374 daily closings of the Dow Jones registering a 15 count of -9.
Maybe not starting next week, but sometime in the not to distance future the stock market is due for a nice bounce off of its current lows, though it may yet see additional selling pressure next week.
President Trump has declared Sunday, March 15th a national day of prayer. With the problems covered above in the financial markets and the coronavirus pandemic; it is good our President has done what other Presidents have done in the past during difficult times; ask for God’s help.
So if you’re a believer in the God of Abraham, Isaac and Jacob (and I sure am), you may want to get together with some of your friends in faith and pray to God to help the world get past its current troubles.
Second Chronicles 7:14 gives us a nice verse to think about during this national day of prayer:
If my people, who are called by my name, will humble themselves and pray and seek my face and turn from their wicked ways, then I will hear from heaven, and I will forgive their sin and will heal their land.
Thank you, Lord for all you do for us. Amen.
—
(Featured image by Chris Li on Unsplash)
DISCLAIMER: This article was written by a third party contributor and does not reflect the opinion of Born2Invest, its management, staff or its associates. Please review our disclaimer for more information.
This article may include forward-looking statements. These forward-looking statements generally are identified by the words “believe,” “project,” “estimate,” “become,” “plan,” “will,” and similar expressions. These forward-looking statements involve known and unknown risks as well as uncertainties, including those discussed in the following cautionary statements and elsewhere in this article and on this site. Although the Company may believe that its expectations are based on reasonable assumptions, the actual results that the Company may achieve may differ materially from any forward-looking statements, which reflect the opinions of the management of the Company only as of the date hereof. Additionally, please make sure to read these important disclosures.


XRP Under Pressure Amid Macro Forces, Fed Policy, and Regulatory Shifts
XRP remains under pressure despite easing geopolitical tensions, as macroeconomic factors and Fed policy dominate market sentiment. Liquidations and high...


Edison Accelerates Renewable Growth and ESG Impact in 2025
Edison reports strong 2025 sustainability progress, boosting renewable investments by 90% to reach 2.3 GW toward a 4 GW 2030...


New Gene Therapies Transform Rare Disease Care, but Gaps Remain
Gene therapies are transforming rare disease treatment, enabling normal lives for some patients. However, only about 6% of 7,000 rare...


Temotiva Launches Crowdfunding Campaign to Advance Preventive Mental Health
Temotiva Innovación Lab has launched a crowdfunding campaign through Santander X Explorer, marking a new phase for the University of...


Fed Policy Shift Raises Concerns Over Debt and Inflation Risks
The Federal Reserve is criticized for resuming balance sheet expansion through Treasury purchases despite expectations of tighter policy under new...
 |
|
 |  |
 |
|
-

 Business1 week ago
SpaceX IPO Sparks Déjà Vu as Market Risks Loom and Gold Bulls Stay Hopeful
-

 Business2 weeks ago
Dow Jones Rally Faces Uncertainty Amid NASDAQ Reversal
-

 Crowdfunding5 days ago
Wyrmgold Launches Crowdfunding Campaign for Believe in me! (please)
-

 Biotech2 weeks ago
The German Biotech Industry Faces Funding Crunch Despite Market Stability