Featured
A look at the diverging U.S. money supply and the velocity of money
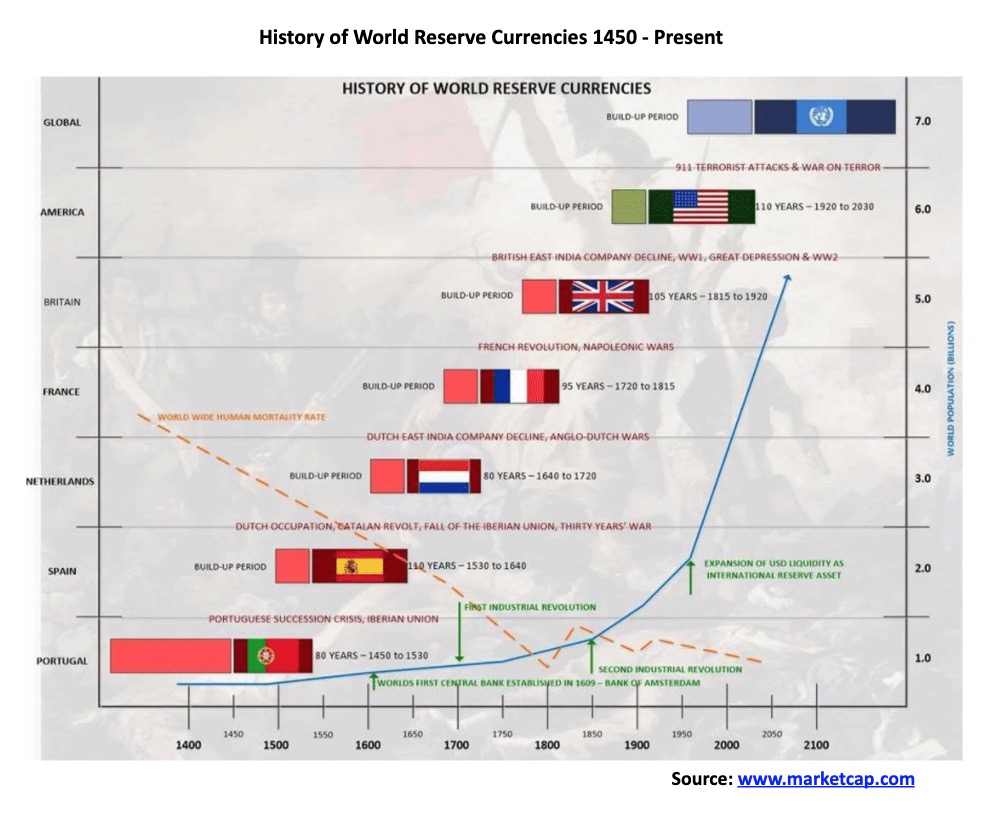
This week we look at the history of reserve currencies and what fate befalls the U.S. dollar as the world’s reserve currency. Historically, at least since the Age of Discovery, a reserve currency has a shelf life of roughly 94 years with the longest being the British pound sterling and the Spanish real. By many measurements the U.S. dollar as the world’s reserve currency is coming to an end.
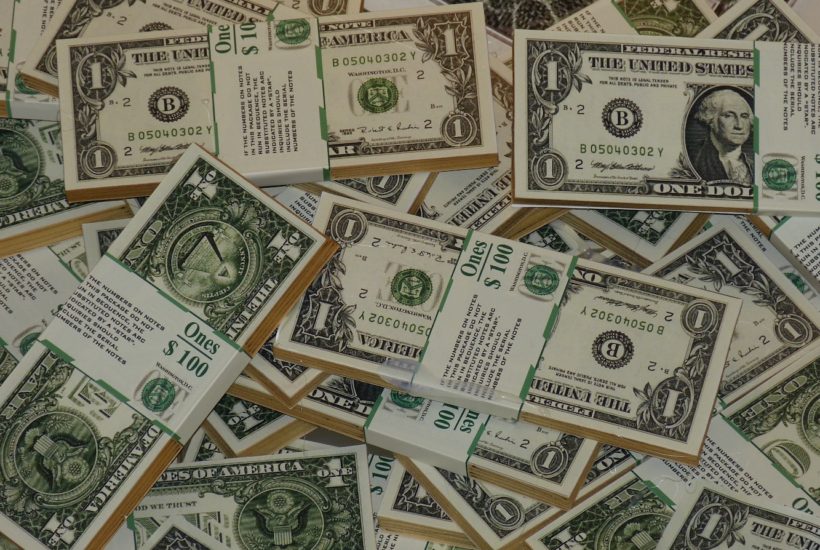
The trouble is that money no longer makes that clinking, clanking sound. More like a dull thud. Today’s coins are made from nickel-plated steel. They used to be made from silver, well mostly silver. But over the years silver as a component became less and less until they just stopped using it. A twenty-dollar bill is just made of paper (cotton and sometimes with some linen). What is a $20 bill worth? Not much. A $20 bill in the U.S. says – “This Note is Legal Tender for All Debts, Public and Private.” In other words, it is an I.O.U. They can be printed ad infinitum. Your money is worthless. Except for the fact that the government says it can be used for legal tender with a value printed on it.
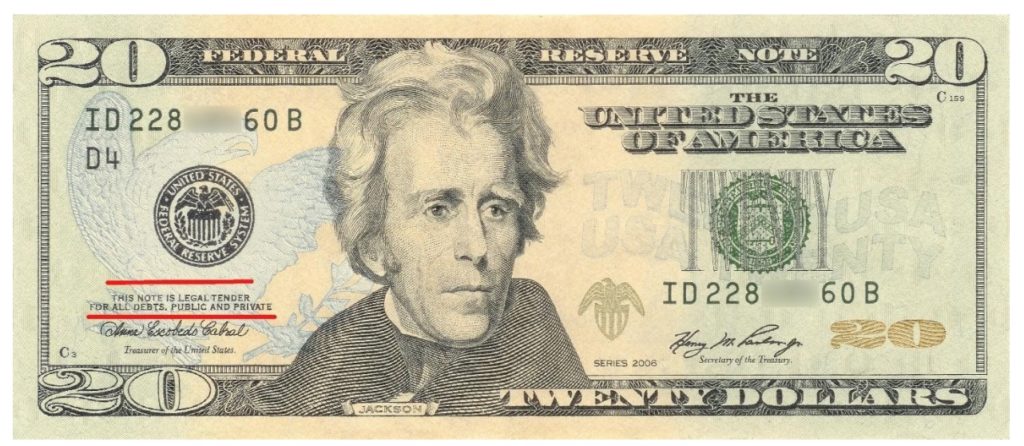
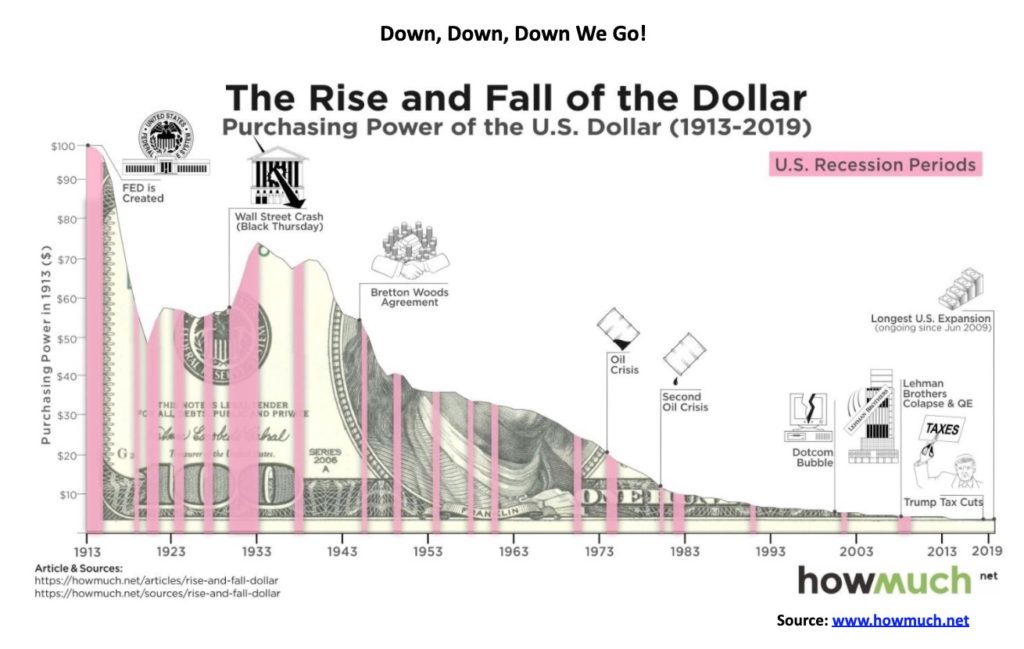
There is a little problem. That $20 bill today would only purchase what would be worth $0.76 in 1913 the year the Federal Reserve came into existence. It implies a devaluation of 96.2%. In Canada, the $20 bill would be worth $0.86 for a devaluation of 95.7%. Even Rickards was off a bit.
Fiat currency has led to the collapse of almost every economy that has tried to institute a fiat currency. Will the U.S. dollar be an exception? Yet since 1971 when President Richard Nixon took the world off the gold standard, we have been experimenting with a fiat currency. With nothing to anchor the currency to, i.e. gold, one can print it ad infinitum. And the U.S. dollar acts as the world’s reserve currency. But for how much longer?
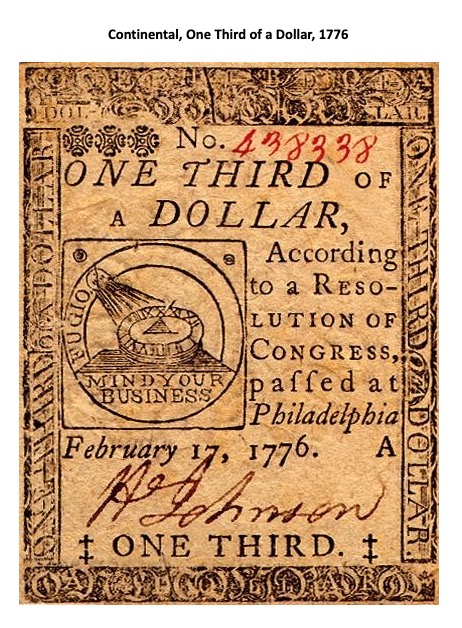
The history of fiat currencies is not a pretty one. The Chinese tried it during the 11th to 13th centuries. It ended in chaos. The French tried it three times. The first was under the Sun King Louis XIV, then again under his successor Louis XV. In the end, the currency became worthless. The French did it again in the late 18th century. They were called assignats. It suffered 13,000% inflation. Napoleon replaced it with a gold franc. The French tried it again in the 1930’s with a paper franc. Within a decade it devalued 99%. Possibly one of the most famous was Germany after WW1. Seems it needed 133 printing companies to produce the Deutsche Mark in order to help pay for its reparations. The only thing it was good for in the end was burning it to keep warm. The U.S. even financed its revolutionary war with what was known as the Continental. Oh yes it crashed. The new U.S. dollar was backed by gold.
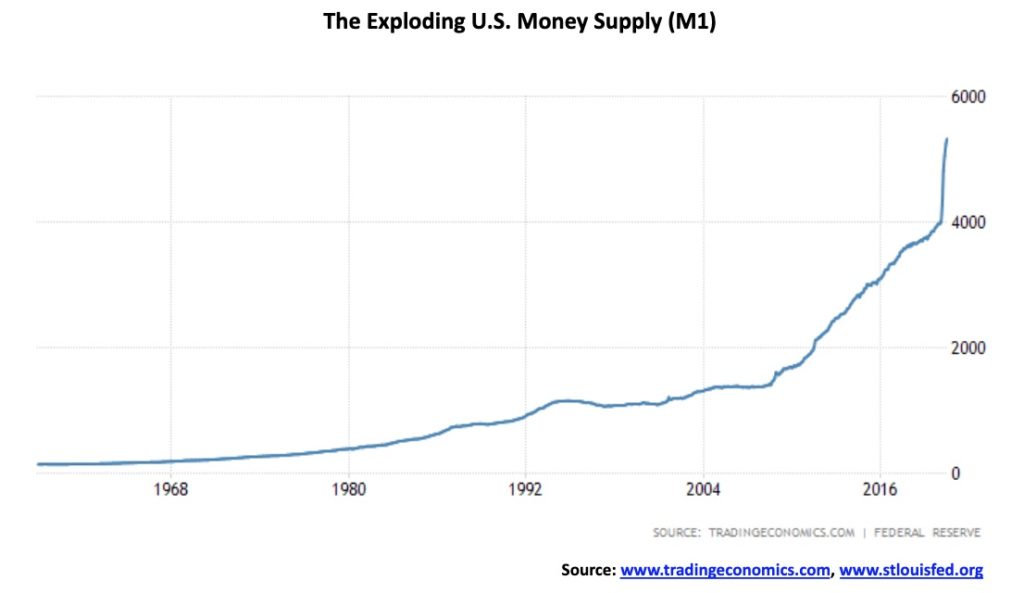
So, what will happen with this latest experiment? One thing that has already happened is that money supply has exploded. The U.S. money supply is taking on the look of the hockey stick, meaning it is now sticking straight up. Since 1959 when this chart started it has exploded 3,800%. Since the end of February 2020 M1 has gone up 35% or $1.4 trillion. That alone represents 27% of the gain since 1959. No, we don’t need wheelbarrows, yet. But could it happen?
A reserve currency is a foreign currency or precious metal that is held in large quantities by a country’s government, central bank, or other monetary authority. It is used for participating in the global economy, such as through international transactions in trade or investments. A reserve currency has depth and liquidity, it can be freely and easily exchanged for other currencies, and it is held by monetary authorities and institutions in significant amounts.
Ancient Greece and Rome
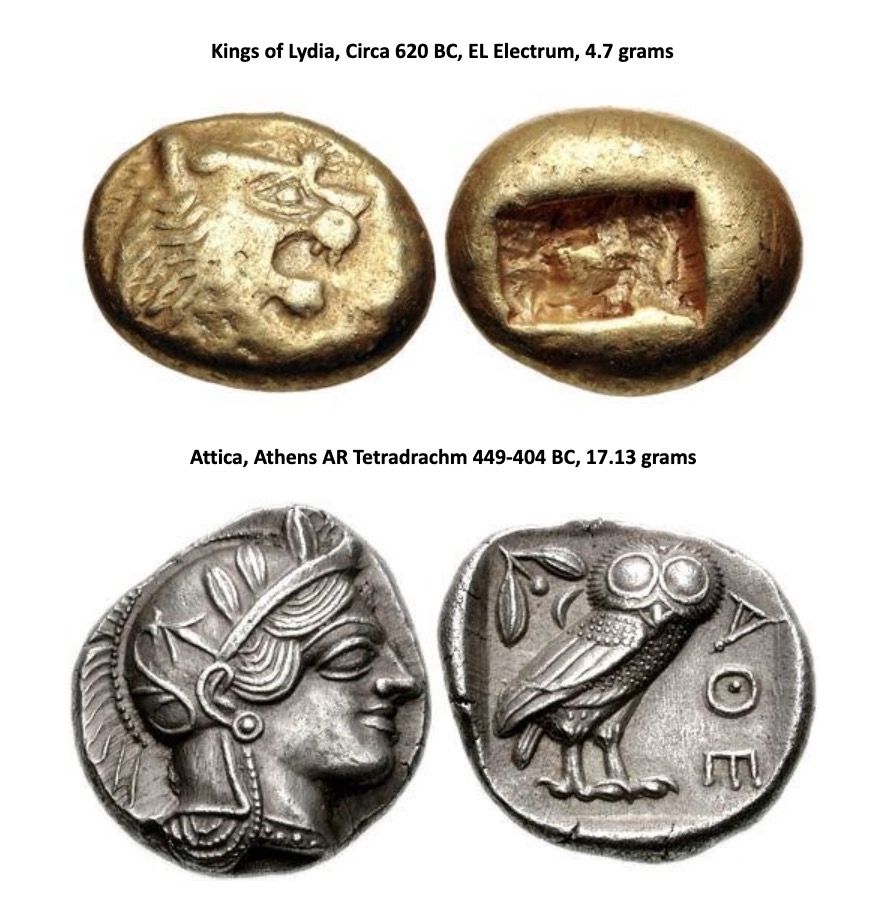
As empires rose and fell there was a dominant currency that circulated around the world. The first coins appeared around 600 BC in Lydia a kingdom tied to ancient Greece but located in today’s Turkey. The first coins were made of electrum, an alloy of gold and silver.
Probably the first coins that were circulated widely was the tetradrachm of Ancient Greece. Athens was the financial center of Ancient Greece. The coin shown below, with the head of Athena, became known as the Athens Owl. The coin has been found all over Europe and Asia demonstrating its wide use. The Owl was amongst the first coins widely imitated in other fringe economies of the time. There were also gold Staters but it was the silver tetradrachm that was widely used for trade and exchange.
Ancient Greece was at its height in the 5th and 4th centuries B.C. It was at the time the most advanced economy in the world. Following the death of Alexander, the Great, in 323 BC, the Greek empire began to fracture as it was divided up between his generals. Civil wars, rising inequality, emigration and more led eventually to the conquering of Greece by the Roman Republic. Greece became a province of Rome by 146 BC.
With the rise of first the Roman Republic (510 BC – 27 BC) then Imperial Rome (27 BC – 476 AD), Rome became the financial capital of the western world. Their currency, as represented by the silver denarius and the gold aureus became prized and circulated around the world even into fringe economies and as well India and China. Imitations of roman coins were common in the fringe economies surrounding the Roman Empire. We know that the circulation of roman coins was far and wide as they have been found as far away as China. Trade between Rome and China and India as well was huge with spices and fine silk that came from China while glass, wools, gold and silver and other goods went east to China primarily along the ancient silk road that predated Rome.
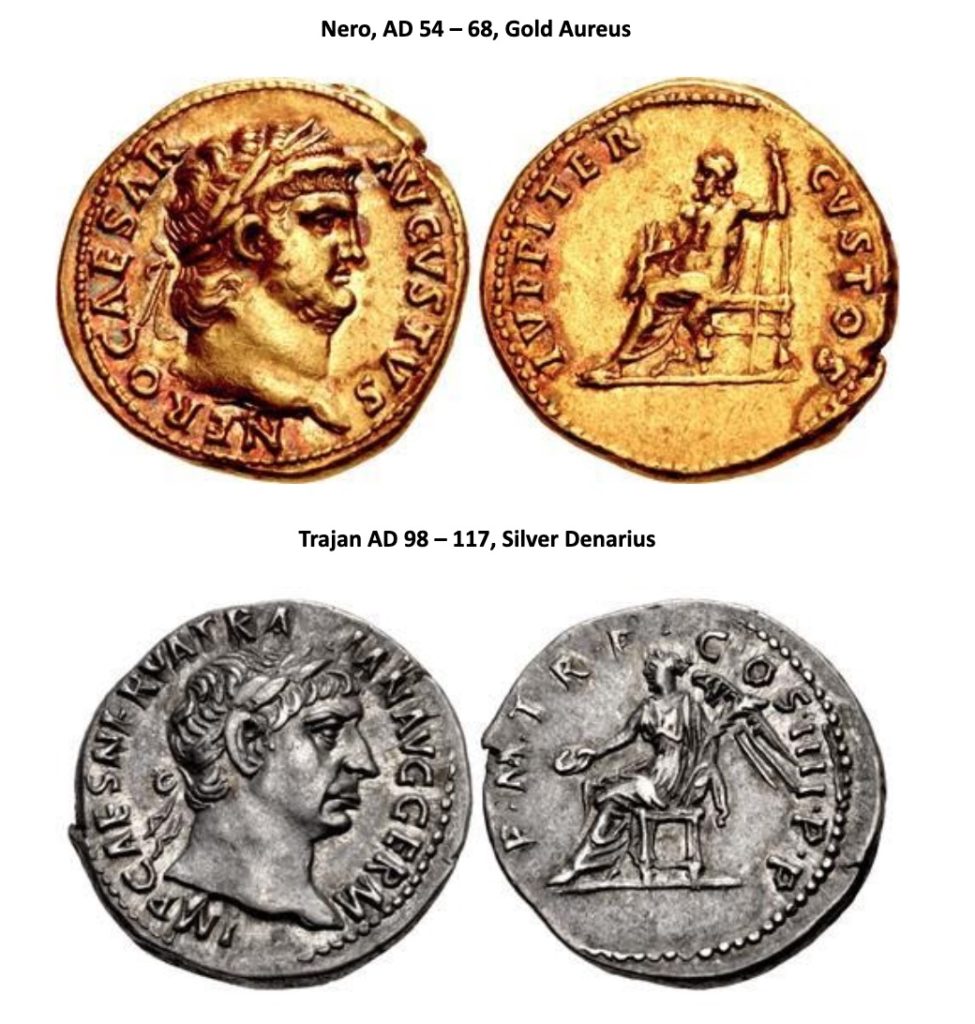
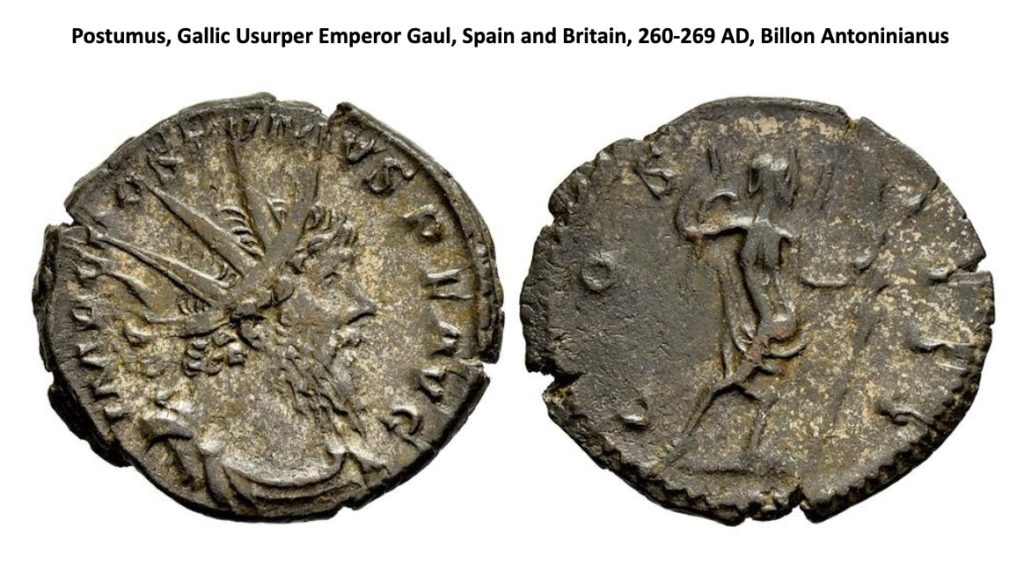
Imperial Rome at its peak covered an area larger than the U.S. today. It was also the world’s largest economy at the time. Like the U.S. today Rome ran huge trade deficits. Roman senators warned that if they didn’t curtail their deficits that they could go bankrupt. They were right although it didn’t happen overnight. Debasement of the currency was common. The silver denarius that was once almost pure silver (95%-98%) was cut first by Nero to 80% then over time it kept falling until it was no more. It was effectively replaced by what was known as the antoninianus and over time the antoninanus became nothing more than copper. The Roman Empire began its decline in the late 2nd century particularly following the Plague of Antonine 165 AD – 180 AD. The empire degenerated into a series of civil wars, soldier emperors, rising inequality, financial crises, economic deterioration and attacks from barbarian tribes.
Byzantine Empire and The Fall of Rome
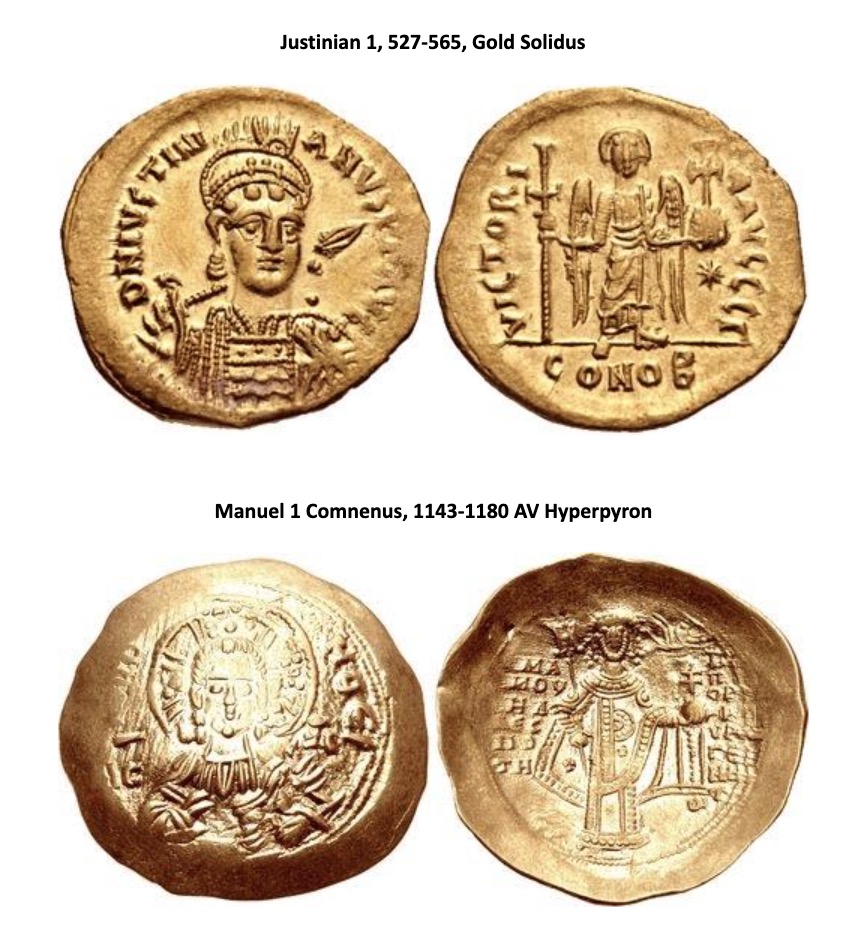
By about 400 AD the Roman Empire had been split into East and West. The western half continued its deterioration until it was overrun by barbarians in 476 AD. The Eastern half continued with its capital at Constantinople and eventually, it became known as the Byzantine Empire. The Byzantine Empire eventually fell to the Ottomans in 1453. The Byzantines continued to be the dominant financial, military, and economic power, and the gold solidus replaced the gold aureus starting in the 4th century. The gold solidus became the dominant coinage for trade. That effectively lasted until the fall of the Byzantine Empire. Towards the end of the Byzantine Empire, the gold solidus itself was replaced by what was known as the hyperpyron. The solidus became the victim of the Byzantines sliding into civil wars along with military disasters and rising inequality and by the 1080s its gold content had been reduced to almost zero. The coinage was overhauled and the solidus was replaced by the hyperpyron which itself was a debased version of the former gold solidus. As the Byzantine Empire declined its use as an international medium of exchange also declined. During the latter part of the Byzantine Empire, the Arab Dinar also became prevalent for use in international trade. The Arab Dinar dominated primarily between the 7th and 10th centuries.
Medieval Ages
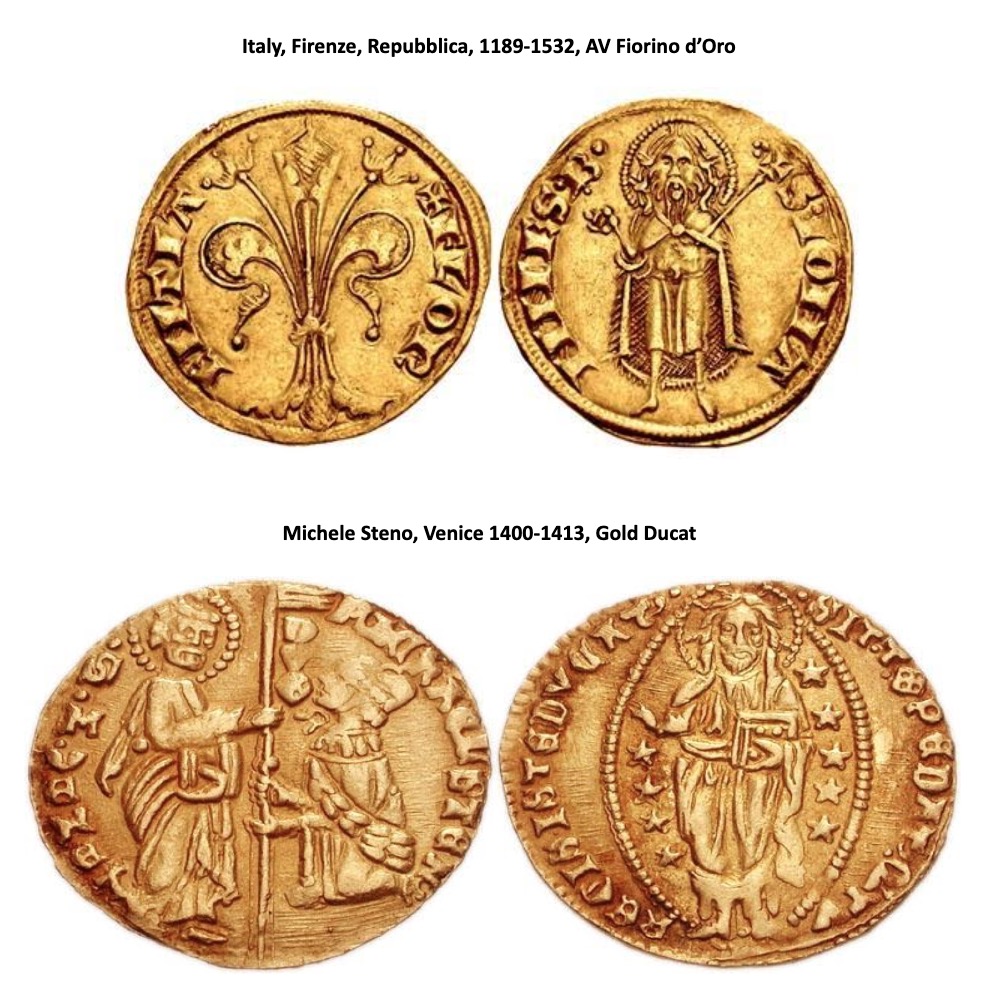
With the fall of the Byzantine empire towards the end of the middle ages and beginning of the age of exploration and the rise of the western European nations’ gold coins remained at the heart of international trade. One of the first to gain international acceptance was the gold florin of Florence along with the gold ducat of Venice. The florin dominated from roughly the 13th century to the 15th century. As we had previously seen with the Athenian, Roman and then Byzantine the ducat in particular was widely copied by others to use as their coinage.
Renaissance and the Age of Exploration
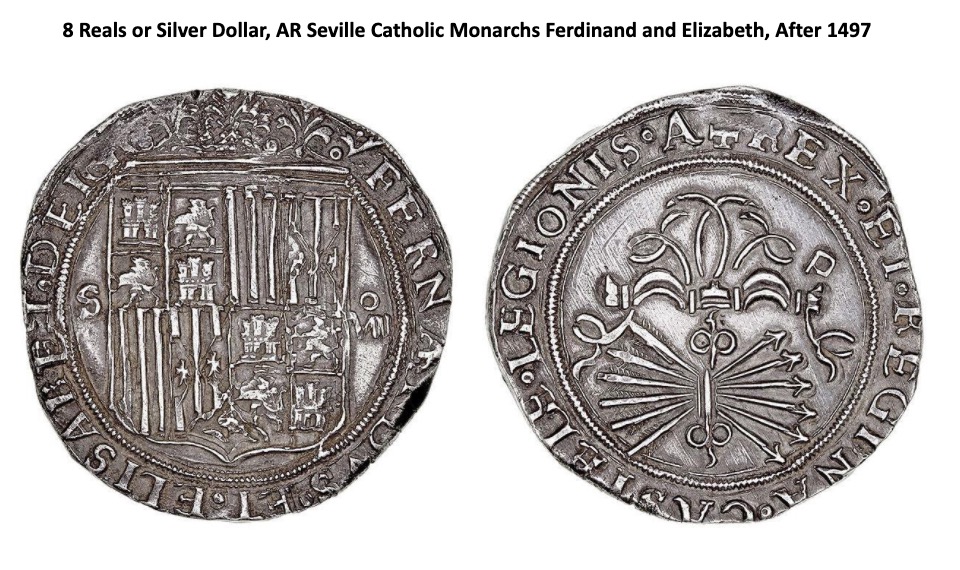
Early exploration by Portugal in the 15th century brought Portugal from being one of the poorest countries in western Europe to one of the richest. The Portugese dominated Western Africa where they traded for gold in what became known as the Gold Coast. The result was that the Portugese version of the ducat also known as the cruzado became dominant for about 80 years from 1450-1530. The financial center was in Lisbon. The Portugese Succession Crisis 1580-1583 brought Portugal’s dominance to an end. It also coincided with the rise of Spain as the dominant empire in Europe as Spain dominated the union with Portugal known as the Iberian Union 1580-1640. Spanish coins were soon accepted as the international means of exchange whether it was called the Real, the Escudo or the Peseta. The Real was the official Spanish currency from roughly the mid 14th century to the mid 19th century. Spain’s financial center was in Madrid. Spain’s dominance as the international reserve currency lasted roughly 110 years from 1530-1640. The collapse of the Iberian Union coupled with its wars with England saw Spain’s influence and power wane.
Beginning of the Modern Period and the Age of Revolutions
One of the biggest European trading companies was the Dutch East India Trade Company. Founded in 1602 the company lasted until 1800 and dominated trade primarily in the 17th century. The company helped give rise to the Netherlands as a trading and military power that lasted through parts of the 17th and 18th century 1640-1720. The result was its currency, known as the Dutch Guilder became widely used for trade. Like many before it, the Guilder was also widely imitated. The Dutch Guilder in many ways was just another version of the florin that was started in Florence in the 13th century. It was during the 17th century that paper bills started to replace coins. But the bills were effectively backed by gold giving rise to a gold standard. The Anglo-Dutch wars that actually started in 1652 and ended in 1784 saw the Netherlands begin to lose its influence as the dominant trading nation. Wars not only with England but also with France and the plagues of the 17th century brought about what was known as the Disaster Year 1672. Dutch influence began to wane.
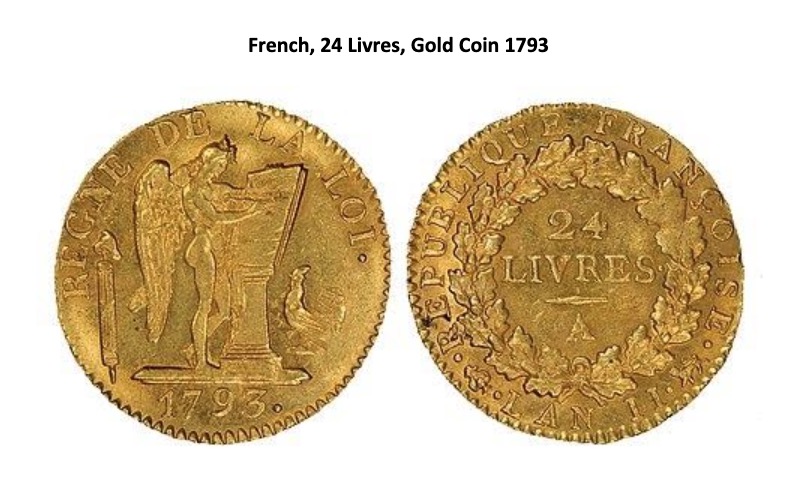
With the Dutch beginning to fade it was next the turn of France to dominant the 18th century. The livre (French for Pound) became the dominant currency for trade. France also used paper currency beginning in 1701 but it didn’t hold its value as they produced far too much relative to silver that was to back it. It crashed in 1720 and became worthless. The French livre dominated for 95 years from 1720-1815. But again, it was wars (Seven Years War 1756-1763), massive inequality followed by the French Revolution 1789-1799 then the Napoleonic wars 1803-1815 that brought France’s reign and dominance to an end.
The British Empire and the Rise of the U.S.
The British East India Company 1600-1874 became the most powerful corporation in the world during the 17th and 18th century. It was the Apple of its day. With the defeat of France at the Battle of Waterloo in 1815 England stood as the undisputed military and economic power of the world. At its heart was the British East India Company that dominated trade in South Asia primarily the Indian sub-continent and strengthened its hold on its growing colonies in North America (Canada) despite having lost the America’s during the American Revolution (1775-1783). The East India Company was not only a trading company it was military organization and they had their own army and navy. The company began to wind down in 1858 due to its abuses of power and Britain eventually took full control. The company was a major transmitter of slaves during the 17th and 18th century and it was at the center of the opium trade between India and China in the 19th leading England into the Opium wars with China 1839-1842 and 1856-1860.
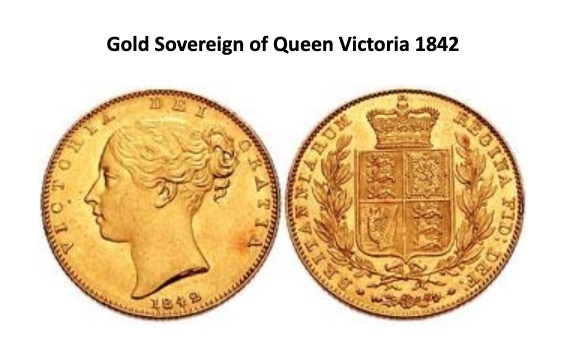
The British pound became the dominant world currency during the 19th century and continued its domination into the 20th century before it began to lose its dominance particularly after WW1. London was the financial capital of the world. The sovereign was a gold coin with a nominal value of one pound and it became the symbol of England in the 19th and into the 20th century. It was first struck in 1817. It was accepted all around the world for trade and the payment of goods.
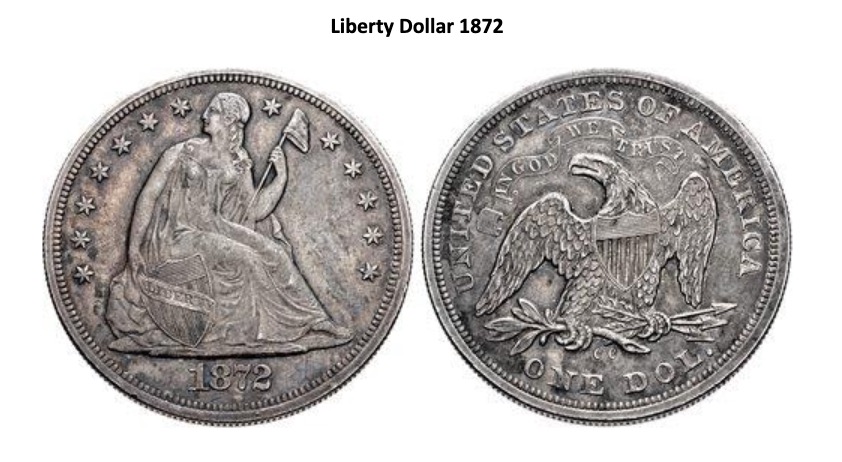
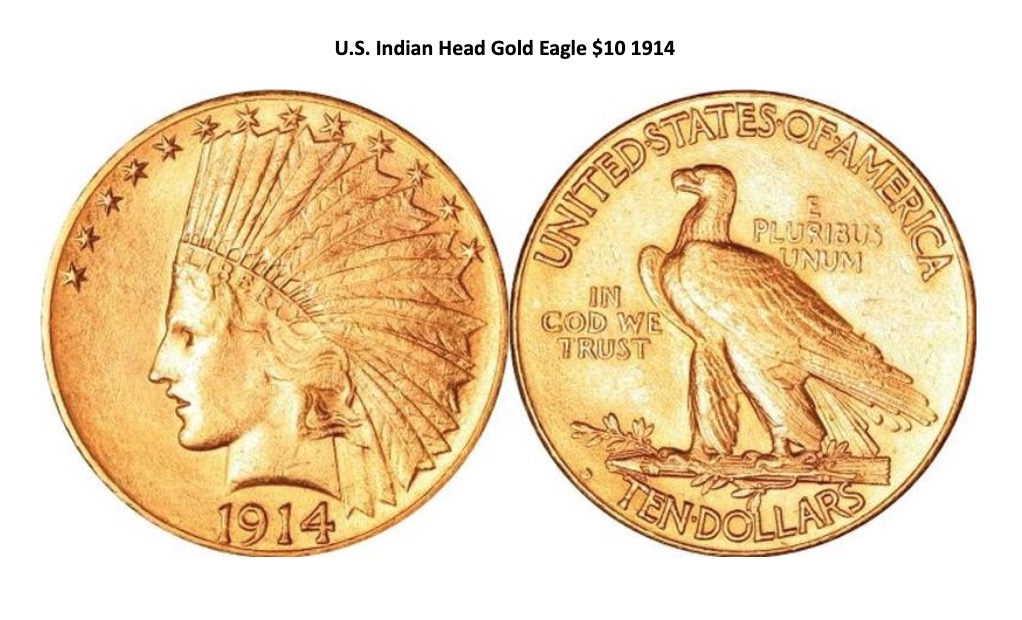
The rise of the U.S. as the dominant nation got underway with WW1 and with the end of WW2 and Bretton Woods the U.S. dollar became the world’s reserve currency. The U.S. dollar was pegged to gold at $35/ounce.
Why is the U.S. the world’s reserve currency? Or for that matter why were any of the previous currencies considered to be the reserve currency? First the currency must be used in international trade more than any other currency and second the reserve status comes from where the money is simply parked. Both these reasons applied to previous reserve currencies going back to ancient times.
The world was flooded with U.S. dollars following WW2 largely to reconstruct Europe and Japan. The U.S. dollar became dominant because it was everywhere, it was used everywhere and people even began to prefer to hold U.S. dollars rather than their own currency. It was not unusual for tourists to be approached to sell U.S. dollars for the local currency and the rate (black market) was normally better than the official rate. The U.S. dollar became the main conduit for illegal transactions as well particularly the drug trade.
End of the Gold Standard
Bretton Woods set the U.S. dollar as the world’s reserve currency backed by gold at a price of $35/ounce. Earlier the U.S. had gone off the gold standard in 1933 when President Roosevelt enacted Congress’s resolution nullifying the right of creditors to demand payment in gold. The U.S. had been on a gold standard since 1879 except for an embargo on gold imports during WW1. Roosevelt ordered all persons to deliver gold coins, bullion and certificates to the Federal Reserve at a then price of $20.67/ounce. Following that in 1934 gold was revalued upwards to $35/ounce at the time a 69% revaluation upward of gold relative to the U.S. dollar. That price was held until President Richard Nixon took the world off the gold standard in August 1971. The reason was to stave off a run on U.S. gold reserves. Effectively it was a default on the part of the U.S.
According to SWIFT www.swift.com the U.S. dollar dominates daily transactions and global trade. All commodities are priced in U.S. dollars. U.S. dollars make up some 80% of all global trade through SWIFT. The euro is next at 6%, followed by the Japanese yen at 3%, the pound sterling at 3%, and the Cdn$ at just under 3%. Yes, the Chinese yuan is used but it is still only around 1%. In terms of international cross border transactions, SWIFT reports that U.S. dollars make up over 50% of transactions. Again, the euro ranks second, the pound third, then the yen and the yuan is well down under 1%. It is no surprise to learn only because figures are available that during the 19th century to about the mid 20th century that the British pound made up roughly 60% of global trade.
In terms of parked money, the U.S. dollar dominates. Parked money is reserves held in central banks. Central banks today hold an estimated $11.7 trillion of foreign exchange reserves. The U.S. dollar makes up about 60% of all international reserves or roughly $6.8 trillion. The euro is next at around 20%, the Japanese yen at just over 5%, the pound sterling at just under 5%, and the growing Chinese yuan at almost 2%. Other currencies include Swiss francs, Australian and Canadian dollars. Oh yes, and gold. Central banks hold an estimated 33,678 metric tonnes with a current value of about $2.1 trillion.
The U.S. dollar remains in heavy demand. The bulk of the world’s debt is in U.S. dollars estimated at least 40%. The dollar remains in heavy demand around the world. So, its demise is not going to happen overnight. Why do people and countries rush to dollars? It is currency of the dominant economy. We noted that even back in ancient times fringe countries imitated, not counterfeited, the coinage of Ancient Greece and Rome. This demonstrates the stature of the dominant economy. People also rush to gold but gold is the currency of choice when you don’t trust the government any longer. Could that happen?
So, will the reign of the U.S. dollar come to an end? History suggests that it should eventually happen. Since medieval times the average life of a reserve currency is 94 years. The longest was the Spanish real and the British pound. Both lasted 110 years. The U.S. dollar began its rise around 1920 after WW1. 110 years puts us at 2030 another decade away. Could it happen? And what will replace it?
When the rise of the U.S. dollar got underway the U.S. was a creditor nation. Today it is a debtor nation. It is interesting to note that in all instances of previous reserve currencies that their demise came as they increased spending, provided easy credit and went deeper into debt. Today U.S. Federal debt stands at $26.7 trillion. That’s up $7.4 trillion since 2017 when President Trump took over. That’s astounding considering that under the previous President Obama debt grew by over $9 trillion. However, that was over 8 years, not 4, and the bulk of the increase came as a result of the 2008 financial meltdown and was in the works when Obama assumed power in 2009. Today U.S. Federal debt to GDP sits at almost 137% putting the U.S. in the same league as Italy or Greece. Total debt (Federal, state, municipal, corporate financial & non-financial, household) to GDP stands at 416%. In 2008 it was at 361%. U.S. debt represents at least one-third of all global debt.
Wars have played a role in the demise of currencies. The Portugese War of Succession, the collapse of the Iberian Union, the Dutch Portugese wars, the Anglo-Dutch wars, the Franco-Anglo wars, Napoleonic wars, and, WW1 all played a role in the collapse of the dominant currency at the time. It bankrupted them. The U.S. spends upwards of $1 trillion on the military alone. No other nation is even remotely close. The U.S. maintains an estimated 800 military bases all over the world. The U.S. remains directly or indirectly involved today in at least 12 conflicts.
The U.S. is built on debt. As well they are involved in trade wars and sanctions. The U.S. is reliant on other countries buying their debt. Japan holds the largest at $1.2 trillion but right behind is China at around $1 trillion. The U.S. and China are locked in trade wars and military maneuvers in the South China Sea and the Straits of Taiwan. The U.S. is also active in trying to stop, slow down or hinder China’s Belt and Road Initiative (BRI) through its involvement in military conflicts in key BRI routes through Iran, Iraq and Syria.
Through the non-government central bank (Federal Reserve) they have the sole right to issue paper currency. Previous private banks played the same role particularly out of Amsterdam for the Dutch, and, London for the British. Even back in the 17th century central banks or the private bank of the day were lending, financing deficits for wars, conducting repo operations and more on behalf of the government.
The U.S. is locked in trade wars and sanctions most notably with Iraq, Iran, Venezuela and even China and Russia. It is an attempt to block them out. It is no different then military blockades of another era. As some note the formula for the end of the U.S. dollar as the world’s reserve currency is already there: perpetual war, huge borrowing binges, and trade wars and sanctions. The U.S. is also at war with itself. We note that civil wars have played a role in the past in the collapse of the dominant economy and empire. U.S. dollar and global hegemony is under attack and it is noteworthy that in previous shifts from one global currency to the next one the world fell into a global war. It is all there in history. Will this time be different?
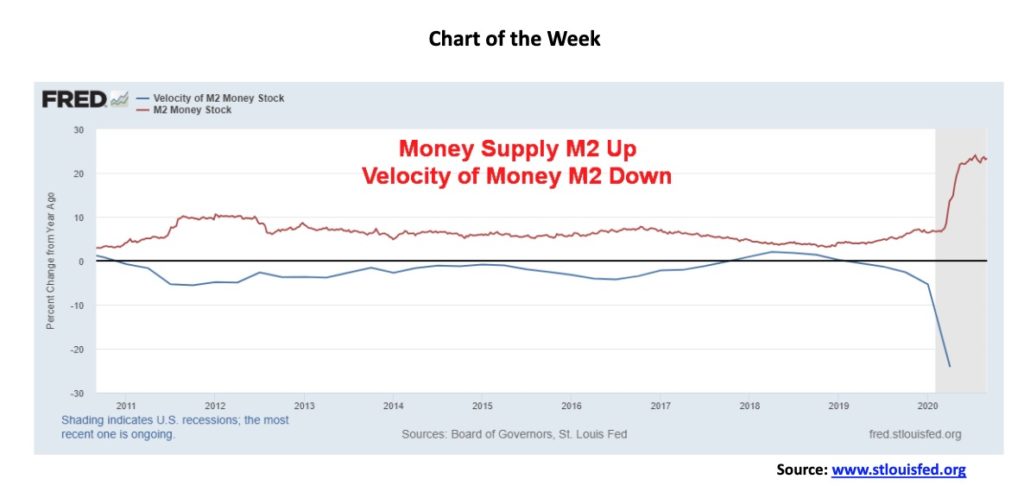
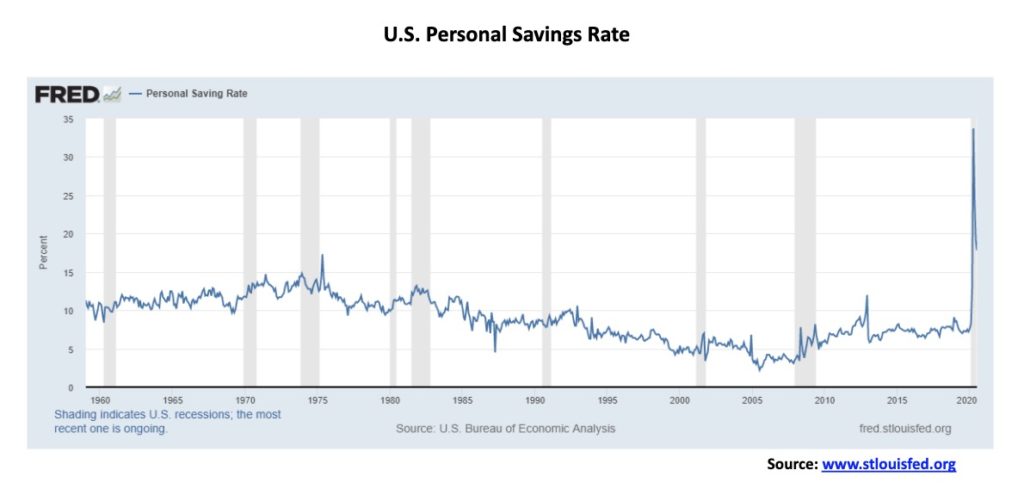
The money supply (M2) just keeps on rising now at $18.5 trillion up over $3 trillion or 20% since the end of January 2020. But the velocity of money keeps on falling down 20% just in Q2. The volume of money is rising but it is not going anywhere. Could there be hoarding going on? The personal savings rate sits at 17.8% at the end of July vs. 8.3% in February before the COVID-19 took hold. It peaked at 33.7% in April. The rise in money supply suggests ongoing debasement of the currency while the collapse in the velocity of money suggests hoarding. In times of economic stress people hoard. And the more they hoard the more they have to pump money into the system to make up for it on the hopes that people actually spend their money. So, what are they doing? Stuffing it under the mattress? Buying gold bars and coins? Either way it bodes poorly for the potential for future inflation (too much money) and no spending except for necessities. In the past when both geopolitics and internal politics deteriorated hoarding of money became common.
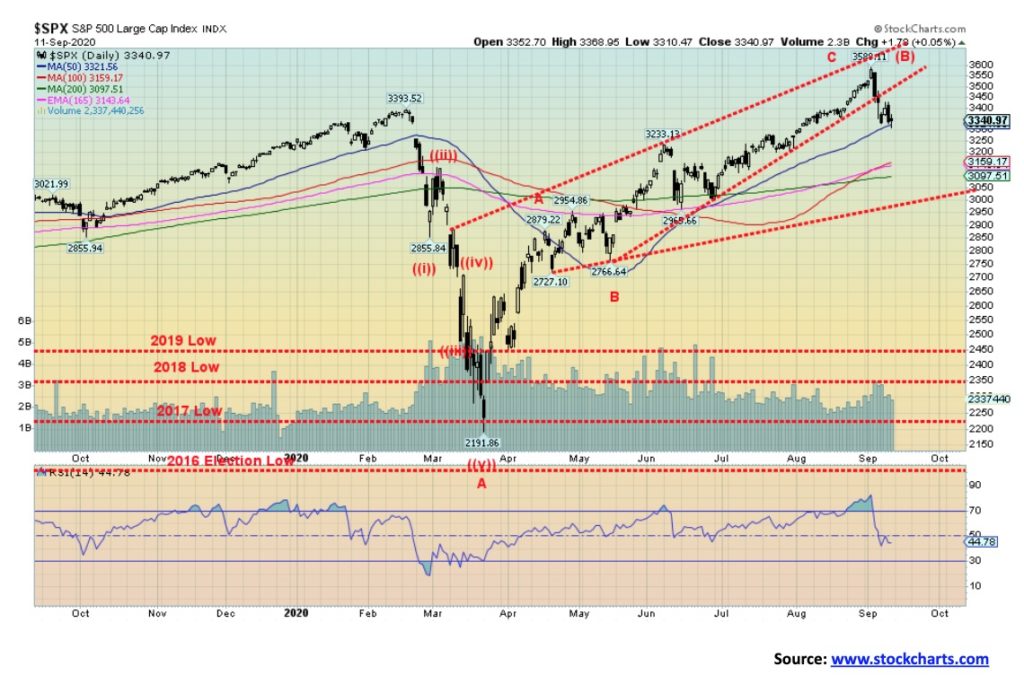
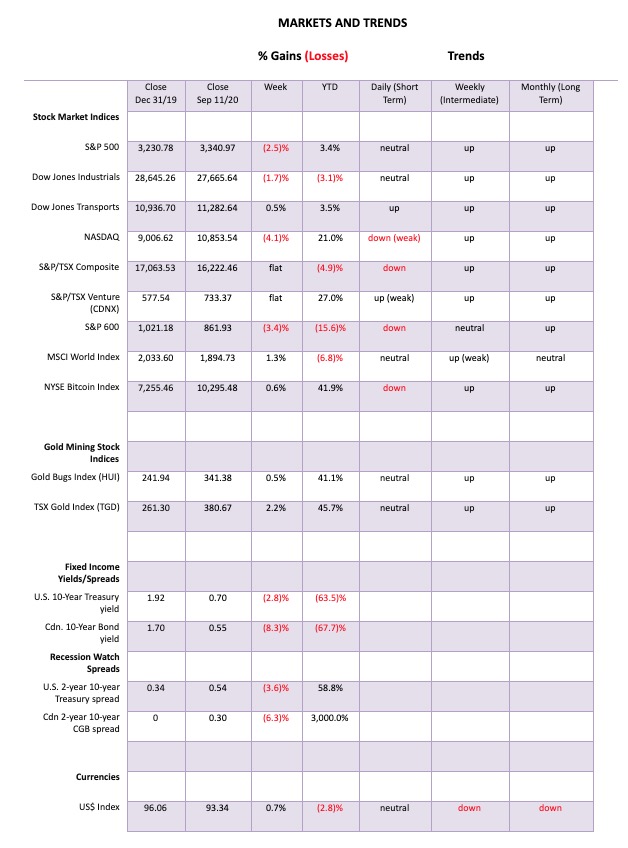
For the second week in a row the stock markets fell. This past week the S&P 500 lost 2.5%. The Dow Jones Industrials (DJI) fell 1.7% and is now down 3.1% on the year. The Dow Jones Transportations (DJT) bucked the trend and gained 0.5%. The NASDAQ was hit hard down 4.1% and now down just over 10% from its all-time high. The small cap S&P 600 fell 3.4% and is now down 15.6% on the year. The underperformance of the small cap vs. the large cap stocks underscores the weakness of the market. Here in Canada both the TSX Composite and the TSX Venture Exchange (CDNX) were effectively flat on the week with a small gain and a small loss. In the EU the London FTSE gained 4.0% despite the Brexit mess being created by Boris Johnson while the Paris CAC 40 was up 1.4% and the German DAX gained 2.8%. China’s Shanghai Index (SSEC) lost 2.8% but the Tokyo Nikkei Dow (TKN) gained 0.9%. Maybe the money is coming out of the U.S. (rising COVID-19 second wave? divisive election?) and going into the EU markets and Japan. We wouldn’t hold our breath on the EU markets but Japan looks intriguing. However, if the stock markets fall usually all of them fall together.
The S&P 500 is now down about 7% from its all-time high. The DJI and the DJT failed to make new all-time highs thus diverging with the S&P 500 and the NASDAQ. The DJI was just short of a new all-time high. We note volume has picked up a bit in the recent decline but has not yet turned into a rout. For the S&P 500 the key support now lies at around 3,200 and below that and especially under 3,000 further sharp declines could be seen. Regaining 3,450 would be positive but we really need to regain back above 3,500 to suggest a possible test of the highs or at least further topping action. Nonetheless the markets remain defensive and we noted considerable insider selling as the markets rose higher while at the same time the public represented through Robo traders and more were piling in. We are still not yet at a point where we can say we will be falling into the November 3 election but we are getting close. It is potentially the most divisive election in U.S. history with attempts to shut down polling stations and remove the ability to mail the divisiveness just gets uglier leading to the potential for an undecided election on November 3 and lawsuits galore. Readers might be interested in this week’s Economist with the headline America’s ugly election, How bad could it get?
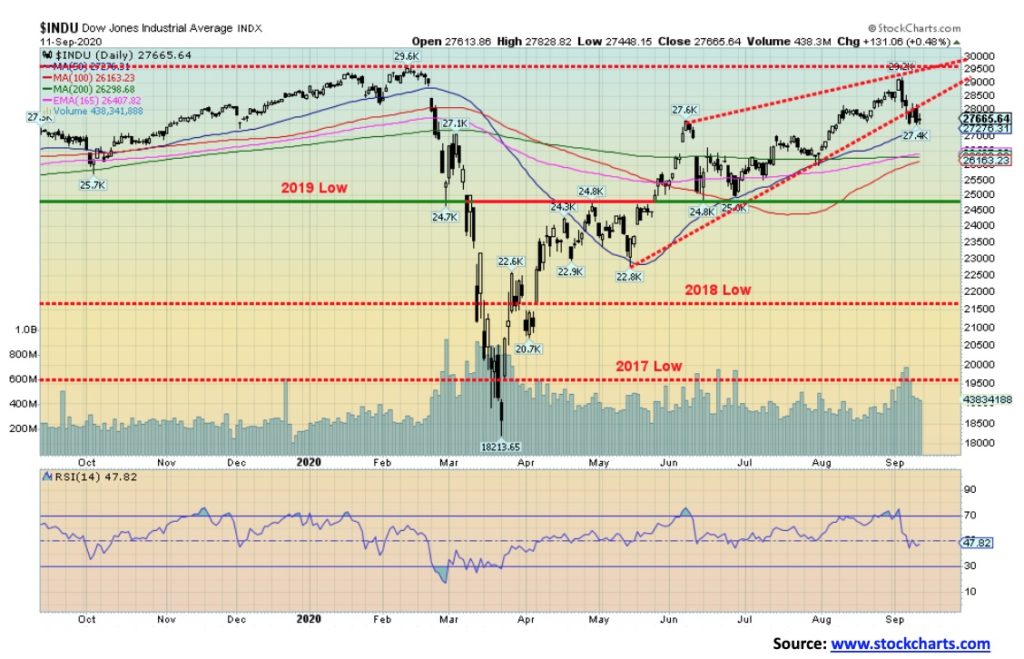
The Dow Jones Industrials (DJI) appears to be finally breaking down. It fell 1.7% this past week. But the Dow Jones Transportations (DJT) is doing well gaining 0.5% bucking the trend. The DJI could be falling from an ascending wedge triangle. It would be targeting that May low near 23,600. The DJI managed to hold the line for us this week but a further break under 26,500 would suggest to us that we much further to fall. A break under 25,000 would set us on a further downward spiral. Only regaining back above 28,500 suggests to us that more topping action may be needed. Above 29,000 and we could be seeing new highs.
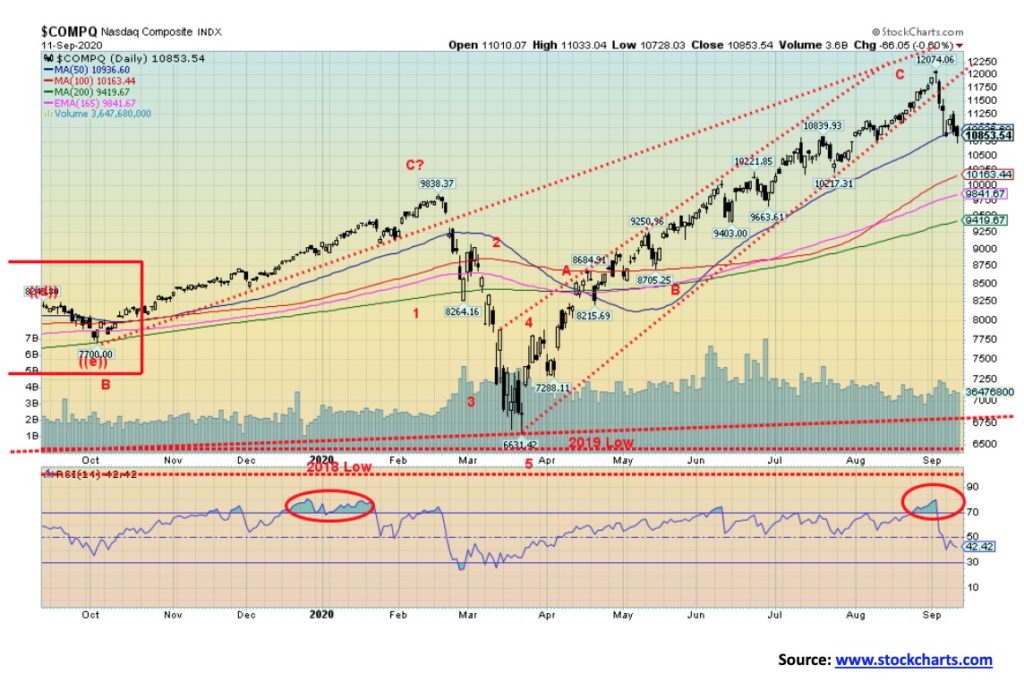
The tech heavy NASDAQ took it on the chin this past week falling 4.1%. The NASDAQ is now down just over 10% from its high seen on September 2. The NASDAQ is threatening to break the 50-day MA and closed under that level on Friday. With an RSI only at 42 it has more room to move lower before getting into oversold territory under 30. A breakdown under 10,200 would seal the decline in the NASDAQ and suggest lower levels. The big tech names all fell this past week led by Tesla down 10.9%. Apple fell 7.4%, Netflix was down 6.6%, Amazon down 5.4%, Facebook dropped 5.7%, Google fell 4.4% and Microsoft dropped 4.8%. The ga-billionaires finally took a hit. They probably didn’t notice. Warren Buffet fared the best as his Berkshire Hathaway was only down about 0.1%. Still we can’t call this a bear market yet. The 200-day MA is way down at 9,400 but we could close the gap quickly if things turn really sour. The NASDAQ dailies have turned down. We need further declines to turn the weeklies down.
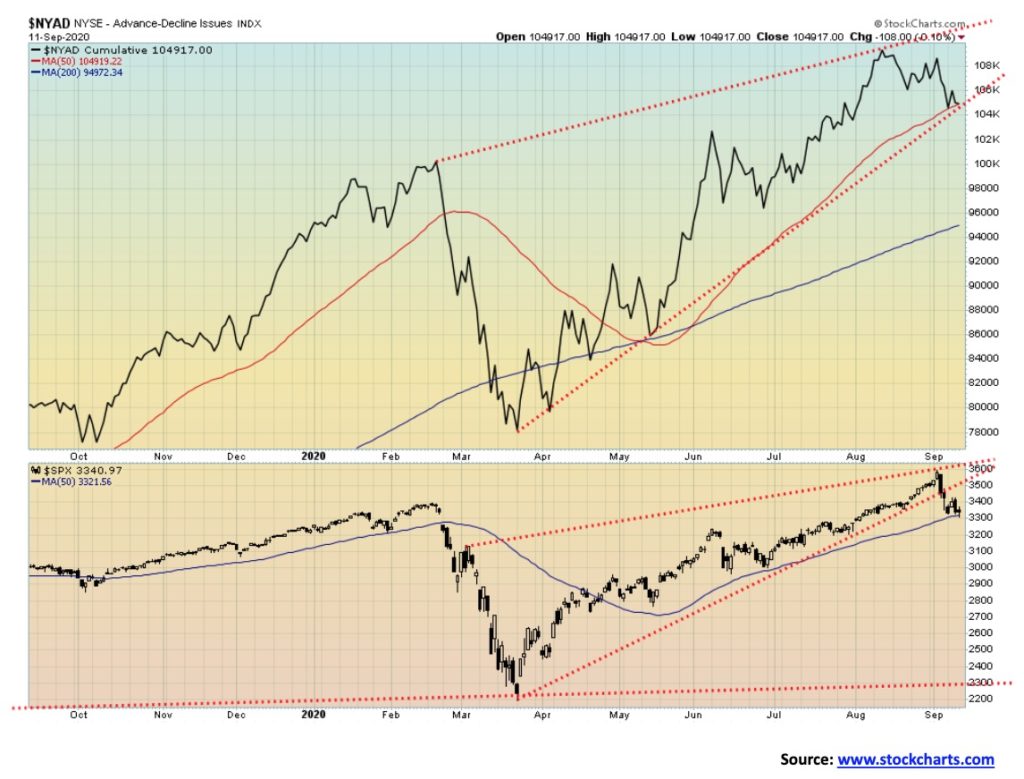
The NYSE advance-decline line has turned down but has not yet broken the uptrend line from the March low. On the other hand, the S&P 500 has broken its uptrend line. Both are now “resting” on the 50-day MA. Are both poised to break the 50-day MA? We do note that the AD line turned down in advance of the top in the S&P 500, a divergence.
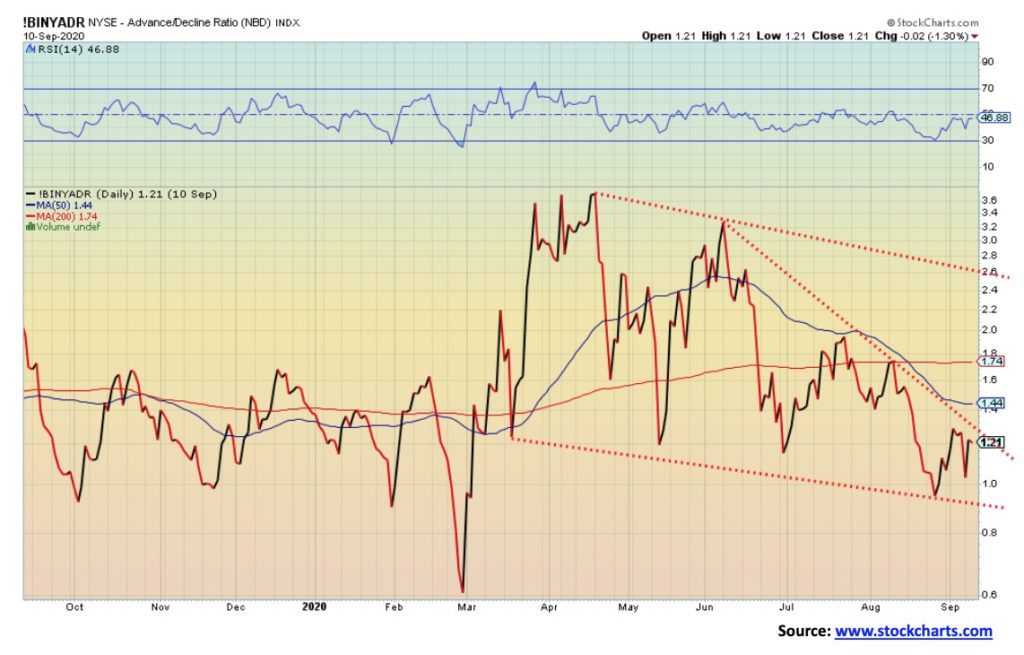
The NYSE advance-decline ratio is just another way of looking at the advance-decline line. Notice the ratio spiked in April but as the stock market moved higher into May to August the advance-decline ratio kept making lower highs suggesting the upside momentum was falling. No, it is not down at levels seen at the lows in March so we’ll be watching for that.
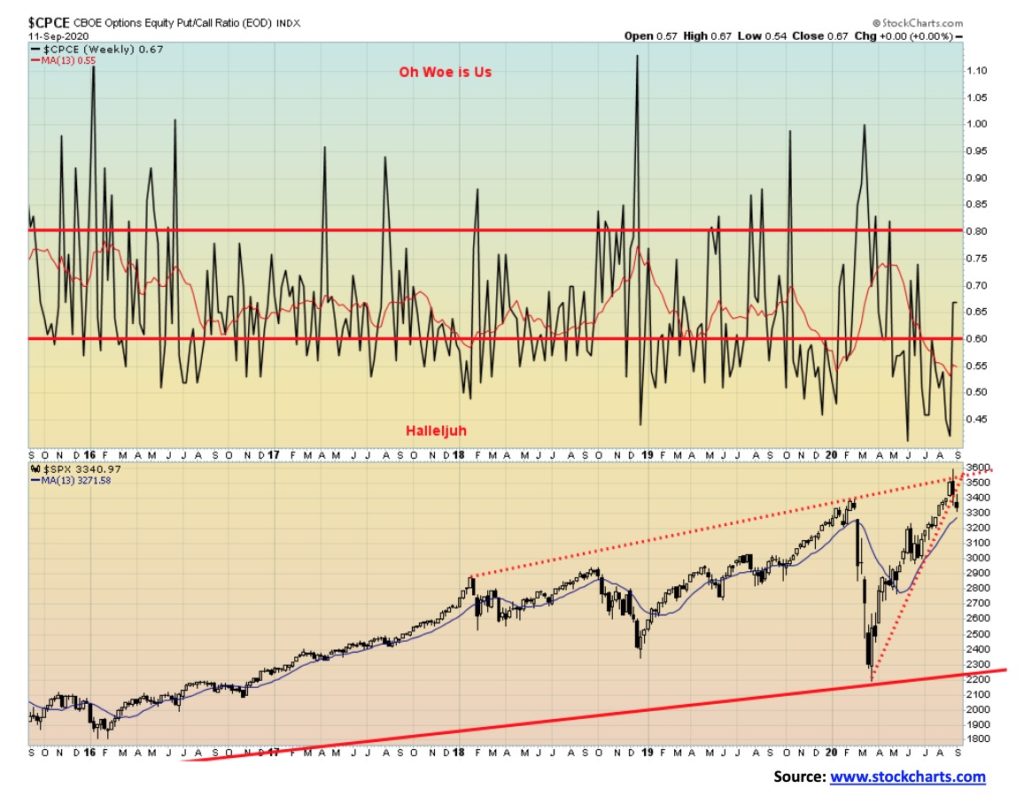
The put/call ratio has come up off its record low in favour of calls. No surprise given the recent decline in the market. But it is only up to a more neutral 0.67 now and not yet in extreme territory of puts hugely favoured over calls. Note the spike in favour of puts in December 2018 and again in March 2020. That is what we want to see in order to suggest that a low might be at hand.
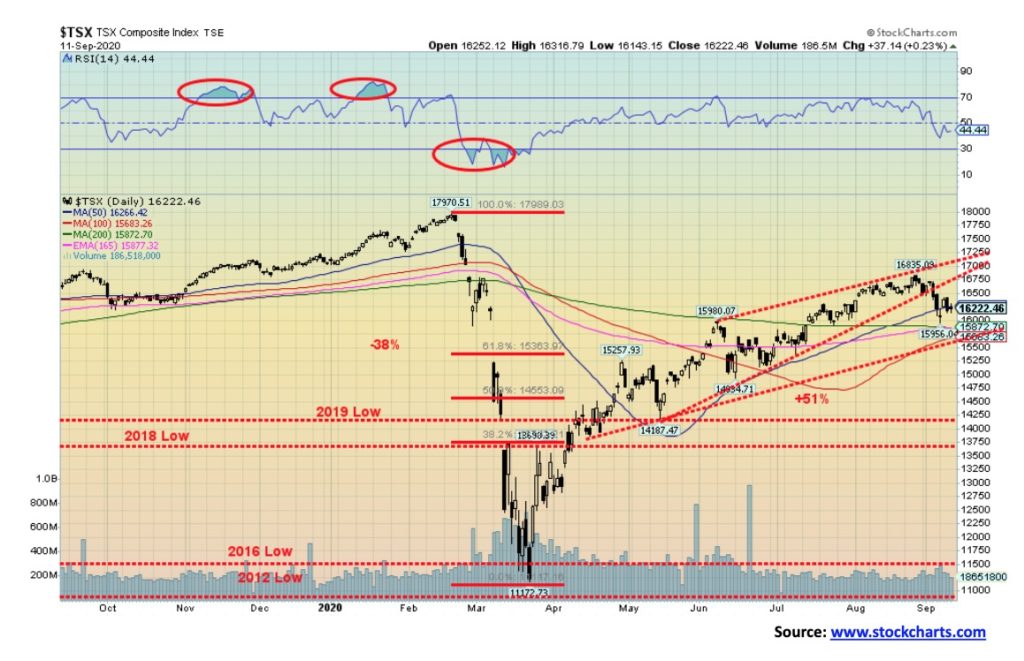
The TSX Composite was essentially flat this past week (small gain of 0.03%). So was the TSX Venture Exchange (CDNX) (small loss of 0.04%). We could have all gone to sleep and by week’s end nothing had changed. There was movement of course in individual sectors. Of the fourteen sub-sectors in the TSX eight were down and six were up. Actually, make that seven down, six up and one flat (Financials TFS was down only 0.4%). Leading the way to the downside was Energy (TEN) down a sharp 8.6%. The big winner on the week was Materials (TMT) and Consumer Staples (TCS) both up 2.7%. Golds (TGD) gained 2.1% while Information Technology (TKK) fell 2.1%. The TSX is clinging to the 50-day MA. It broke what appears to be an ascending wedge triangle. That suggests that the TSX should fall back to at least 15,000. However, breaking under 15,500 would be negative and suggest even further losses. The 200-day MA is at 15,870 and we tested that level this past week. Overall, the chart appears negative and we would not be surprised to see it fall under 15,000. Regaining 16,750 would be positive and suggest that new highs could lie ahead.
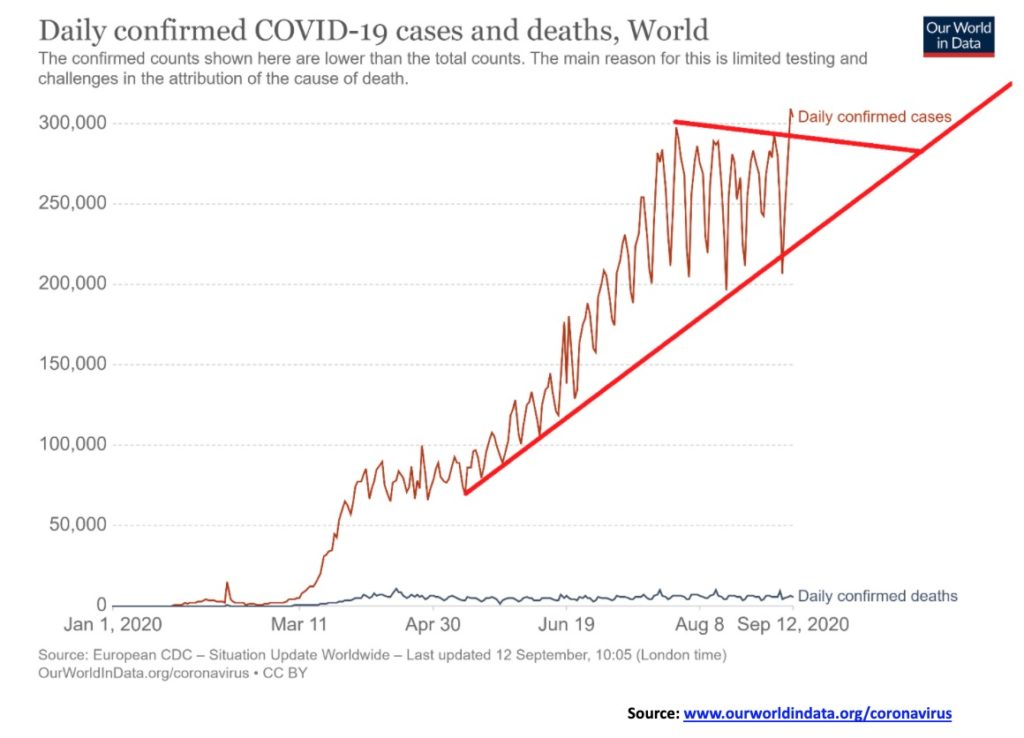
The number of COVID-19 cases is rising jumping over 300,000 in a day for the first time this past week. That bodes poorly going forward. But the big gains were seen in India that is threatening to have over 100,000 in a day. India has now leaped firmly into second place ahead of Brazil but remains upwards of 2 million behind the U.S. Deaths in India, however, have yet to crack above 100,000 making some wonder whether deaths are being underreported. India has a death/cases ratio of about 1.7% vs. the U.S.’s 3.0%. Globally the ratio is 3.2%. The common flu ratio kills less than 1% of cases. Globally the number of cases is now well over 28 million and deaths are over 900,000. The world still adds roughly a million cases every four days. But if the breakout above holds we could soon see 400,000 cases in a day and the number of cases would rise roughly a million every 3 days instead of every 4. Daily deaths remain somewhat steady at just over 5,000/daily. But could that rise as the number of cases rises? At the current rate the number of deaths would pass a million in about another two weeks. The world still seems to be on pace for 56 million cases by year end and about 1.5 million deaths.
World, September 13, 2020, 15:05 GMT
Cases: 29,018,702
Deaths: 925,619
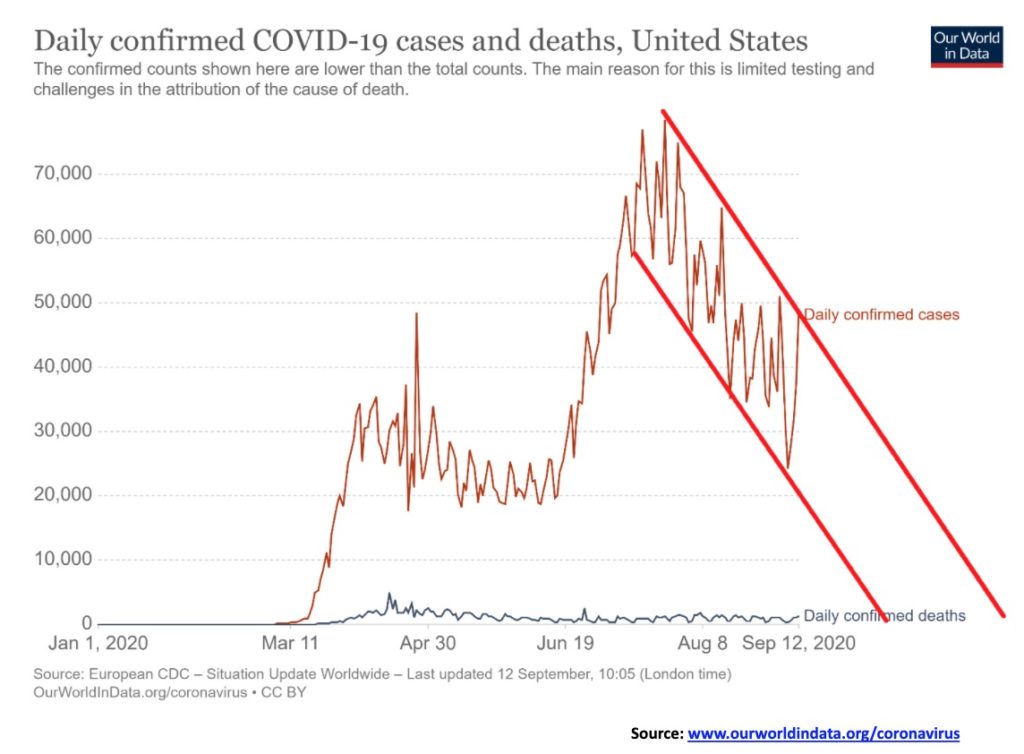
Are the number of cases in the U.S. threatening to break out to the upside? The U.S. cases have been in a well-defined downtrend but have now recently spiked again threatening to break the downtrend. In terms of deaths the U.S. is on pace for potentially 400,000 dead by year end. A spike in cases could be the start of the dreaded second wave and lead to potential shutdowns once again. That in turn could threaten the election and set-off a firestorm of protests and clashes. Texas, California and Florida remain the worst places to be for the COVID-19 while Vermont and Maine are the best places to be.
United States, September 13, 2020, 15:05 GMT
Cases: 6,683,805
Deaths: 198,179
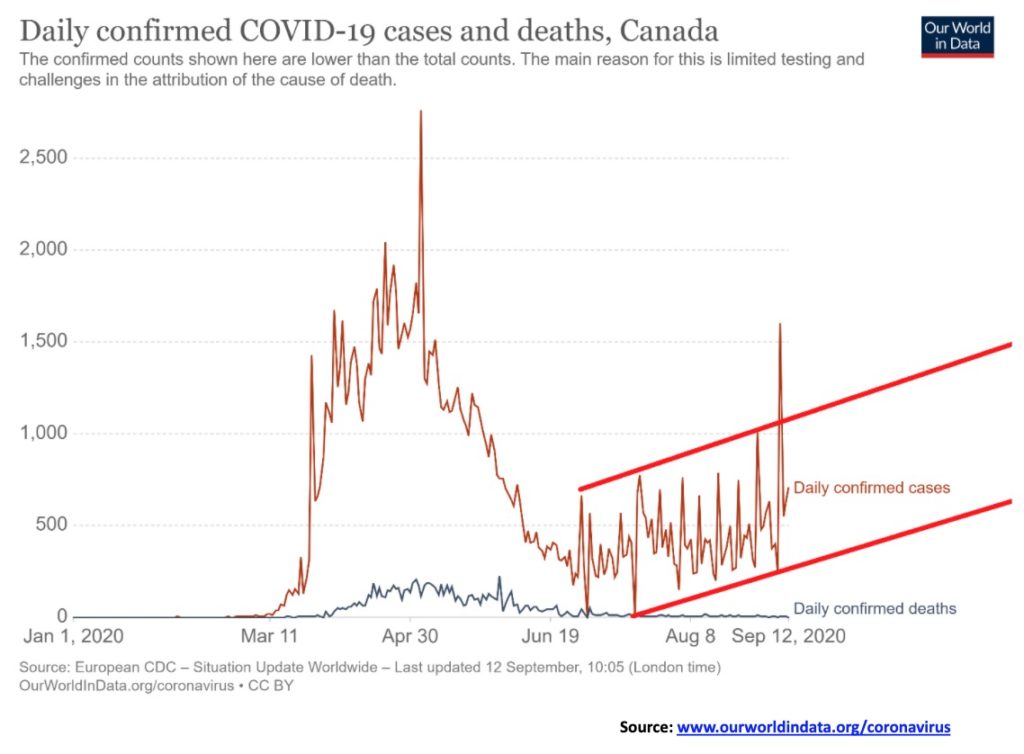
Canada continues to sit at number 26 in terms of cases but number 19 in terms of deaths. For whatever reason the Canada cases/deaths ratio is above average at about 6.8%. But cases are rising as seen in this graph and that is worrisome. Is it the dreaded second wave? Nonetheless after starting out high in terms of deaths the number of deaths has leveled off and fallen. So, while the average is 6.7% more recently it has been less than 1%. This was due to a very high number of deaths in March through to May when it began to peter off. Now Canada only gets 3 to 5 deaths daily but the number of cases has gone up over 600/day and recently had a spike over 1,000. The number of cases rising is worrisome but the number of deaths daily remains low.
Canada, September 13, 2020, 15:05 GMT
Cases: 136,345
Deaths: 9,171
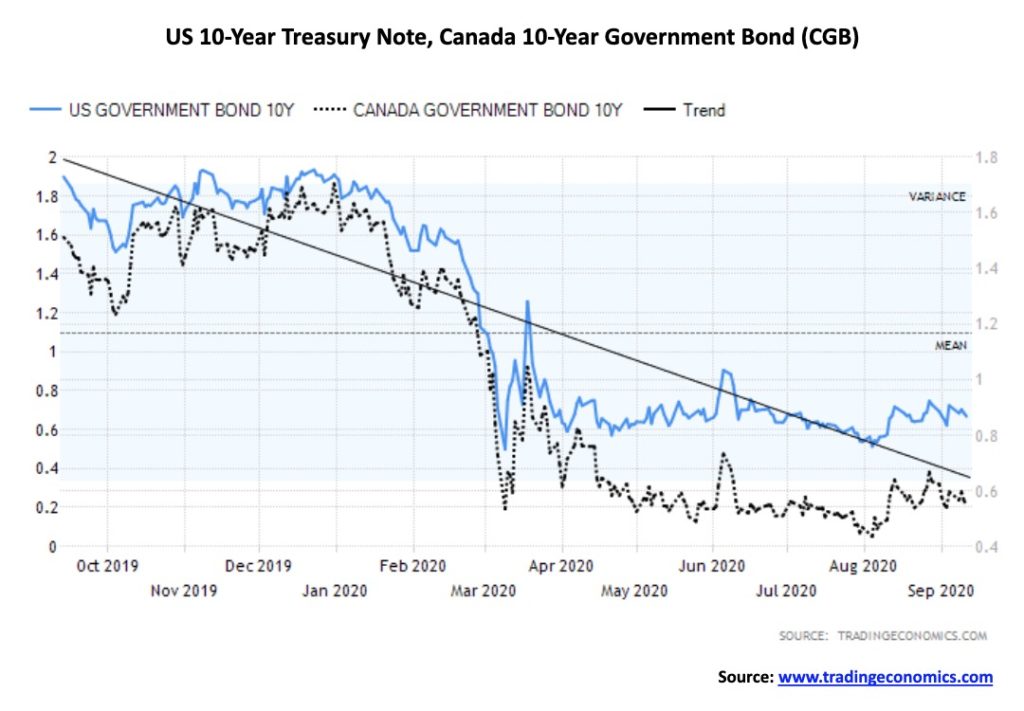
With the stock markets falling this past week it is no surprise to see that the bond yields fell. Same old, same old – stocks fall, bond yields fall (prices rise as prices move inversely to yields). Bonds are a safe haven. The 10-year U.S. treasury note slipped back to 0.70% from 0.72%, while the 10-year Government of Canada bond (CGB) dropped to 0.55% from 0.60%. Inflation as measured by the CPI came in at 1.3% year over year and the core CPI (ex food and energy) was at 1.7%. Both were above expectations as the market expected a rise of 1.2% for CPI and 1.6% for core CPI. Month over month CPI was up 0.4% as was the core CPI. Both were above expectations of 0.2% and 0.3% respectively. Weekly jobless claims were higher than expected at 884,000 unchanged from the previous week but higher than the expected 846,000. The bond market seemed to ignore the CPI and focused on the weak job numbers. Potentially helping the beleaguered job market was Jolts job openings came in at 6.6 million vs. an expectation of 6.0 million. This week watch for August industrial production and retail sales. Retail sales are expected to rise 1.0% in August while IP is expected to be up 1% as well.
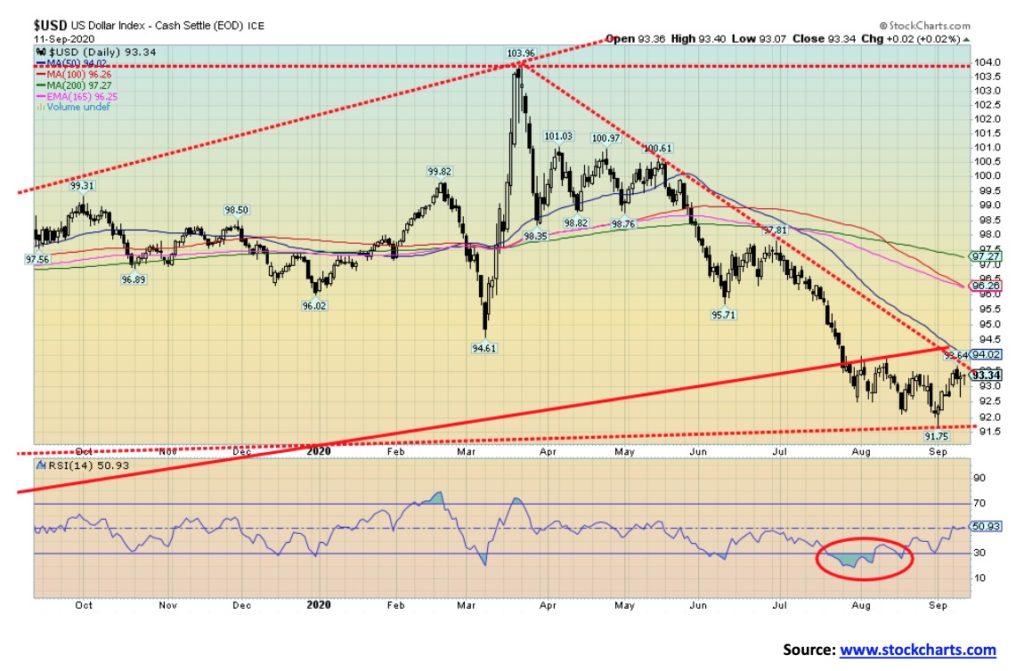
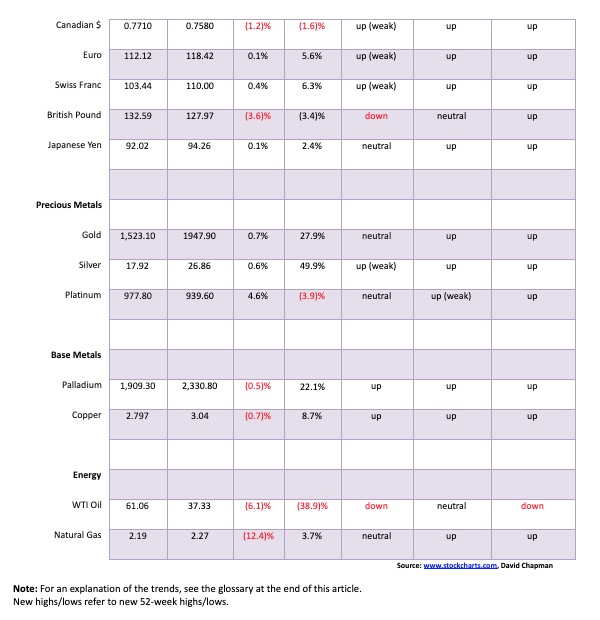
The US$ Index continues to trade in the 92.50/93.50 zone. This week it hit a high of 93.64 before pulling back to close at 93.34. The low on the week was at 92.68. The US$ Index gained 0.7% this past week. The euro was up just under 0.1%, the Swiss franc was up 0.4%. The pound sterling dropped 3.6% when it appeared that Brexit was on the rocks with PM Boris Johnson threatening to override the Brexit deal with the EU and potentially breaking international law. He was soon seeing opposition from members of his own party including former PM Elizabeth May. All of it was too much for pound. The Japanese yen gained 0.1% while the Cdn$ fell 1.2% as oil prices fell. The US$ Index continues to make what appears to be at least a temporary low. The plunge to 91.75 failed to be the breakdown that some thought it might be. This leaves the US$ Index potentially open to further gains to the upside. A break above 94 and especially above 94.25 could soon target up to 96. It is possible that the US$ Index could be in the process of forming a head and shoulders bottom pattern. The pattern as it stands now is not quite complete as more work would be required on the right shoulder. A head and shoulders pattern could form as long as the US$ index holds above 92.14. A break under that level and especially under 92 would negate the pattern and new lows should then lie ahead. The US$ Index could suffer as there are signs that the COVID-19 is rising and that could threaten any nascent recovery in the U.S. There is also uncertainty about the upcoming election especially given the divisiveness that surrounds it.
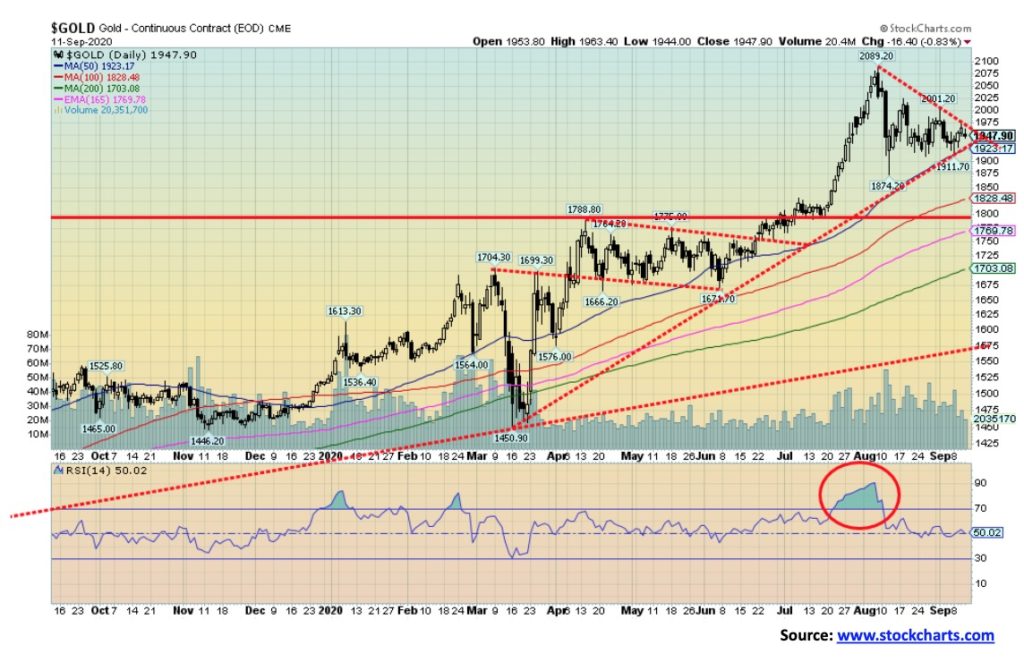
Gold continued to form what appears to be a symmetrical triangle. Symmetrical triangles can be consolidation patterns (usually) but they can also be topping patterns. This does not have the look of top pattern so our expectation is that gold should eventually break to the upside. The breakout point is nearby at $1,975 but we prefer to wait until we break over $2,000 to feel more confident that we are starting our next wave to the upside. A break over $2040 would confirm the rise and odds are than high that we would see new highs over $2,090. Potential targets are up to $2,190/$2,200. In the event we are wrong and the market instead breaks to the downside the break point is at $1,925 with a confirmation on break back under $1,900. Targets could then be down to $1,700. We note that the 200-day MA is currently at $1,703 and a test of the 200-day MA is not unusual in a bull market. A breakdown under $1,675 would be quite bearish and imply we are entering a bear market. While the talk on gold continues to be positive, we note that gold remains under owned. We even see articles saying to ignore the hype on gold. Gold tends to attract a lot of hyped articles. Nonetheless gold has an important role in portfolio management due to its non-correlation characteristics with stocks and bonds. Gold also becomes a safe haven when confidence in the government wanes and the debt burden continues to grow. With an RSI of 50 right now gold is perfectly neutral. But the triangle appears to indicate that gold should make a move either up or down shortly. And the break points are now defined. Of course, it could also end in a waffle through the triangle and then we would have to await further trading to determine what the new triangle looks like.
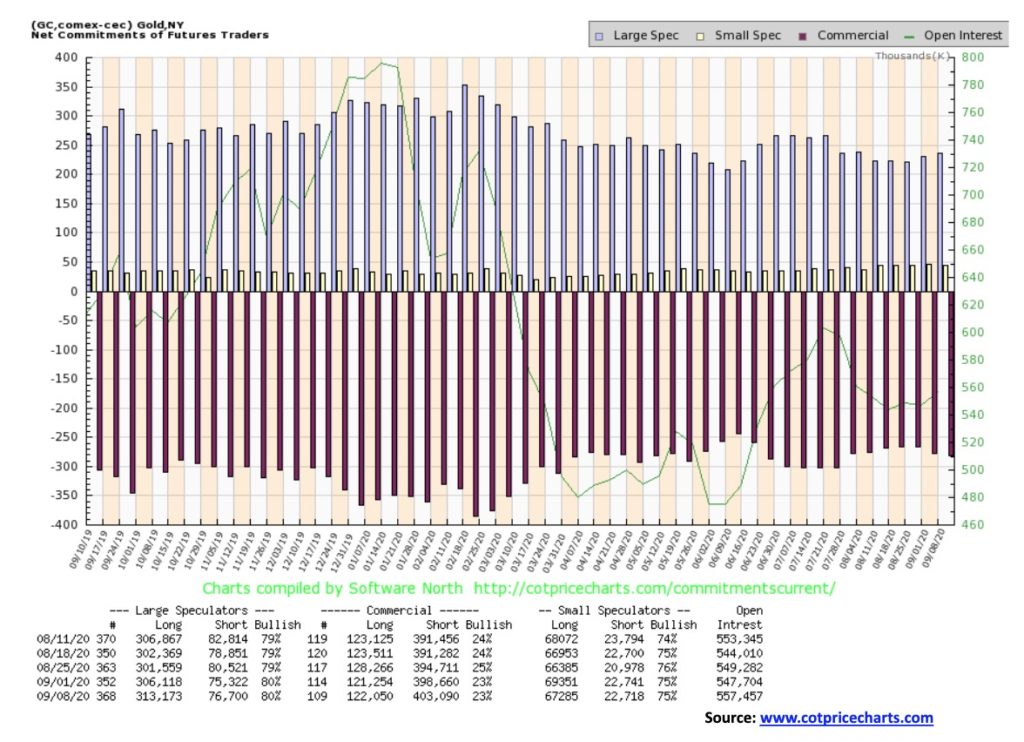
The commercial COT for gold was unchanged this past week at 23%. There was a small less than 1,000 contract rise for long open interest while there was a larger roughly 4,500 contracts rise for short open interest. That is slightly bearish despite the overall level remaining at 23%. The large speculators COT (hedge funds, managed futures etc.) was also unchanged at 80%. However, here the large speculators got more bullish with a rise of almost 7,000 contracts for long open interest. Offsetting it a bit was a rise of over 4,000 contracts for short open interest. Overall open interest rose about 10,000 contracts so on a week that gold did make gains that is mildly bullish.
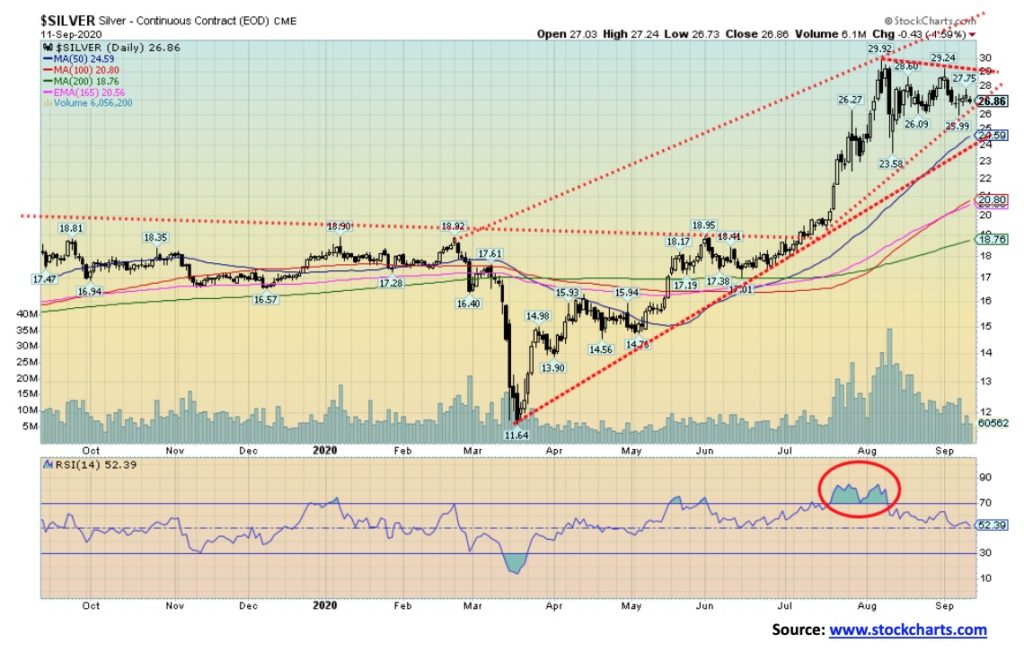
Silver appears to be forming a symmetrical triangle with a possible ABCDE type of pattern. The A wave was the plunge to $23.58. That zone now becomes important as we do not want to see that level breached on further pullback. If it breaks the symmetrical triangle was forming a top not a consolidation pattern. Targets could be down to $19.50/$20.00. The June lows are now important as well as we do not want those levels breached otherwise the drop for silver will be more prolonged and deeper. The June low is near $17. A breakout above $29 would be quite positive and potentially target up to $35 which fits with our longer-term target for silver. We remain optimistic that we are seeing a consolidation pattern forming and not a top pattern. But we don’t want to ignore the downside potential at the expense of being overly optimistic on the upside. A break under $24 would signal a deeper drop.
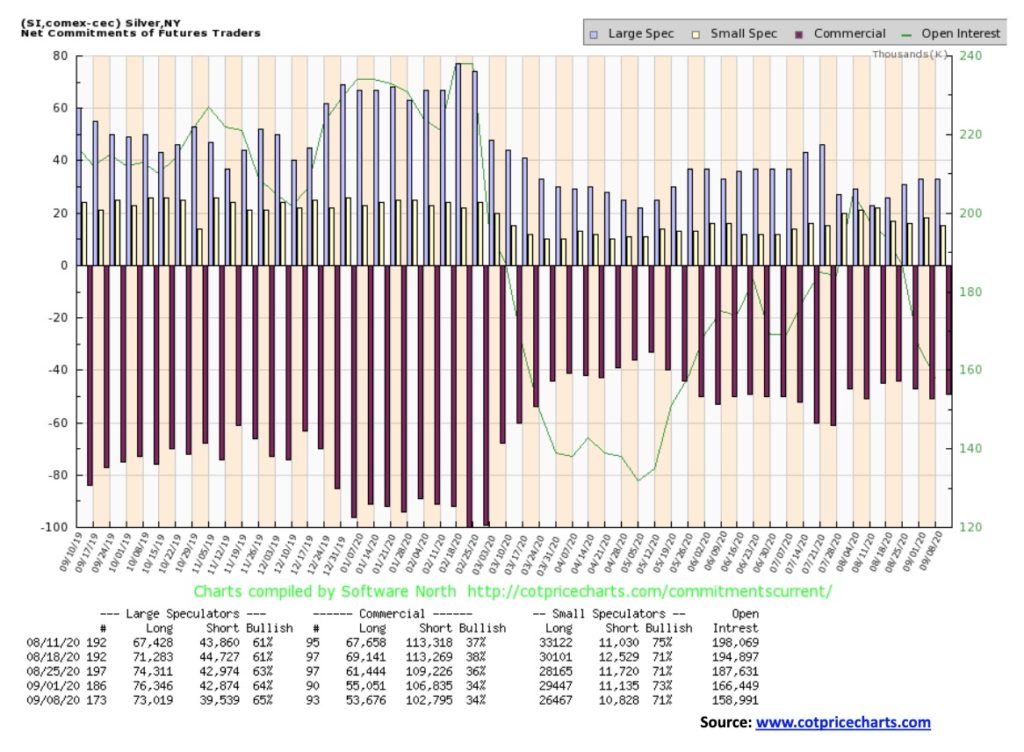
The silver commercial COT was unchanged this past week at 34%. There was a drop of about 1,500 contracts for long open interest and short open interest also fell roughly 4,000 contracts. Overall open interest was down almost 8,000 contracts on a week that silver made only marginal gains. It demonstrates that the market right now is weak. The large speculators COT rose marginally to 65% from 64% but it too was made on falling open interest.
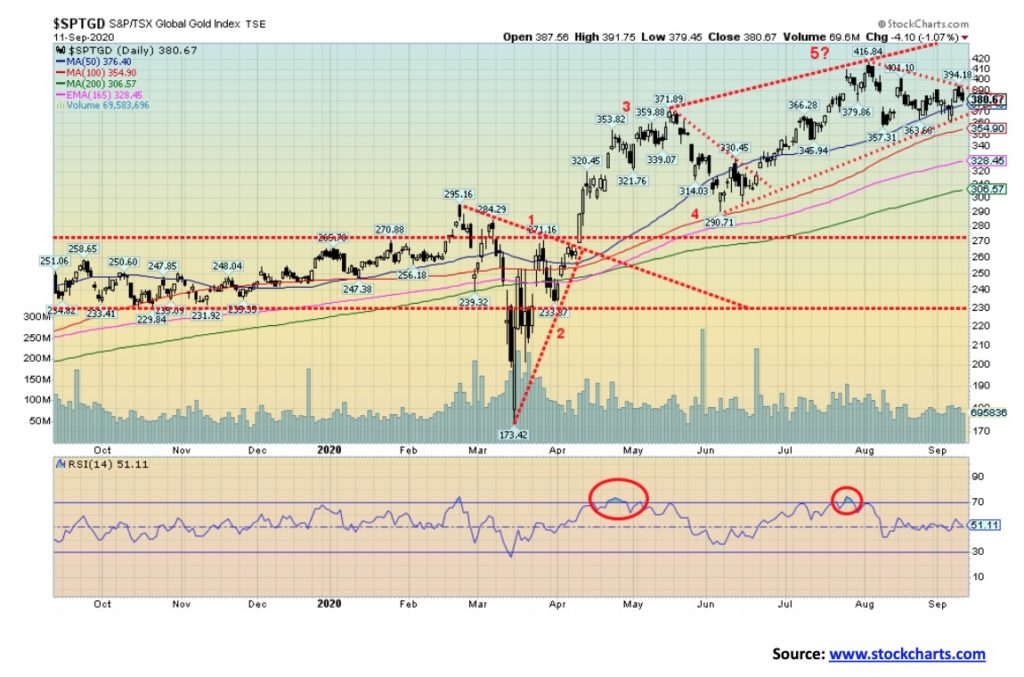
Thanks to gains in the early part of the week the gold stocks managed to hang on and put in a positive week. The TSX Gold Index (TGD) gained 2.2% on the week while the Gold Bugs Index (HUI) was up a more modest 0.5%. Our sentiment indicator, the Gold Miners Bullish Percent Index (BPGDM) was at 79 still fairly bullish but not as bullish as it was earlier. We wouldn’t object to it falling to around 50 to further ease the bullish expectations. In March at the lows the BPGDM fell to 8 but it recently topped out at an extreme 100. The TGD has support down to 370 but below that level a decline towards 350 is probable. In an extreme the TGD could test the 200-day MA currently near 305/310. That is not impossible if the correction deepens. In March during the mini-crash the TGD crashed through the 200-day MA but just as quickly rebounded. The gold stocks have been top performers in 2020 and there are numerous examples of doubles triples etc. especially in the junior gold miners and junior gold mining explorers. Despite the gains the sector remains largely unloved and under owned. The TGD could break out over 390 and that could target up to 475 once new highs are seen above 417. The June low was seen down at 290 so that level is extremely important because a break under that would signal a more serious bear market is underway. So far, the 50-day MA is holding (376) but a break to the 100-day MA (354) would not be out of the question.
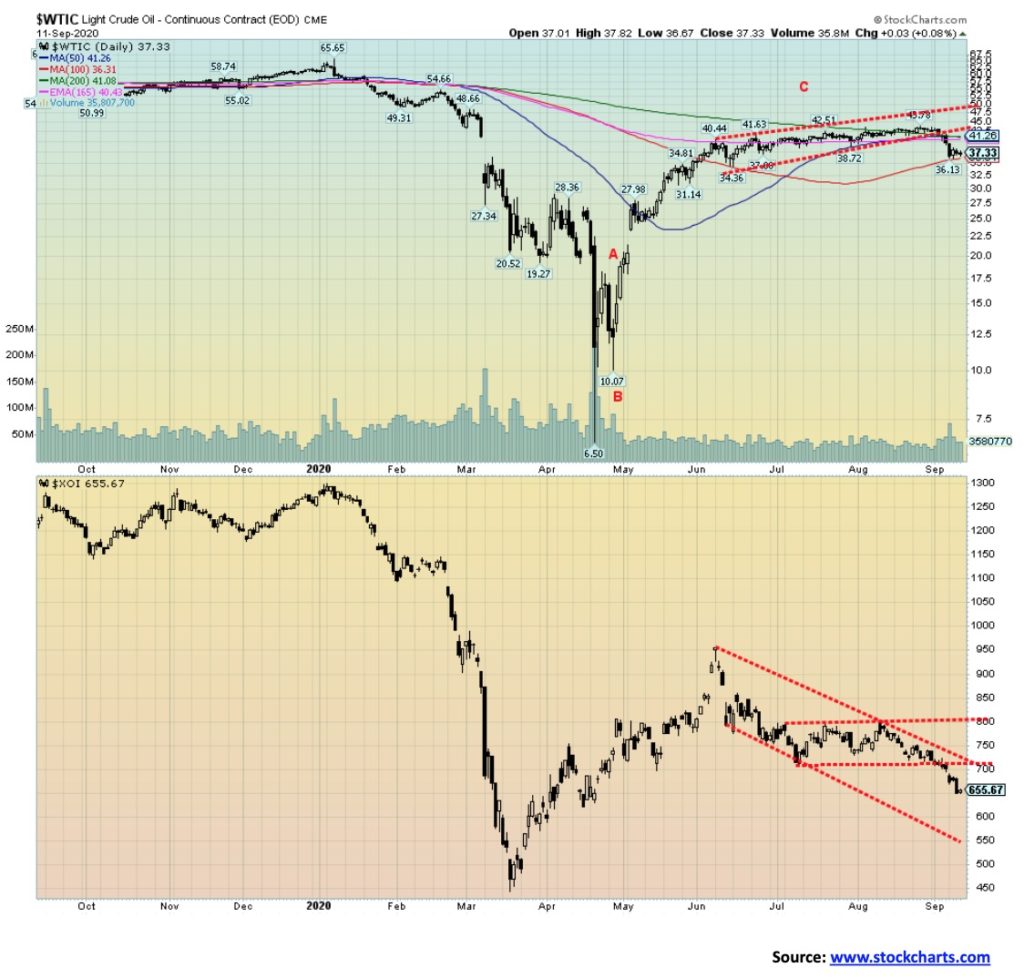
A slight bounce back in oil prices at the end of the week was insufficient to drag WTI oil from a loses seen earlier. On the week WTI oil fell 6.1%. Natural gas (NG) felt pain as well given it came down off of its recent rally getting hammered back 12.4%. This in turn weighed on the energy stocks as the ARCA Oil & Gas Index (XOI) dropped 6.6% while the TSX Energy Index (TEN) was pummeled down 8.6%. The XOI is now down 48.4% on the year while the TEN is down 51.4%. Energy stocks are a very dangerous place to be. Yes, the seasonals are negative so that’s not helping things but threats of a resurging COVID-19 are also weighing on the sector as demand remains exceptionally weak. Demand has fallen in India in particular and it is expected that India demand will fall in 2020 for the first time in decades. As a result, sentiment is terrible. While extreme negative sentiment can be a sign of a possible bottom this time the negative sentiment is fully justified. Analysts believe it could take three years for demand to recover and that is assuming a vaccine or cure is found.
All of this has put OPEC into a bind as they were trying to ramp up production only to discover that they may have to cut once again. And as if things were bad enough Exxon (XOM) suffered the humiliation of being removed from the DJI. Exxon had been in the DJI since 1928 and was the longest serving component. Exxon was also once the world’s largest company with a market cap over $500 billion. Now it is a shadow of its former self with a market cap last at $156 billion. XOM was replaced by a software stock – Salesforce (CRM).
WTI oil is on the verge of breaking down further. For the moment it appears to have found support at the 100 Day MA. But that could change quickly. WTI oil has to rebound here because if it breaks down under $36 the next good stop might not be until it reaches $25. There is likely interim support at around $30/$32. The XOI is breaking down further and appears headed for the bottom of the channel near 550. This is likely to be a third wave or C wave down and it could take the XOI down to new lows below the March 2020 low of 443. The TEN has support down near 60 (currently about 71). The TEN’s March low was at 39. There is little joy in Oil-Ville and it is unlikely to come back any time soon. WTI oil would need to regain above $41 to bring some semblance of recovery potential.
—
(Featured image by Pixabay via Pexels)
DISCLAIMER: This article was written by a third party contributor and does not reflect the opinion of Born2Invest, its management, staff or its associates. Please review our disclaimer for more information.
This article may include forward-looking statements. These forward-looking statements generally are identified by the words “believe,” “project,” “estimate,” “become,” “plan,” “will,” and similar expressions. These forward-looking statements involve known and unknown risks as well as uncertainties, including those discussed in the following cautionary statements and elsewhere in this article and on this site. Although the Company may believe that its expectations are based on reasonable assumptions, the actual results that the Company may achieve may differ materially from any forward-looking statements, which reflect the opinions of the management of the Company only as of the date hereof. Additionally, please make sure to read these important disclosures.


The TopRanked.io Guide to 2026’s Biggest and Best Affiliate Opportunities
Want to earn affiliate commissions on literal billions of dollars worth of revenue? Then this week, we've got something special...


Eni Advances Energy Transition with Major Investment and Emissions Cuts
Eni showcased its “Just Transition” report in Rome, highlighting stakeholder collaboration and progress toward decarbonization goals. The company invested over...


The German Fintech Market Shows Resilience and Strong Investment Growth in 2026
Germany’s fintech sector remained resilient in 2026 despite economic crisis and rising insolvencies. Investments reached €14.2 billion, showing strong investor...


Cannabis Legalization in Germany: A Mixed Interim Assessment
Germany’s cannabis legalization has reduced criminal cases and eased pressure on the justice system, while the black market is slowly...


Sustainable Restoration of the Haus Hövener Garden in Brilon
The Brilon Construction Workers Association is restoring the Haus Hövener garden into a cultural community space, funded through a €10,000...
 |
|
 |  |
 |
|
-

 Biotech1 week ago
Early Use of Tirzepatide Shows Strong Results in Type 2 Diabetes Study
-

 Africa6 days ago
Morocco at an Energy Crossroads Amid Global Gas Volatility and Critical Minerals Opportunity
-

 Impact Investing2 weeks ago
Italy Advances Recycling but Infrastructure Gaps Threaten EU Targets
-

 Biotech3 days ago
EFPIA Warns Limited SPC Reform Could Weaken EU Pharma Competitiveness