Featured
Dow Jones remains unchanged; Gold bearish
Dow Jones advanced only 0.04 percent on last week’s close while gold continues to see an overwhelming number of declining days.

I had some personal matters to attend to this week; that plus nothing much had happened this week in the markets to write about, so this article will be shorter than usual.
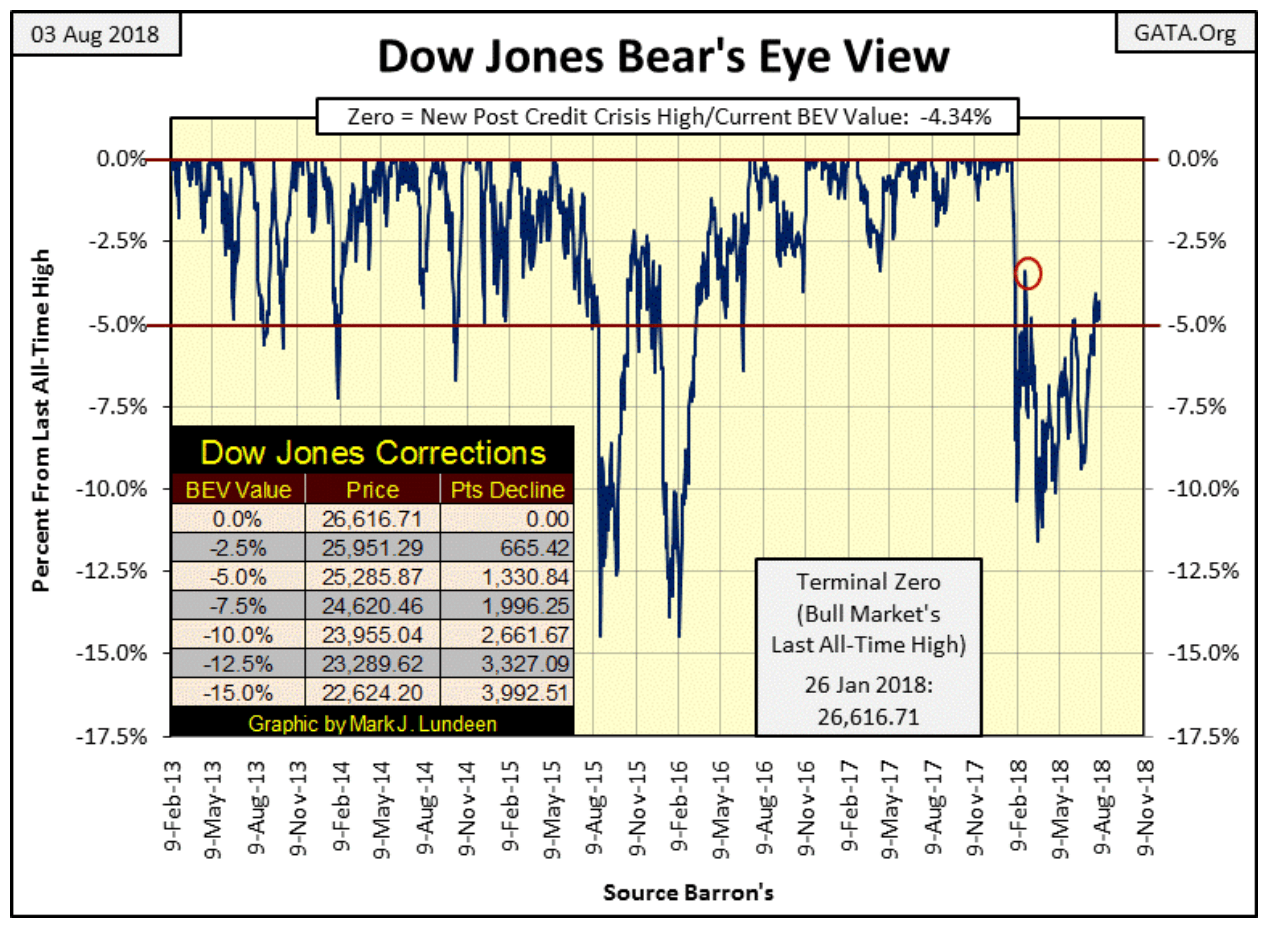
The Dow Jones advanced 0.04 percent (up 11.52 points) from last Friday, basically unchanged for the week.
© Mark Lundeen
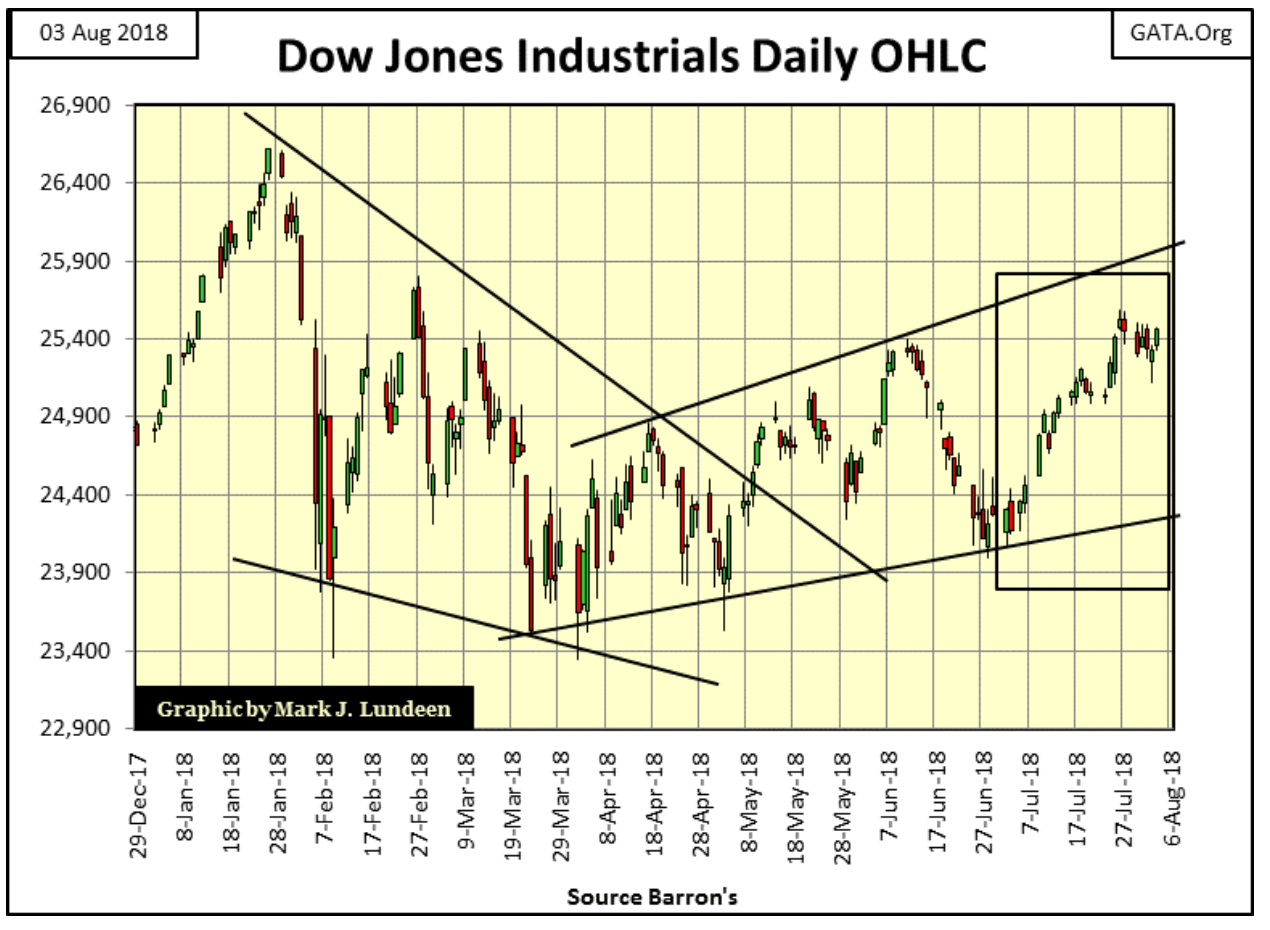
As seen in the box below containing the past five weeks of NYSE trading sessions, the Dow Jones decided to take a rest in its first week of August.
© Mark Lundeen
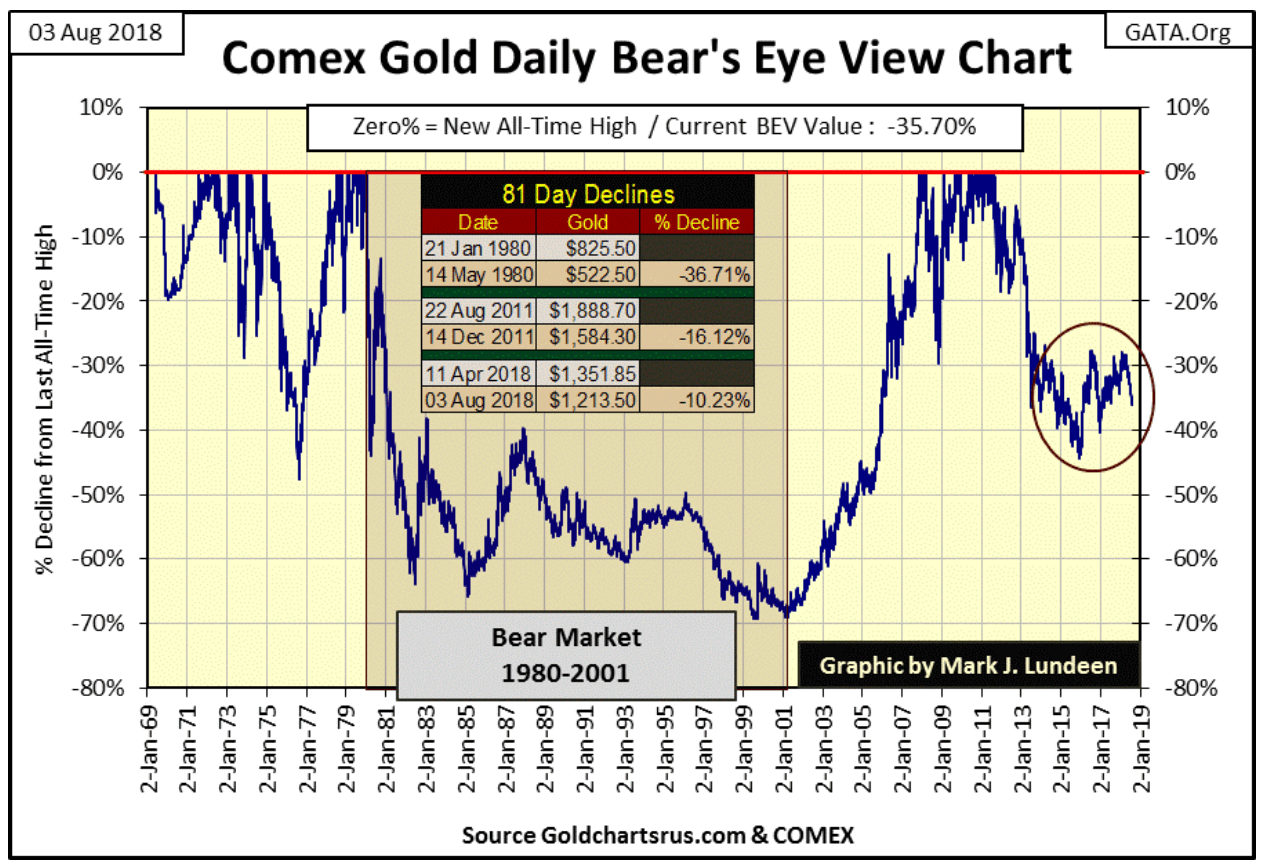
Moving on to gold, the “policymakers” continue applying Fud’s Law to the old monetary metals; where if you push hard enough, it will fall down. But Fud’s Law doesn’t quantify how far the something (in this case the price of gold) will fall down if you push hard enough. So I inserted a table in gold’s BEV chart below providing the details of gold’s decline 81 COMEX trading sessions after the tops in:
- January 1982
- August 2011
And our current decline, which predictably began 81 trading days ago on April 11th. As seen in the table below, 81 days after April 11 (today), gold has fallen 10.23 percent, which from a gold bull’s perspective is better than the declines seen in 2011 or 1980.
Does that make any difference? I think it does! Big declines in any bear market occur when a market is at its most extreme overvaluation—just after the bull market’s last all-time high. By May 1980, the price of gold collapsed by 36.71 percent in the first 81 trading days of the 1980-1999 bear market.
And as seen in the Bear’s Eye View (BEV) below, the price of gold had much more to go down in the next two decades. Now, compare gold’s BEV plot from 2011 to today (seven years) with gold’s BEV plot from 1980 to 1987. In the 1980s, the bears beat the hell out of the bulls in the gold market.
© Mark Lundeen
You can be sure the bears (the big banks and “market regulators”) would love to do that again—so why don’t they? Obviously, because they can’t.
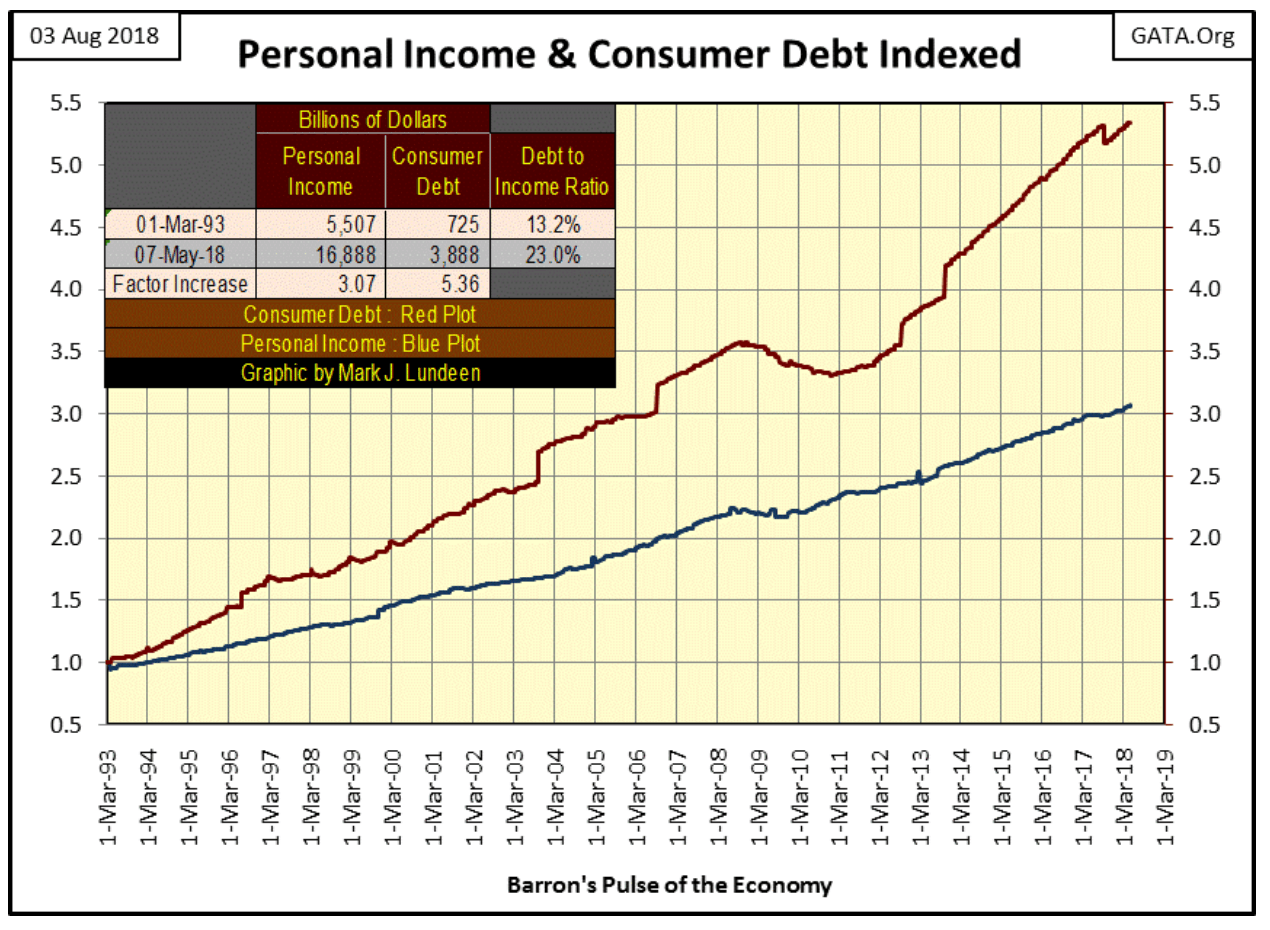
Unlike the economy of the 1980s, balance sheets today in the 21st century for government, corporations and individuals are very fragile; most carrying massive levels of debt taken on during a prolonged period of artificially low interest rates. Rising interest rates and bond yields are a burning fuse to a debt bomb the FOMC has installed in the American economy.
As illustrated below, consumer debt (Red Plot) is rising faster than consumer income (Blue Plot) for the past three decades. I don’t have the data to chart, but I suspect the same is true for corporations and government at all levels. This debt at current rates apparently isn’t a problem. But should rates double from today’s rates, will the same be true?
© Mark Lundeen
And then there are the OTC interest-rate derivatives currently held by the banking system. Rising rates at some point will cross a currently unknown threshold, converting these derivatives into first tens, then hundreds of trillions of dollars in liabilities to these banks—trillions of dollars these banks don’t have and can’t raise.
The mainstream financial media chooses not to cover these topics. But this lapse in their reporting doesn’t change the fact that potential counterparty risks in today’s financial system are titanic. This greatly limits the ability of the “policy makers” to bush-whack the gold market, because to people-of-means and financial institutions such as, but not limited to, central banks who have taken the time to investigate the current situation in the global economy and markets, find gold and silver, assets with zero counterparty risks are very attractive.
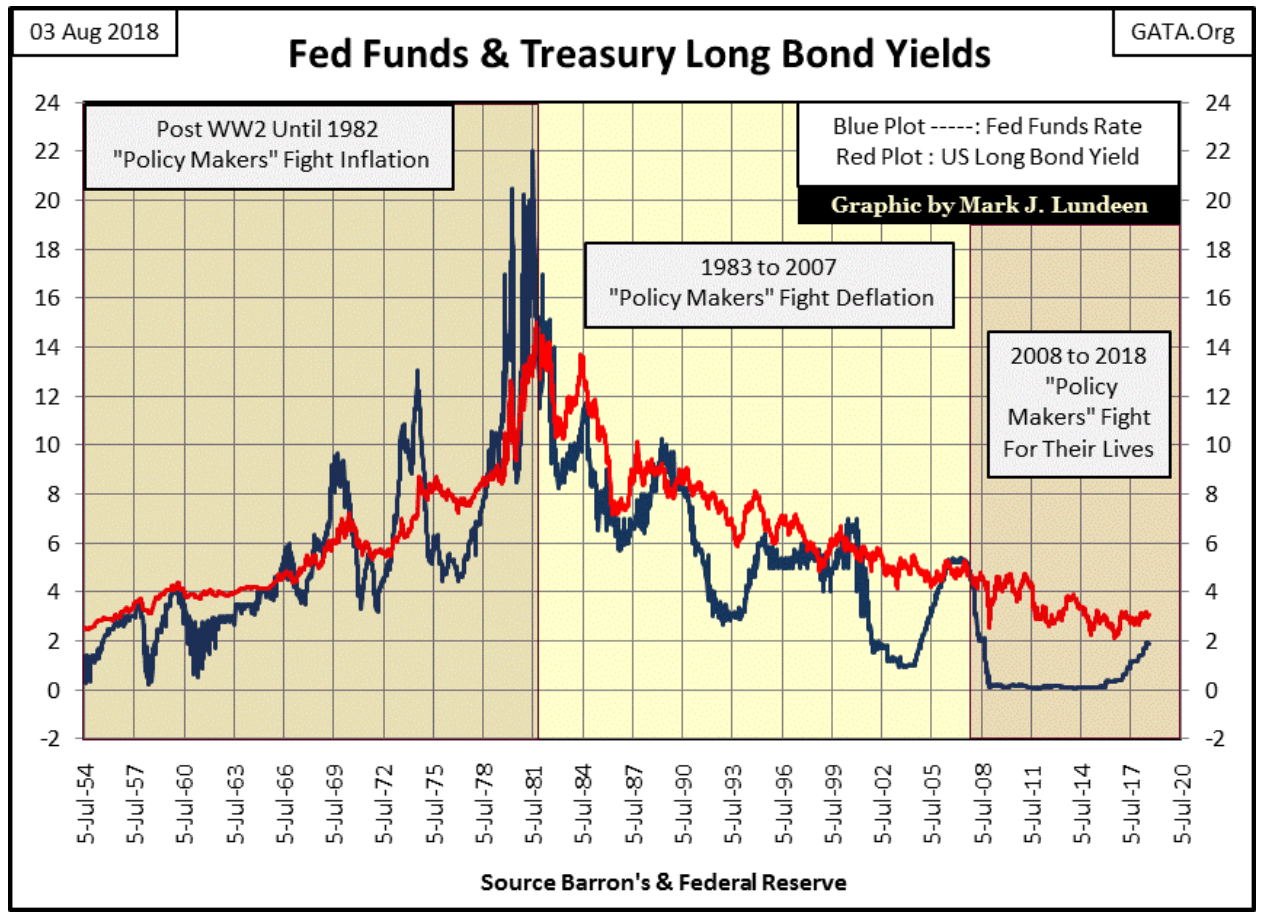
Look at the U.S. long bond yields and Fed Funds Rate from 1954 to today below. Interest rates had been increasing since the end of WW2 until they peaked in October 1981. In 1981 long T-bond yields (Red Plot) peaked at over 15 percent and Fed Funds (Blue Plot) at over 22 percent. Painful no doubt, but four decades ago the world continued to turn in spite of these double-digit rates as most people, businesses and government at all levels continued working and paying their bills.
Unlike the subprime mortgage crisis of 2007-09, the 1970s and 1980s with their double-digit rates saw no waves of debt defaults rippling through their markets or economy. Double-digit rates and yields never threatened a total seizure in the operations of the global banking system, as we all witnessed just a decade ago. The difference between then and now is the debt load relative to income on individuals, corporate and governmental balance sheets.
As the end of the second decade of the 21st century approaches, due to the massive increase in debt loading on personal and corporate balance sheets, a resumption of rates and yields seen in the late 1990s in the chart below (6 percent to 7.5 percent) could result in the financial collapse of the global economy, resulting in gold and silver prices that today are simply not believable.
© Mark Lundeen
Which brings us to the 1999-2011 gold market advance’s Terminal Zero (TZ of August 2011); gold’s last all-time high of the advance (three charts up). We should note how from August–December 2011, gold had declined by only 16.12 percent in the first 81 trading days of our current market decline, less than half of the decline that gold saw in 1980.
And now to our current decline, where the “policymakers’” application of Fud’s Law achieved them only a 10.23 percent decline in the price of gold after 81 days of pushing hard enough to make it fall.
Conclusions:
- At no time since the 1999 start of our current bull market in gold has its valuation become as extreme as it was at its January 1980 top.
- Though the policymakers may dictate the price of gold must fall down, and though they have the means (COMEX futures contracts) to push hard enough to make the price of gold fall down, economic reality can thwart the full impact of their market machinations.
In other words: in the summer of 2018, Fud’s Law is coming into conflict with the Law of Diminishing Returns. That plus a growing awareness of the pending tsunami in counterparty failure in our not so distant future is supporting valuations in the gold and silver markets even as the “policymakers” do their worst at the COMEX.
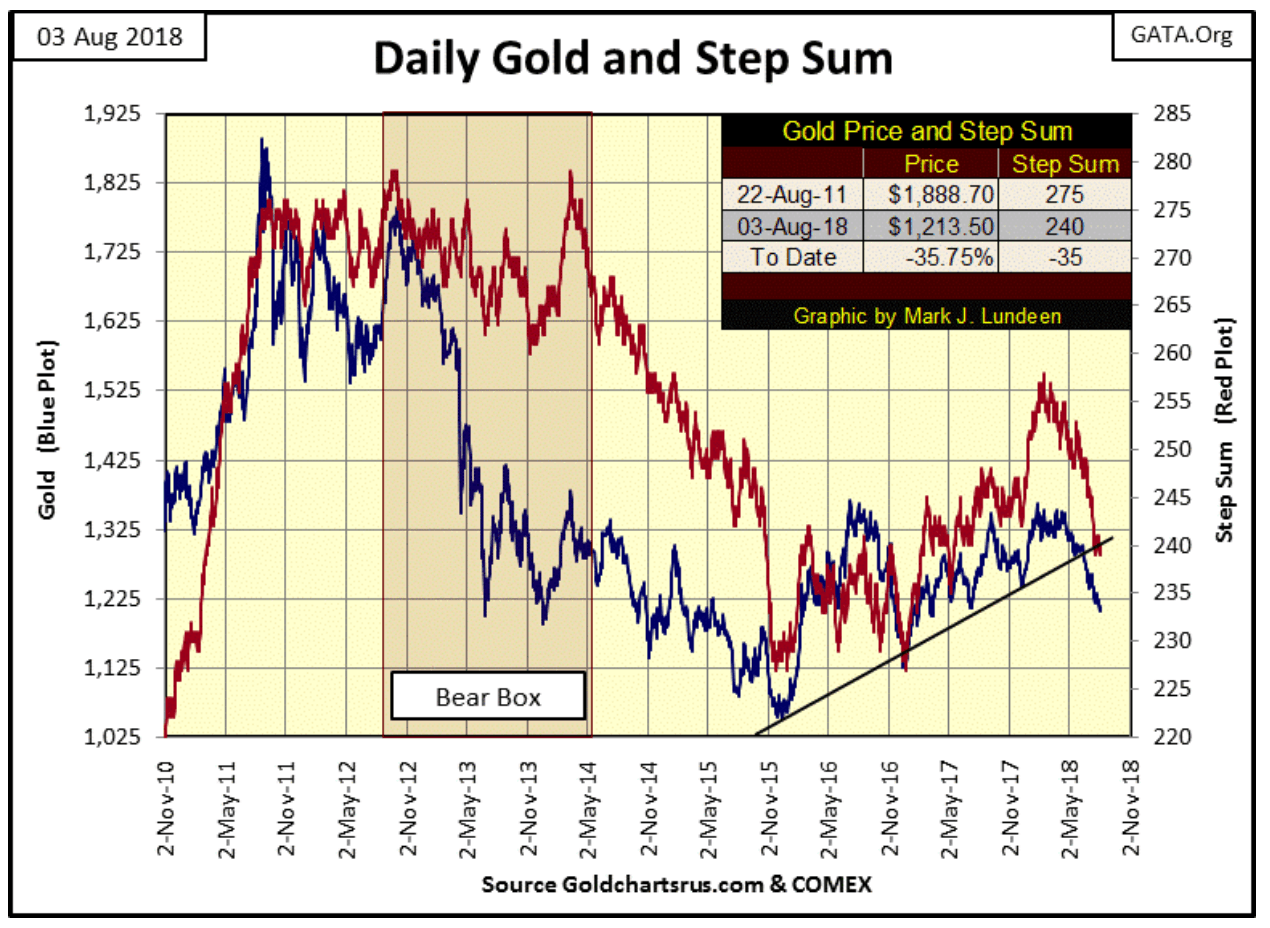
Moving on to gold’s step sum chart below, we should keep in mind that the step sum is a single item A-D line using the daily advances and declines of the market itself. Also, there are times when a step sum decouples from the market’s price trend. There are also times where a huge increase in a step sum (preponderance of advancing days over decliners) achieves little in advancing the valuation of a market, and vice versa for a big decrease in a market’s step sum effects on a market’s declining price.
Looking at the gold’s markets step sum and price plots below, since April 2018, the gold market has seen an overwhelming number of declining days without a corresponding decline in the price of gold. Is this a graphical display illustrating where Fud’s Law is coming in conflict with the Law of Diminishing Returns in the gold market? It could very well be.
© Mark Lundeen
What that will mean for gold in the weeks and months to come I don’t know. However, should the stock and bond markets come under pressure, the price of gold could see a sharp spike in valuation as dollars flee from deflating-overvalued financial assets towards undervalued gold and silver. The big shorts in the gold and silver markets (the big NY banks) would be extremely vulnerable in such a situation which would make the price spike even more extreme as they close out their short positions under duress.
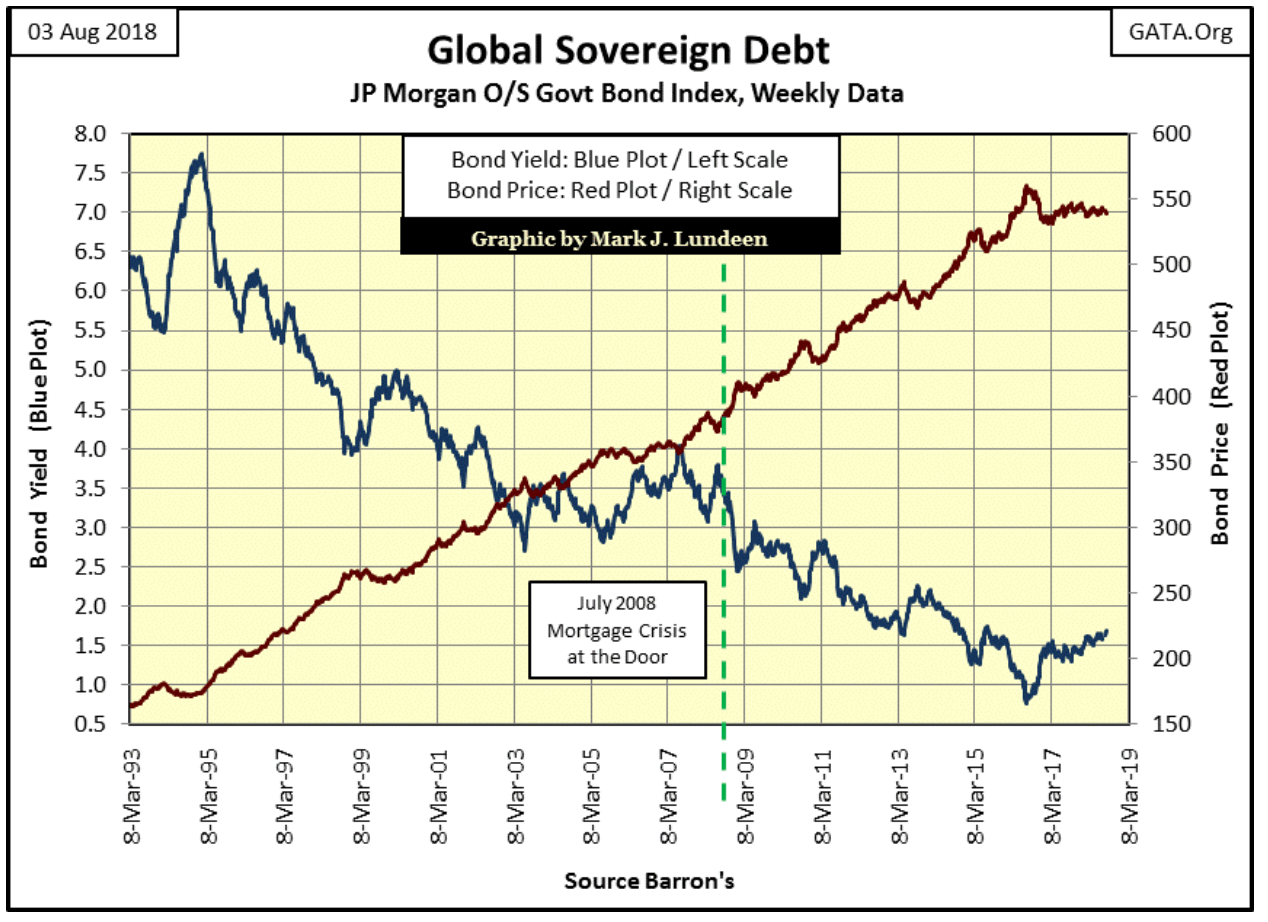
Are we going to see the financial market experience a dose of deflation sometime in the short-term future? I can’t rule it out. Below we see how yields for government bonds (Blue Plot / Left Scale) on a global basis have been increasing since July 2016. Why is this important? Because rising yields equal deflating bond prices.
© Mark Lundeen
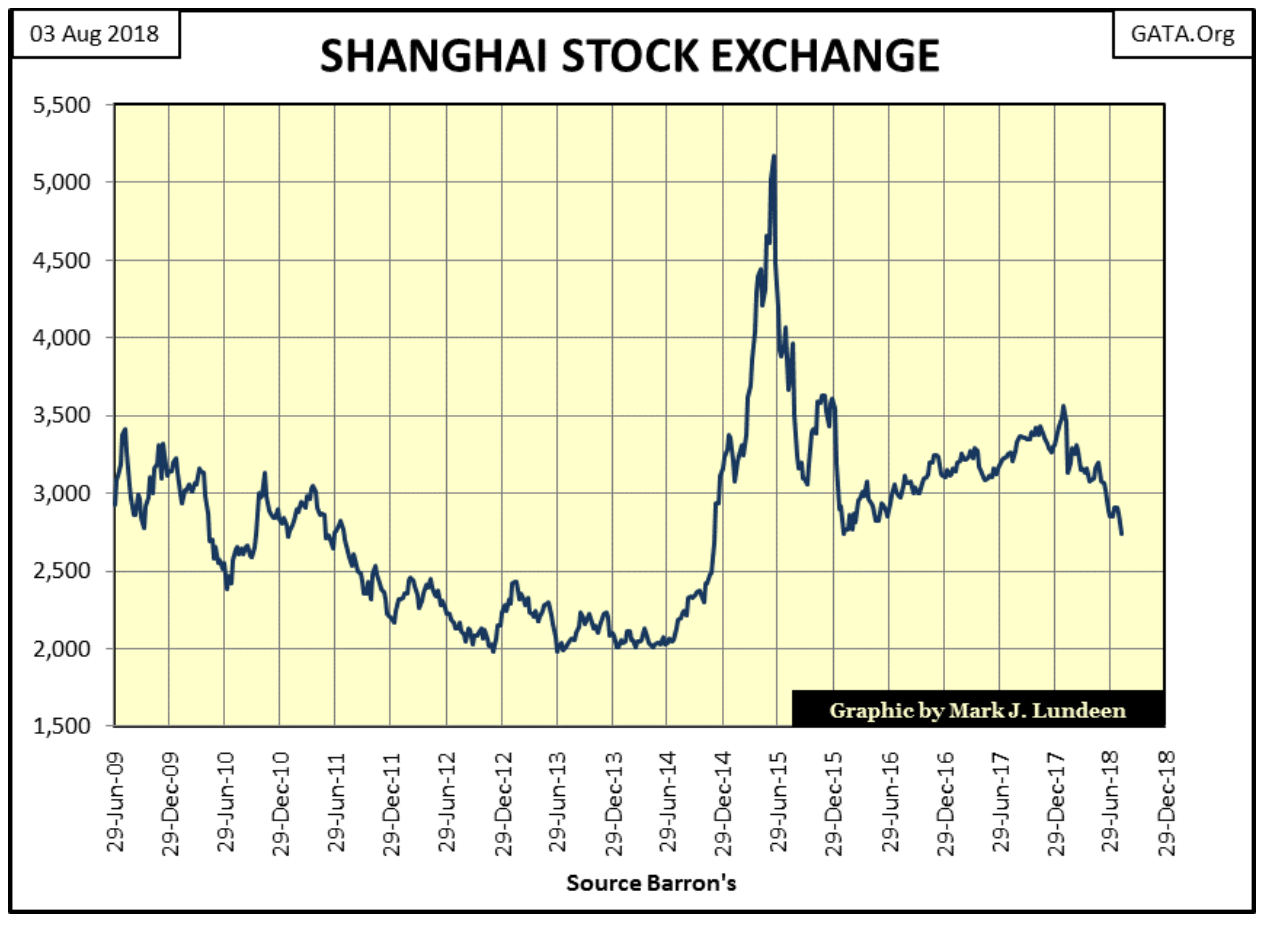
Below we see the 2014-16 boom/bust in the Chinese stock market. The recovery from its January 2016 bottom is increasingly looking like a dead-cat bounce as the Shanghai Index is now breaking below its lows of January 2016. China’s economy is heavily loaded down with debt. Chinese real-estate is inflated to bubble valuations. The world’s second-largest economy is ripe for a dose of Mr. Bear’s deflation.
© Mark Lundeen
Gold demand in China impacts the international price of gold as much as demand for gold anywhere else. Deflation in Chinese financial and real estate assets could trigger an Asian run into gold and silver, just as a deflating Dow Jones and California real estate would. So while I do focus on domestic American markets in my articles, we should recognize there are international factors that are important too.
Here are some interesting reports. First, the US Treasury is going to require $1.33 trillion to make it through 2018. That’s an additional $329 billion from July to September 2018.
That’s a lot of new Treasury debt for the market to absorb in the next three months. And then as seen below, the Federal Reserve is selling T-debt in the market too and has been since last November.
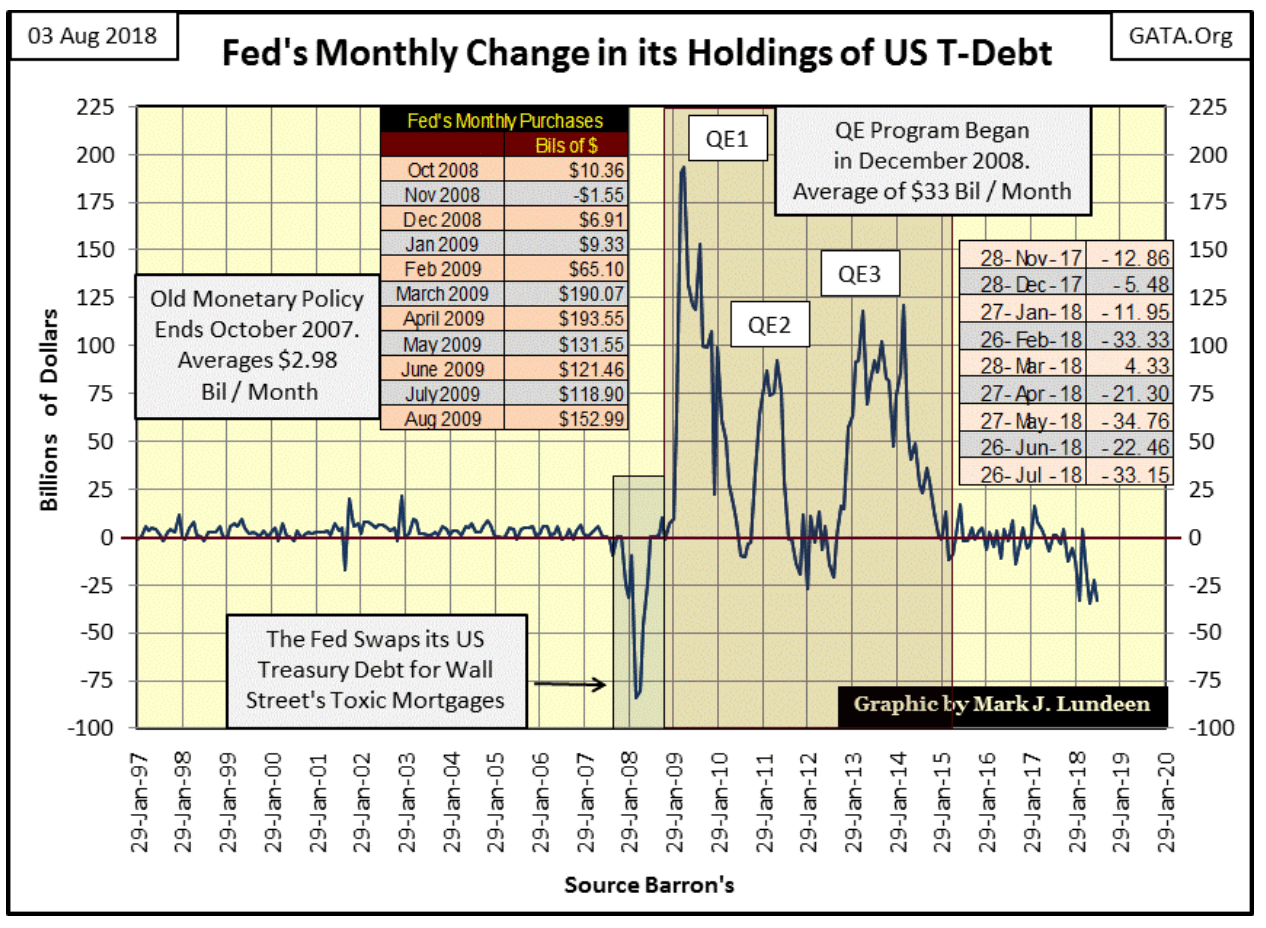
© Mark Lundeen
That T-bond yields aren’t higher than they are now is amazing. One has to wonder who is buying Uncle Sam’s IOUs by the billions and trillions at current high prices and low yields. It used to be FOMC, but they claim they are now net sellers of T-debt (chart above).
Considering the fact the Federal Reserve’s balance sheet hasn’t seen a public audit since its creation in 1913, don’t be surprised if for every dollar of T-debt the Federal Reserve claims to have sold since last November, it has also purchased two or three dollars of T-debt to be held in an off-balance sheet account.
Moving on, global real estate valuations are under pressure as quoted below from Bloomberg’s report,
“From London to Sydney and Beijing to New York, house prices in some of the world’s most sought-after cities are heading south.
Tax changes to damp demand, values out of kilter with affordability and tougher lending standards have combined to undermine the market. That could have wider implications because the world’s wealthy have been buying homes on multiple continents, meaning a downturn in one country could now pose more of a threat to markets elsewhere, according to the International Monetary Fund.”
It’s not just real estate that’s wildly overvalued; Apple is going to become the first trillion-dollar company?
“Apple said Tuesday that its profit had jumped more than 30 percent to $11.5 billion in the recently ended quarter, besting market expectations despite selling fewer iPhones than analysts projected,” a Yahoo! News report noted.
Take this in—based on profits (Annual? Does it matter?) of only $11.5 billion, the market is driving Apple’s market capitalization to $1 trillion dollars. I read this and I crossed myself to ward off the demons currently at work in the stock market!
In late 1999, there was lots of talk of Cisco becoming the first $1 trillion market cap company, and I remember how that ended. But Bloomberg obviously believes “it’s different this time.”
—
DISCLAIMER: This article expresses my own ideas and opinions. Any information I have shared are from sources that I believe to be reliable and accurate. I did not receive any financial compensation in writing this post. I encourage any reader to do their own diligent research first before making any investment decisions.


El Dorado Raises $9M to Expand Cross-Border Fintech Platform
El Dorado, a Latin American fintech improving cross-border financial services, raised a $9 million Series A led by Paradigm with...


Bitcoin Stalls Near $60K as Strategy Moves, ETFs Outflow, and EU MiCA Rules Take Effect
Bitcoin hovers near $60,000 with ETF outflows, while Strategy boosts reserves, sells BTC, and raises dividends to reassure investors. Ethereum...


Cannabis Dominates Global Drug Use: Trends, Risks, and Shifting Markets
Cannabis remains the world’s most widely used illicit drug, with 256 million users in 2024, surpassing all others combined. Growth...


Italy Approves First Hydrogen-Powered Train for National Rail Network
ANSFISA has approved Italy’s first hydrogen-powered train, the Alstom HMU214, for use on the Brescia–Iseo–Edolo line. Capable of 140 km/h,...


Cotton Market Weakness Persists Despite Brief Rebound
Cotton prices fell to new lows last week before a modest rebound. USDA data shows crop conditions remain worse than...
 |
|
 |  |
 |
|
-

 Africa6 days ago
Bank of Africa Expands Sino-African Trade Partnerships in Beijing
-

 Biotech2 weeks ago
Bavarian Biotech Sector Expands with Record Funding and Startup Growth in 2025
-

 Africa2 days ago
BOAD Approves Major Funding Boost to Drive West African Development
-

 Business1 week ago
Markets Diverge as Oil Falls, Rates Hold, and Inflation Persists
You must be logged in to post a comment Login