Featured
The economic woes on the stock markets could be long-lasting
Who is right? Wall Street with a stock market up 40% from the March lows. Or Main Street with 43 million unemployed in the U.S. Is it two sides of the same coin, or polar opposites? Both were the recipients of central bank and government funds. Main Street stood still, Wall Street soared. Our chart of the week is actually several charts looking at recent economic numbers.

Recession? Depression? Upturn? Boom? Main Street unemployed. Wall Street celebrating. What gives? How are we supposed to read the tea leaves of where we are going with 43 million unemployed in the U.S., 2.5 million unemployed in Canada, while the stock markets appear poised to soar to new highs? Wall Street says piffle. Who cares how many are unemployed. The Fed has our back and has poured trillions into the market. Buy, buy, buy. Meanwhile, everyone else is wondering where their next job will come from, will they have a job, or will their former employer open up and take them back?
Jamie Dimon, CEO J.P. Morgan Chase, thinks the U.S. will see a fairly rapid recovery in the third quarter. “The government has been pretty responsive, large companies have the wherewithal, hopefully we’re keeping the small ones alive” and that the “increasingly strong actions” of the Federal Reserve have helped small business. Nouriel Roubini, Professor of Economics at New York University’s Stern School of Business—sometimes known as Dr. Doom or is it Dr. Gloom, does it matter—thinks at best it will be a lackluster U-shaped recovery later this year followed by an L-shaped “Greater Depression” throughout the 2020s. Two sides of the same coin? Or two opposites?
In 2008, at the height of the financial crisis, J.P. Morgan was bailed out as part of the TARP program to the tune of $25 billion. There was also a $29 billion backstop provided to assist with J.P. Morgan’s purchase of Bear Stearns, the company at the heart of the sub-prime collapse that was triggered in July 2007. J.P. Morgan later paid a $13 billion fine in settlement with the U.S. government on charges that the bank overstated the quality of mortgages it was selling to investors in the run-up to the financial crisis. Mr. Dimon claimed that J.P. Morgan’s actions during the 2008 crisis were done to “support our country.” No bank executives went to jail or were charged for one of the greatest collapses in banking industry. Executives, including Mr. Dimon, paid themselves multi-million-dollar bonuses and moved on.
Dr. Doom, on the other hand, predicted that the world was drifting into a perfect storm of financial, political, socio-economic, and environmental risks following the 2008 financial crisis. He believed that, rather than addressing structural problems that the financial collapse and recession revealed, they merely kicked the can down the road, creating major downside risks that made another crisis inevitable. It has now arrived.
We have read any number who are on the side of Jamie Dimon or on the side of Nouriel Roubini. The economic and financial divide is not much different than the socio-economic and political polarization that is with us today.
So, who’s right? In looking at the current landscape, they could both be right. Wall Street is soaring. The Dow Jones Industrials (DJI) is up 40% from the March pandemic panic lows. Still, it remains 13% off the February highs. Main Street is down on its knees. Yes, Main Street is trying to open up. The question is, how many will open up? How many will be called back to work? It is estimated, for example, that upwards of 50% of restaurants may be closed for good. That’s a lot employment not coming back. The bulls, however, remain steadfast that most of the currently unemployed will soon be back at work.
Many have just dropped out of the work force, probably realizing their search is fruitless with so many out of work. The category “not in the labour force” has soared to 117 million in the U.S., up from 93 million only two or three months ago. Not all are retired, disabled, or full-time students. The official unemployment rate for April in the U.S. was 14.7%. But when one counts short-term discouraged workers the unemployment rate jumps to 22.8%. Add in long-term discouraged workers as reported by Shadow Stats and the rate leaps to 35.4%. In Canada, the official unemployment rate for April was reported as 13% but it jumps to 17.8% when one includes those not actively looking because of the frustration of so many who are unemployed. We have been unable to find a number similar to Shadow Stats that includes long-term discouraged workers.
May numbers are expected to be worse. The May employment report is due out this coming Friday, June 5, 2020. Consensus forecasts are for nonfarm payrolls to fall 8,250,000, and, an unemployment rate of 19.7%. Canada is expected to lose at least 500,000 jobs, but some forecasts put as high as 2.6 million. The unemployment rate is forecast to range from 15% to 17%.
Some see the frustration of seeking jobs and have gone back to school. Many people, particularly in the service industries, could become permanently unemployed given the number of businesses that are just shutting their doors for good. Several high-profile retail companies have declared bankruptcy and are shutting down hundreds of outlets for good. The oil and gas industry is in a depression, hit with the double whammy of the pandemic and the collapse in oil prices. Bankruptcy statistics are already noting that bankruptcies in 2020 are rapidly approaching the levels seen at the height of the financial crisis in 2009 with over half the year to go. These are U.S. Chapter 11 and 7 bankruptcies and do not take into account those who just close their doors and walk away.
The housing industry on both sides of the border is facing a potential drop as sales plummet and housing starts stagnate and fall. Prices are sure to follow to the downside. Canada’s CMHC is predicting that housing prices will fall 9% to 18% with certain areas, particularly in the Western Canada oil patch in Alberta, seeing up to a 25% decline. They are also predicting that housing starts will drop between 50% and 75% in the second half of 2020 and that the overall recovery won’t be seen until at least 2022. The real estate industry disputes these numbers. Immigration is down, mandatory down payments for first time buyers are rising (have gone from 5% to 10%), distressed mortgages where banks have deferred payments for six months total some 740,000. It is estimated that between 20% and 40% of these mortgages could be in arrears after the deferral period is up, potentially putting distressed housing on the market. Investors unable to find renters or Airbnb owners unable to find long-term renters may find they have to put their houses/condos on the market to meet payments.
Shopping malls are mostly empty, restaurants are limited to take-out. One can’t even watch sports and repeats on TV of long-ago Stanley Cup finals and World Series just doesn’t cut it. Even Tim and Sid do their TV sports show from their homes. Thousands are working remotely. But many can’t due to the nature of their jobs. They are usually lower paid jobs.
Wall Street celebrating the run-up. Main Street unemployed. Champagne corks popping on Wall Street. A “depression” on Main Street. Yet, underneath, there lurks the potential for major defaults in the corporate sector or sovereign defaults. Corporate America has raised a mind-numbing $1.2 trillion this year. However, it is all based on the Fed buying back corporate debt essentially backstopping the market. Over the next two years some $4 trillion of corporate debt comes due. Much of it is already rated BBB or lower (junk). The investors believe the Fed is their backstop. But what if the Fed is unable to come through? Bizarrely, CCC-rated junk bonds were the best performing bonds in May with a return of 5.79%. BB-rated bonds, the highest rated non-investment grade bond returned 3.76%. Something is amiss. Yet during May there were net withdrawals of funds from investment grade bonds (down $4.8 billion), junk bonds (down $5.1 billion), and leveraged loans (down $2.3 billion). Still, it is not surprising to learn that the number of credit default swaps has spiked.
As to sovereign debt, we already have Argentina defaulting on their recent payments as they try to work out a deal with investors. More sovereign defaults could be seen, given the shaky finances of numerous countries. If they default, who pays? Investors? The banks? Or does the government (central banks) pony up again?
Then there are the growing geopolitical tensions. U.S./China, China in Hong Kong, Hong Kong losing its special legal status that gave them a favoured position for trade and travel, the India/China border dispute, and there remain tensions in the Middle East between Turkey/Syria as well as disputes in Iran, Iraq, and Libya and the potential for a major explosion between Israel and Palestine over annexation that could quickly pull in others.
There are also rising domestic tensions. In the U.S., cities are burning as protests grow over the killing of a black man George Floyd in Minneapolis by the police. Riots are occurring not only in Minneapolis but have spread to other cities. The National Guard is being called in, and we understand military police are being called in. The President, through tweets and orders, is threatening a crackdown and violence against the protestors. This is all in the lead-up to the 2020 election that has the potential to be the most divisive and potentially violent election ever seen in the U.S.
Seemingly forgotten are human tragedies with the pandemic pushing an estimated 500 million into absolute poverty and the growing potential for famine, plus the massive infestation of locusts in East Africa that could spark another wide-scale famine.
So, who’s wrong? Wall Street or Main Street? Or are both right? The stock market looks ahead. The expectation is that with the ending of the lockdown businesses will slowly open up and if it is not a V recovery it will be a good U recovery into the fourth quarter. It appears to make no allowance for a second wave. There is also great hope on a vaccine. But vaccines take time to develop. On average, it has taken upwards of four years to develop a vaccine. But the odds of having something before the spring of 2021 are low. As time moves on and there is no vaccine, or as we say, a magic bullet, the stock market will realize they are wrong and we could be in for a swift decline.
Then there is the upwards of $3 trillion that the Fed has disbursed to purchase bonds or direct payments for liquidity into the financial system. Not all of those funds remained with the Fed as bank reserves. The money goes somewhere and since it was not lent out to Main Street it is highly probable it found its way into the stock market. Retail alone could not account for the 40%+ move in the stock market since the March lows.
But what if the Fed slows its liquidity pump priming as we go forward? The market can’t rely on stock buybacks. Earnings are going to be depressed or at least suppressed for some time. Where will the buying power come from then? As to Main Street, well, they received funds but at best it was to help them “stand in place” and not go completely under as many would have. But what happens when those funds stop coming and there are still millions unemployed with no hope of jobs coming back? Homelessness could rise sharply.
So, is the stock market wrong? There is an old adage that the market is not wrong, only those fighting against whatever the trend is are wrong. If the market is going up, the bears cry that it is being manipulated, that the fundamentals do not support the advance, or that trillions of Fed money are finding their way into the stock market to artificially support it, or that the plunge protection team (PPT) is buying the market. They may even be right. After all, the Fed has made it clear they have more ammo they can use and more tools. But it doesn’t matter. The market is going up until it isn’t.
The same is often said of the gold market that it is being manipulated by the central banks and the bullion banks. While that may be right, the fact remains that the market is what it is. It’s a good reason why we use support/resistance, pattern recognition, and other indicators to advise us about trend changes. One does not rely upon the pleas of the “gold bugs.” One may have an opinion about the market, but if it is going against you then you are wrong no matter what you might think. The market does not know you are wrong nor does it care. In that respect it is unforgiving.
There has been considerable optimism on Wall Street that all will be well with openings and the potential for a vaccine. But the numbers are not supporting their optimism, at least not yet. Even if there are openings it appears that physical distancing will remain in place. That is going to make it difficult for many to open up at the previous capacity. There may also be considerable reluctance to return to restaurants, cinemas, theatres, sports events, air travel, and more. International travel is in collapse. But domestic travel could rise. Numbers are sure to remain depressed. In behind, there are too many geopolitical and domestic political conflicts to warrant the current stock market excitement. But the money has to go somewhere. Consumer confidence has waned but it has not completely given up hope, yet. Bottoms occur when everything appears the gloomiest. We are not there yet. Not by a long shot.
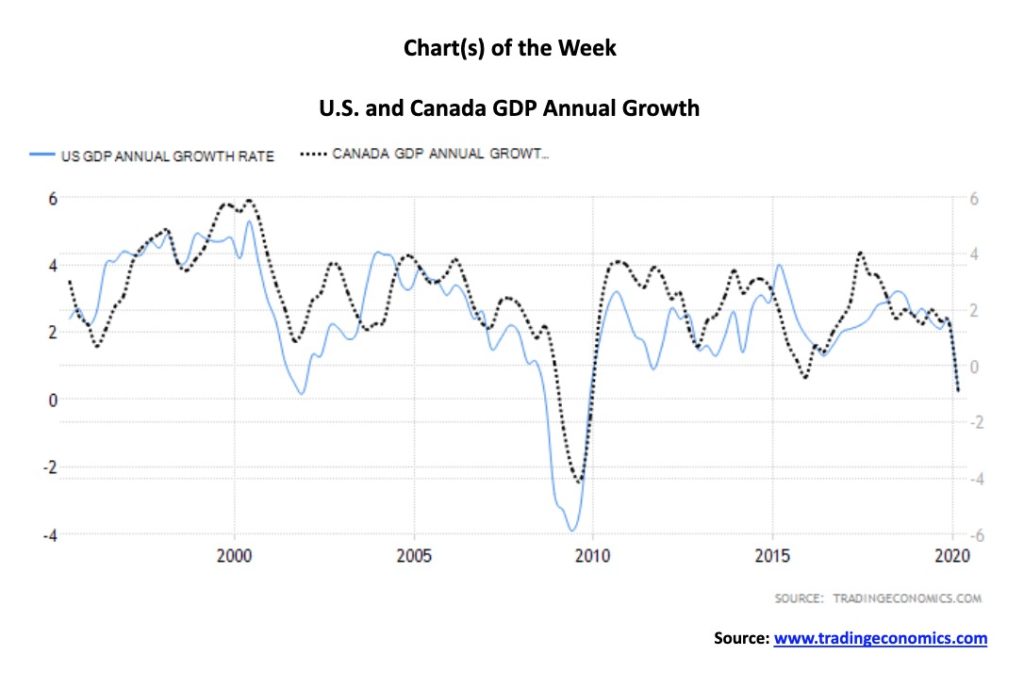
It was a week for economic numbers. First off, both Canada and the U.S. reported Q1 GDP. The U.S. reported that GDP contracted a revised downward 5% in Q1. Most expect that Q2 will be even worse with predictions of upwards of a 40% decline. Optimistically, the expectation is for Q3 to rise by over 21%. However, even a gain that strong would not make up for the decline during the first two quarters. Year over year, U.S. GDP was up a mere 0.23%. The Q1 plunge was the steepest since an 8.4% decline in Q4 2008.
Canada’s GDP shrunk by 8.2% in Q1. It was the worst quarter since 2009. Besides the pandemic, Canada also dealt with a rail blockade and the Ontario teachers strike. Year over year, Canada’s economy shrunk 0.9% from March to March. It was the first year-over-year contraction since Q4 2015.
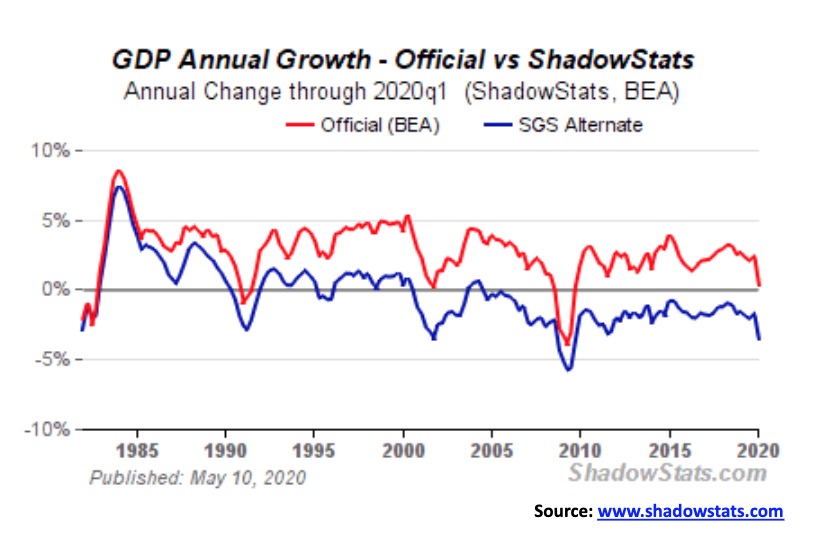
Shadow Stats (www.shadowstats.com) released their report on U.S. GDP. Their reported GDP showed a year-over-year contraction of 3.6%. Shadow Stats adjusts for distortions in government inflation plus methodological changes made back in the 1990s that result in a built-in upside bias to official reporting. Shadow Stats is also expecting Q2 to be an exceptionally steep decline.
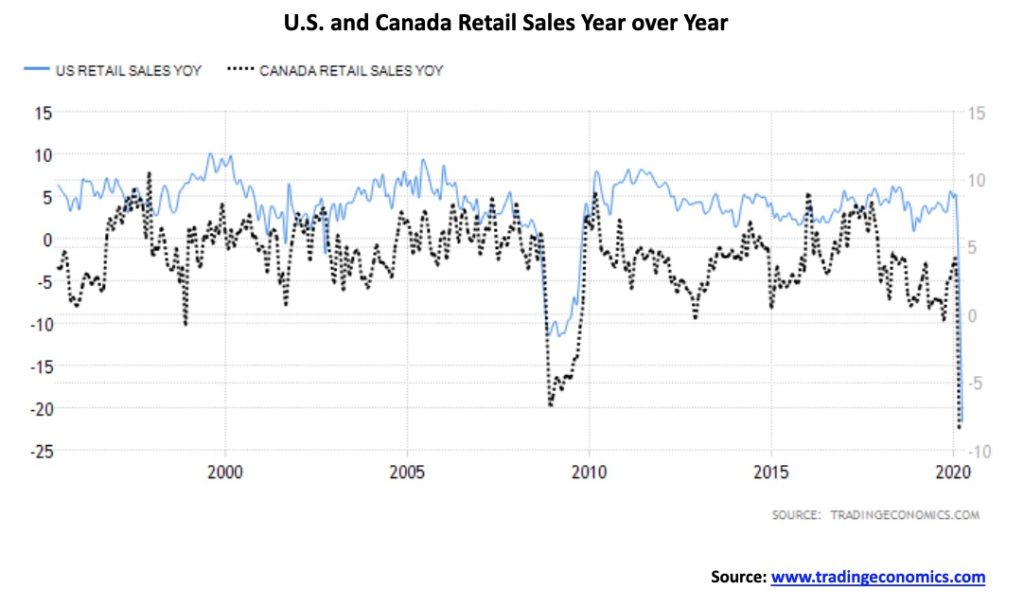
Retail sales in the U.S. contracted an astounding 21.6% in April over the same month in 2019. It was the largest drop ever seen in the 73 years the current series has been run. Canada is running a month behind as the last report showed a year-over-year drop of 8.4% from March a year earlier. Irrespective of this, that was also a record drop in retail trade. April is expected to be even worse.
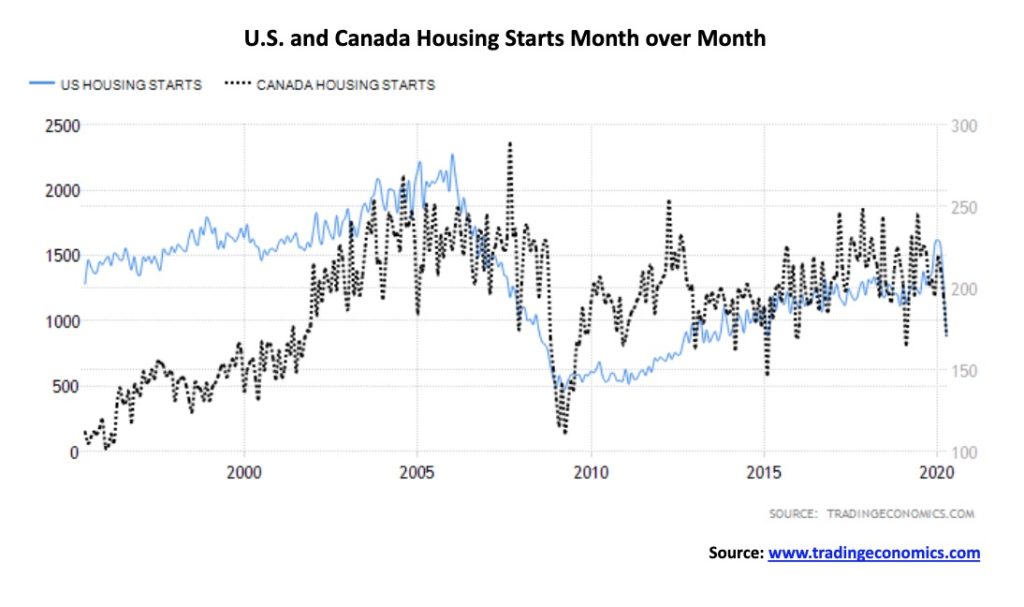
Housing starts plummetted in both Canada and the U.S. in April 2020. The U.S. fell 30.2% month over month to an annualized rate of 891 thousand, well below expectations of 927 thousand. It was the lowest reading since February 2015. Year-on-year housing starts were down 29.7%. Housing starts in the U.S. remain well below the peak levels seen back in 2006 when it hit a peak of 2,494 thousand. Canada’s housing starts fell 12.4% in April from March to an annualized 171,265. The good news is that economists had expected it to plunge to 110,000 starts. So this was actually a pleasant surprise. And these numbers don’t include Quebec. Still, it remains well below the peak seen in 2006 when housing starts hit 291,600.
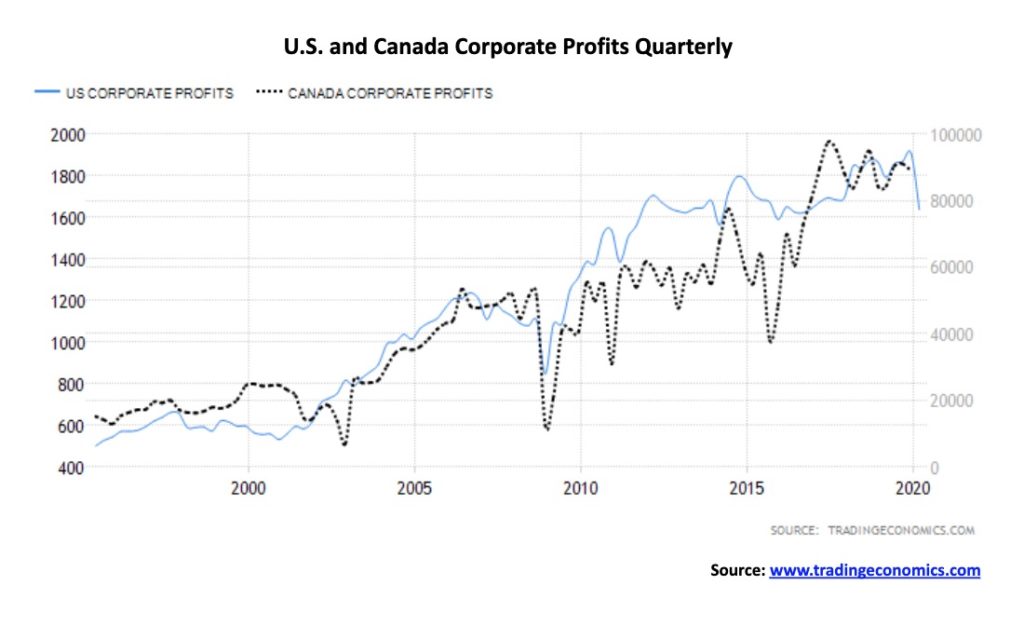
U.S. corporate profits plunged 14.2% in Q1 following a 2.1% rise in Q4 2019. It was the sharpest decline since Q4 2008. Despite the drop in profits, net dividends rose 1.4%. But the rise in dividends may have been because they were looking back at previous performance. Canada hasn’t yet reported their Q1 profits. However, Q4 corporate profits in Canada were down 2.4% from Q3 2019. The expectation is that Q1 will show a further drop in corporate profits, especially given the dismal results reported by the banks.
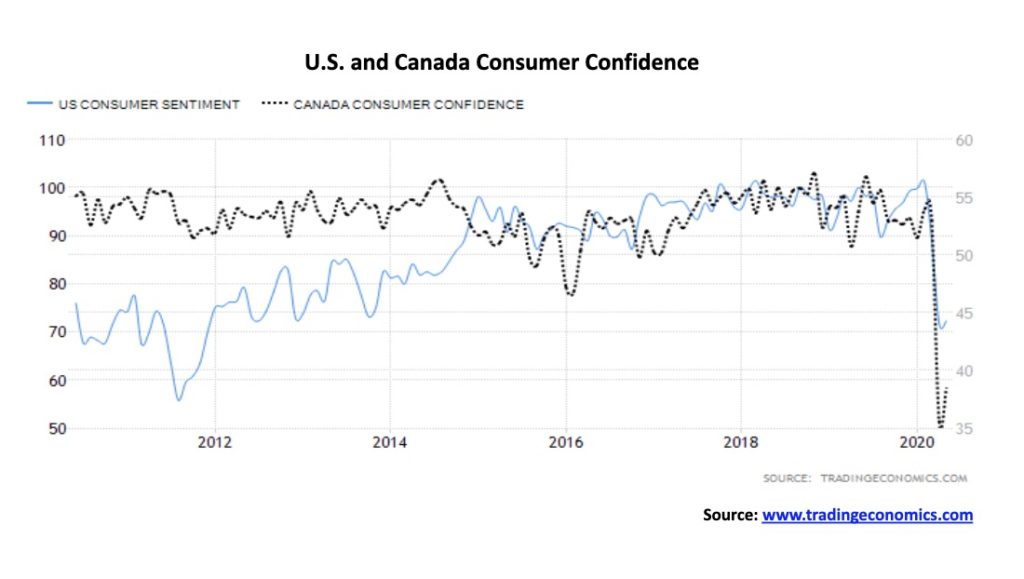
Consumer sentiment in the U.S., as measured by the University of Michigan Consumer Sentiment Index, was revised down to 72.3 following a first reading of 73.7. However, it remained above April’s reading of 71.8 which was the worst reading in eight years. While unemployment cheques plus other disbursements have allowed many to effectively “stand in place,” the reality is many are just stunned by what is going on and that, overall, puts a big damper on everything. You can’t have confidence when unemployment is starting to run up to Great Depression levels. Even those still employed are feeling the pall. In Canada, the Consumer Confidence Index also ticked higher in May from April to 38.45 vs. 35.6. The April index was the worst in 25 years of recording consumer sentiment.
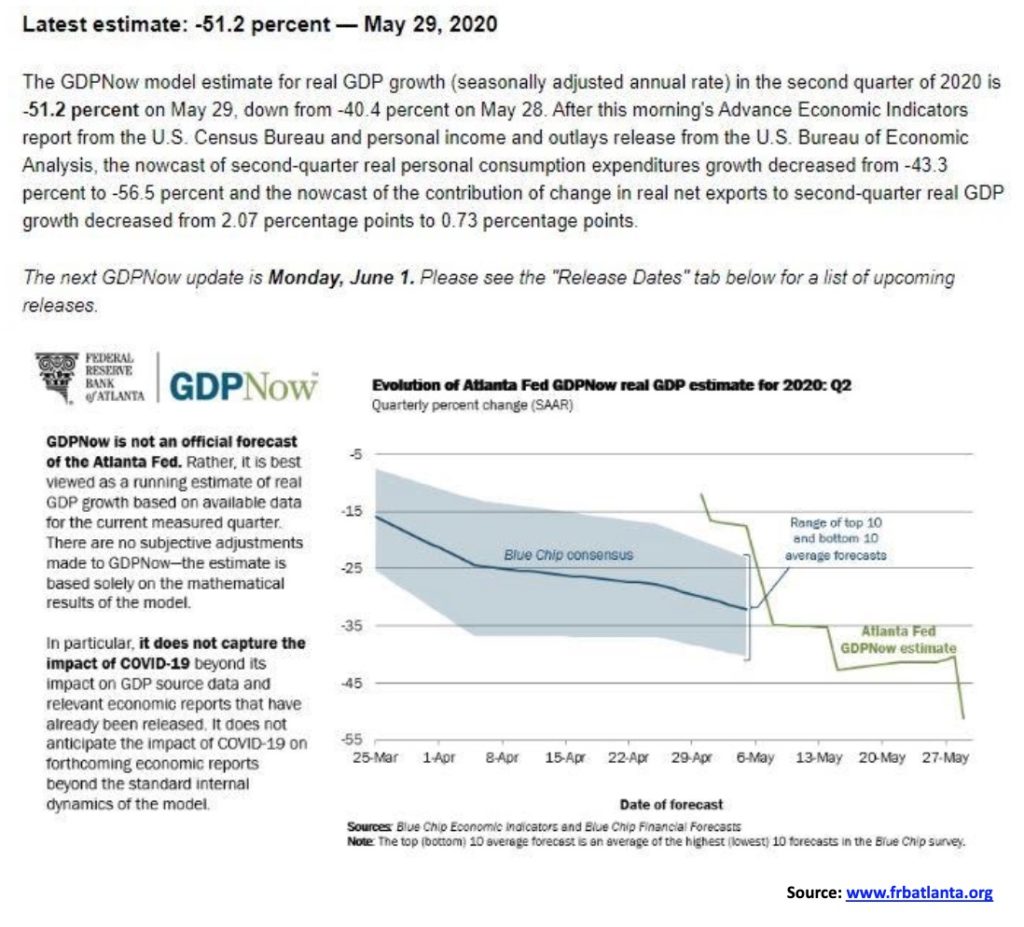
We found the above chart from the Atlanta Fed rather fascinating. It is not, according to the Atlanta Fed, an official forecast. It is viewed as a running estimate of real GDP growth based on data that is currently available for the current quarter that ends June 30, 2020. It doesn’t try to forecast future impact of the COVID-19. The model suggests that real GDP growth for Q2 could fall 51.2%. Apparently, the Atlanta Fed is constantly updating their model. We’ll keep an eye on it.
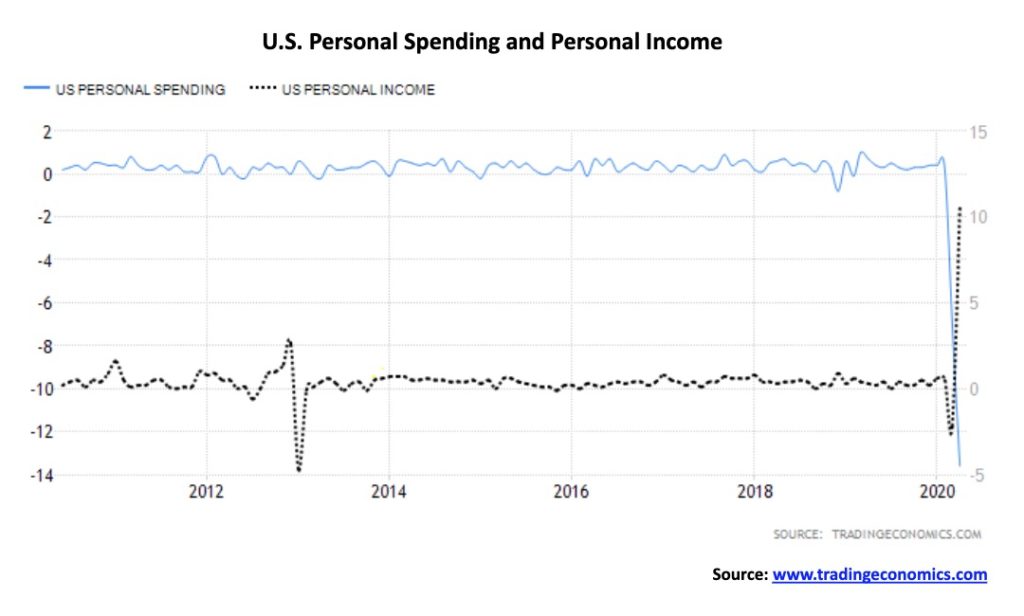
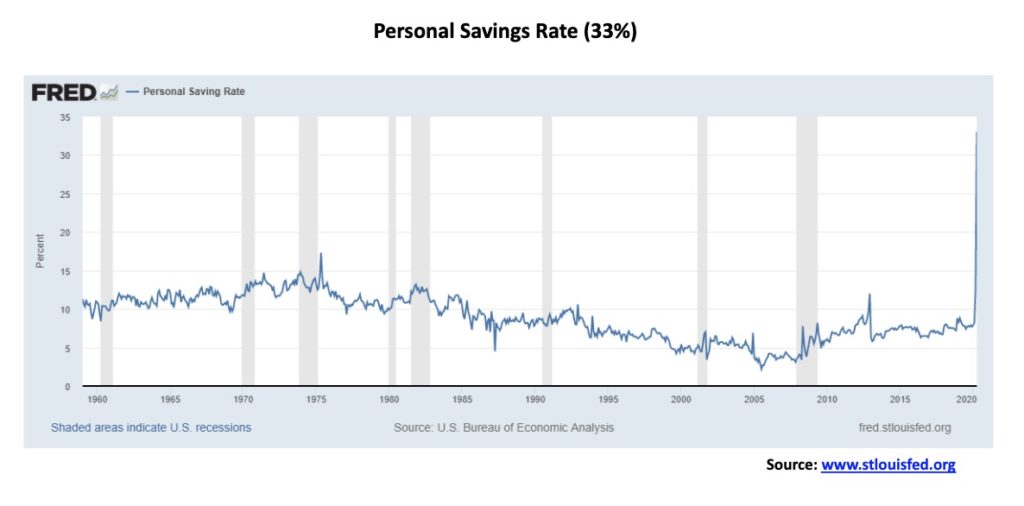
Personal spending for April fell a record 13.6% month over month. It followed a downward revision to the March personal spending to down 6.9%. The market had expected personal spending to fall 12.6%. Personal income on the other hand leaped 10.5% month over month in April 2020. March was revised upward by 2.2%. The market had expected a decline of 6.5%. It seems that funds from the federal economic recovery program helped. So if spending plunged and income leaped where did all the money go? Well, apparently into savings or paying down debt. The personal savings rate leaped to 33% in April after rising to 13.1% in March. Will this money come out when restrictions ease? Or will it remain in savings? We’d expect it to fall but it may not fall back to previous levels. People have been spooked. Saving will take precedence over spending.
Below are three more charts.
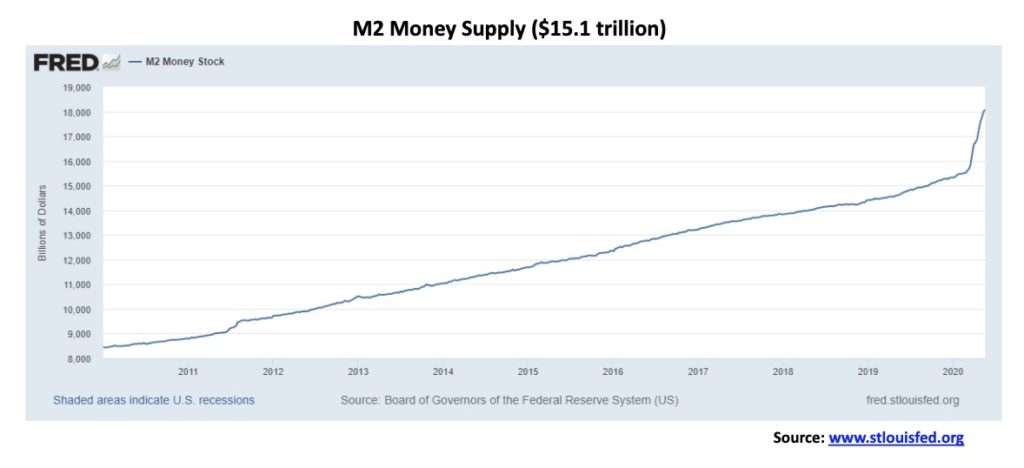
Money supply as represented by M2 continues to soar – up $2.5 trillion since the beginning of March.
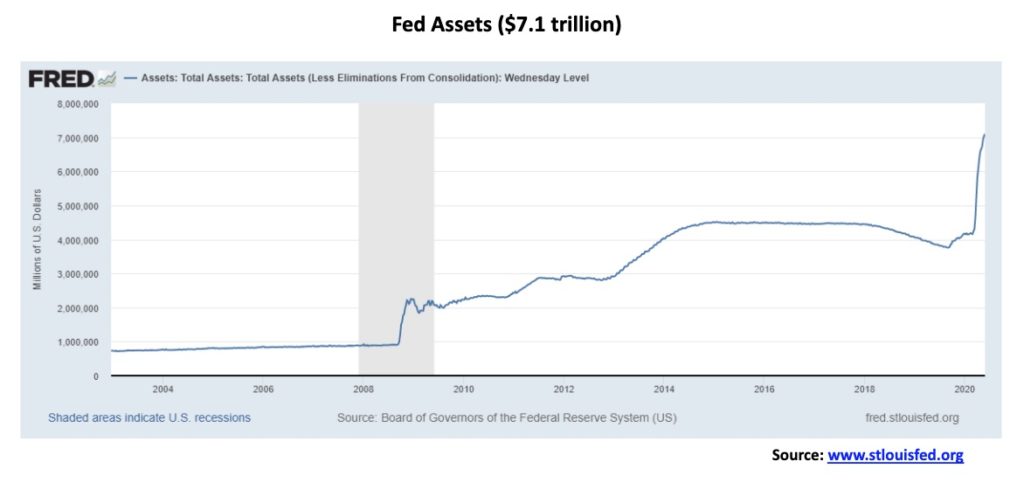
The Fed’s assets on their balance sheet have soared – up $3.3 trillion since the end of August 2019 and up $2.9 trillion since the beginning of March.
All that money has to go somewhere. Stock market?
Meanwhile the personal savings rate has soared to a record 33% doubling anything seen in the past 60 years. Although as a percentage of disposable income the rate is 9.6% still below what was seen up until the mid 1970’s but still the highest level in 45 years.
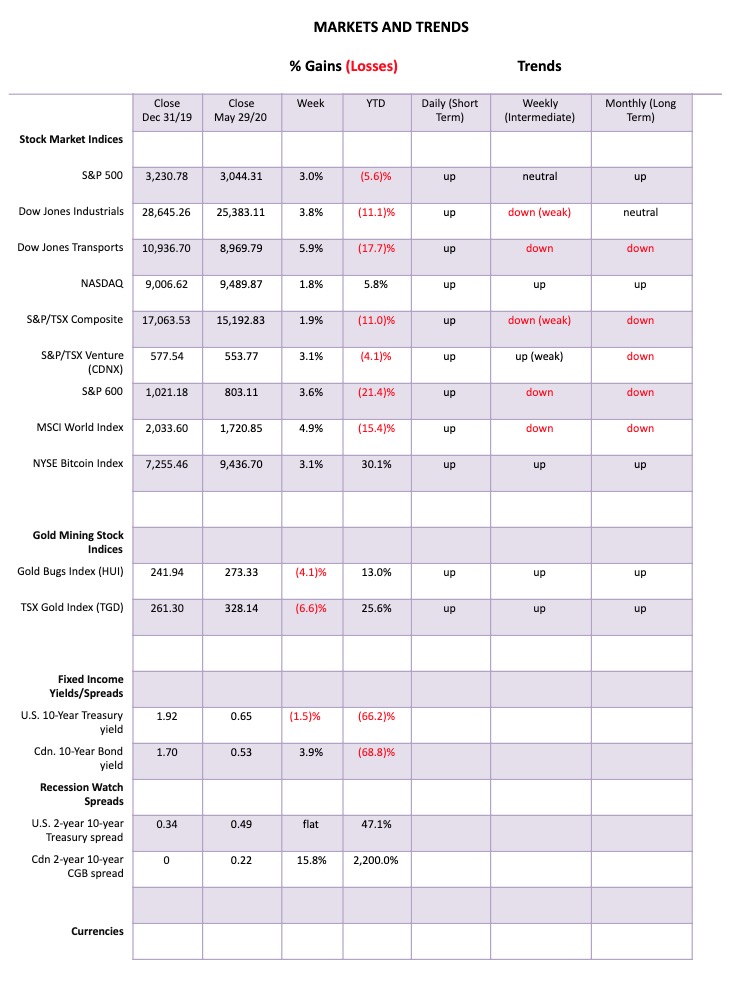
What a month. Actually, it has been some two months. The S&P 500 is up 39% from that horrible March low. Happy days are here again! Okay, not quite. The S&P 500 is still down 5.8% on the year. The stock markets once again put in a good week. The S&P 500 gained 3.0%, the Dow Jones Industrials (DJI) was up 3.8%, the Dow Jones Transportations (DJT) gained 5.9% but is still down 17.7% in 2020. The NASDAQ lagged this past week, up 1.8% but it is the only major index in the black for 2020, up 5.8%. The small cap S&P 600 gained 3.6% but remains down 21.4% in 2020. Here in Canada the TSX Composite was up 1.9% while the TSX Venture Exchange (CDNX) continues to move higher, up 3.1%. The CDNX is now outperforming the TSX in 2020, down 4.1% vs. the TSX down 11.0%.
Overseas, there were some good returns. The London FTSE gained 1.5%, the Paris CAC 40 steamed ahead 5.6%, while the German DAX jumped 4.6%. In Asia, China’s Shanghai Index (SSEC) was up 1.4% while the Tokyo Nikkei Dow (TKN) leaped 6.6%. In under-siege Hong Kong, the Hang Seng Index actually gained a small 0.1% but was down 6.8% for the month and is down 18.5% in 2020. We cover the Hang Seng later.
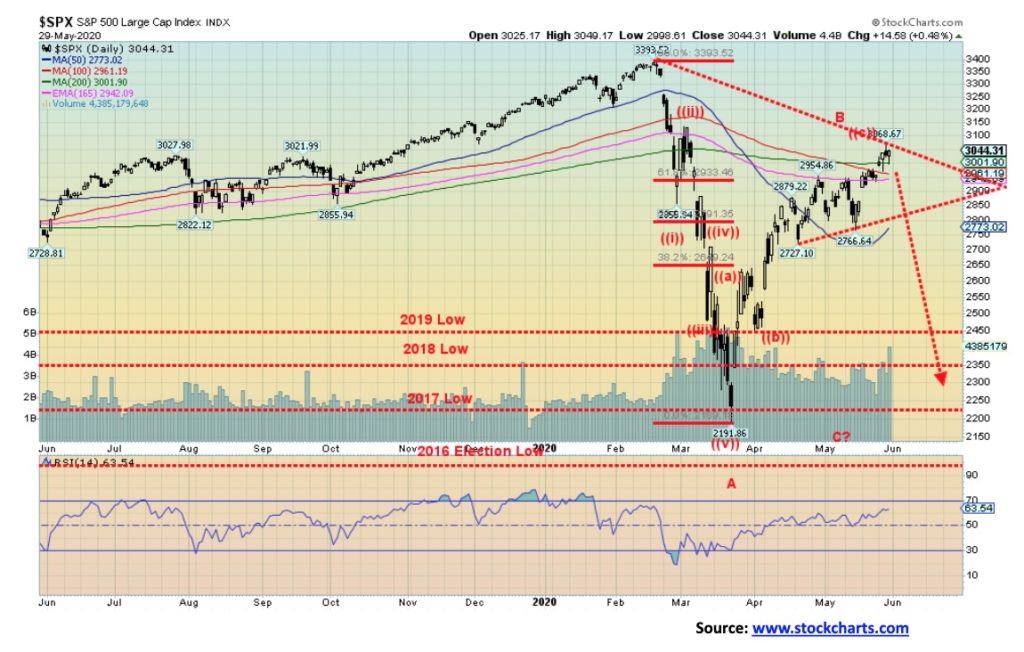
The S&P 500 has now surpassed the 200-day MA, joining the NASDAQ as the only major indices over that benchmark. Others that have surpassed the 200-day MA include the S&P 100, the NASDAQ 100, and the Wilshire 5000. So does that mean they are now in a bull market? Well no, not quite yet. It is not unusual that bear markets rebound to the 200-day MA or even surpass it for a short period of time. If the S&P 500 is still above the 200-day MA at the end of June and others have taken out that key benchmark, then no doubt we could declare the bear is over and the bull has returned.
The FAANGs (Facebook, Apple, Amazon, Netflix, Google (Alphabet)) have led this market up. They now constitute upwards of 20% of the index. All are up on the year. But they faltered this past week which explains why the NASDAQ underperformed. Other areas helped the S&P 500 this past week. Three out of the five FAANGs fell on the week with FB down 4.2%, AAPL off 0.3%, and NFLX down 2.2%. AMZN gained a small 0.2% while GOOG was up 1.3%. Both still underperformed the S&P 500. For the record, Twitter (TWTR) the subject of the President’s ire, fell a sharp 5.1% this past week. The bottom line is, if the FAANGs start to falter and fall, then the S&P 500 will fall too. So in some respects it is best to watch the FAANGs as they could hold the fate of the market.
Technically, momentum is slowing; however, we are not as yet seeing any significant divergences in the daily indicators. None are particularly overbought at this level. All that bodes well for the market going forward. The past three days of trading did leave some potentially bearish Japanese candlesticks on the charts. Wednesday and Friday appear as hanging men while Thursday’s appears as a potential evening star. The evening star is a little body seen at potential tops. Some might interpret Thusday’s action as leaving instead a shooting star because of the slightly longer tail at the top than the evening star usually leaves. The hanging man pattern is also seen at potential tops. It looks just like it sounds, with a long tail at the lower end and small white or black head at the top. Naturally, for the patterns to be confirmed we must now or very soon begin a decline.
Our first good support is at 2,915 and the top of the gap left on the charts on May 18. If that falls, the gap could be filled. The gap goes down to 2,870. The breakdown point is seen at 2,800. If that falls, then there is a good chance the rally is over. Finally, under 2,700, another bear decline should be under way. The bulls’ hope is that the next resistance level at 3,150 falls. If that falls, then the odds increase substantially that new highs above 3,393, the February 2020 high will be seen.
The market has had quite a run. But so far, the run-up has been what we’d call a typical bear market rally. Note that the rebound from the 1929 stock market crash took the DJI up 48%. A 48% gain for the S&P 500 from the March low would be at 3,243. However, the collapse before the recovery saw the DJI fall 48% before recovering. This time the S&P 500 fell only 35.3% with the rebound being 40% so far. Another comparison might be with the NASDAQ of 2000–2002. The initial collapse of the NASDAQ was 40.7% in 2000. The first good rebound rally regained just under 41%. So far, it all fits.
June is not usually a good month for stock markets. It ranks number 11 for the DJI and number 10 for the S&P 500. The NASDAQ hangs in as it ranks number 8. Since 1950 the DJI has recorded 32 up months and 37 down months. Overall, the performance has seen June as a losing month although during an election year it is normally a winning month.
Given the growing violence on the streets of America, could that help turn June into a losing month? 2008 is noteworthy for being an election year against the backdrop of growing trouble in the stock markets. In 2008 the stock market fell into a March low, then rallied into a May high. The next move, however, was down as the S&P 500 fell into a low in July before rebounding into August. September was lights out as Lehman Brothers collapsed.
Highs and/or lows are not unusual in May. May 2012 saw a low and the stock market rallied into October that year, also an election year. 2016 saw a low in May as well with a rally into June before the brief but sharp Brexit drop. For the bulls, June tends to be a good month for the S&P 500 in election years. In looking at election years over the past 40 years we do note that a high in May led to a low in June while a low in May led to a high in June. Does the pattern continue?
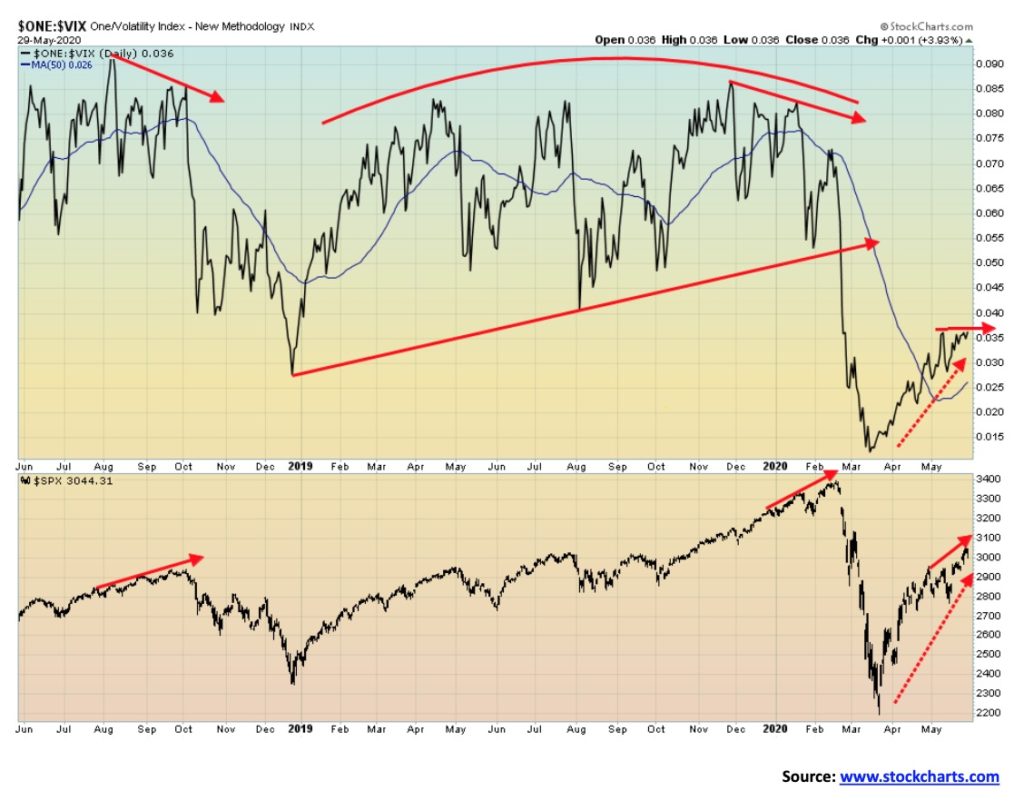
Could the VIX Volatility Index be signaling a decline in the market? Okay, it is not clear just yet and maybe there has not been enough time yet. But over the past few weeks as the S&P 500 has gone up the VIX has flatlined, a divergence. We note the divergences that were quite visible in July/September 2018 and in December 2019/February 2020 as the S&P 500 rose while the VIX fell. The divergence was eventually resolved in favour of the VIX as the stock market eventually fell.
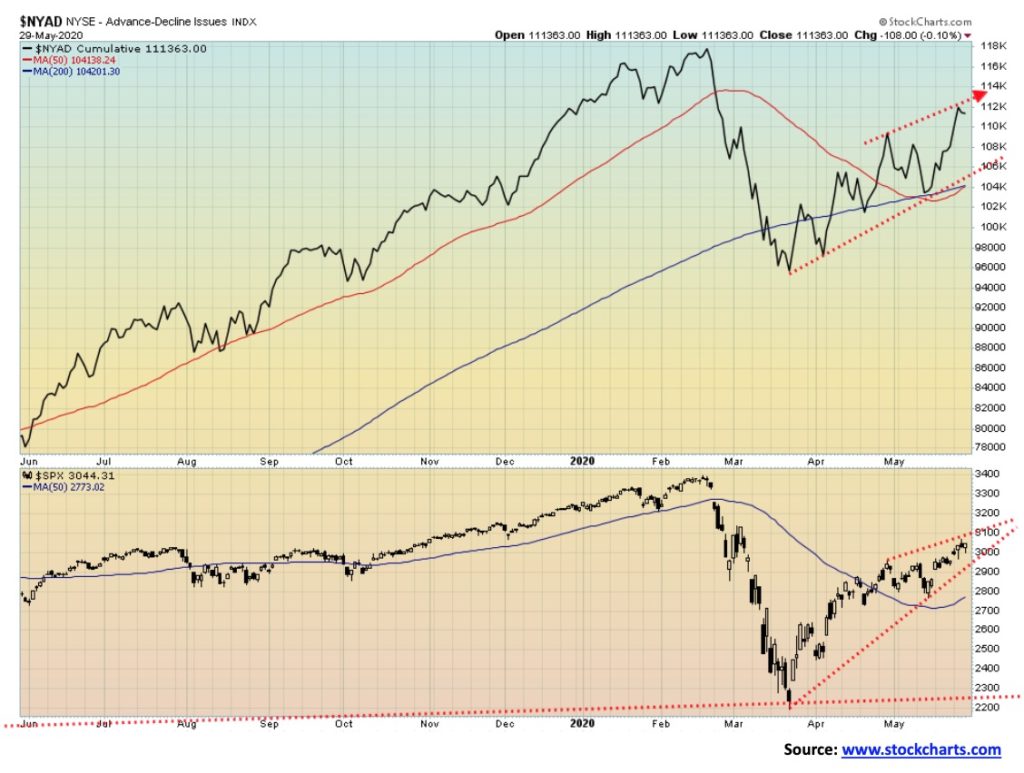
The bulls’ great hope remains the NYSE advance-decline line. The AD line continues to rise along with the market and the bulls would say that shows the market is going to continue to go higher. The S&P 500, however, does appear to be forming a potential wedge triangle. There is a breakdown at 2,900; however, as we noted earlier, we prefer to use our breakdown point at 2,800.
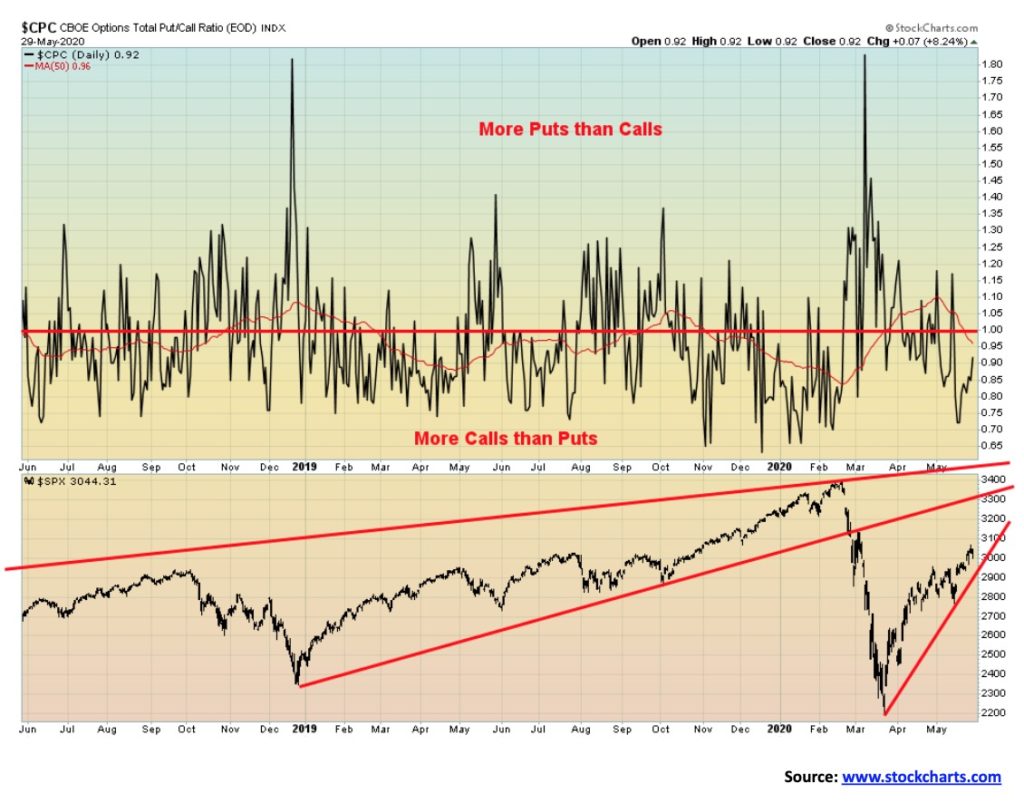
The Put/Call ratio is favouring calls over puts. This is not unusual in a rising market as the market remains in firm bull mode. But if one really wants the market to go higher, it would be better to see more puts than calls. A high preponderance of calls is usually seen at tops while a high preponderance of puts is usually seen at market lows. The 50-day MA of the put/calls is at 0.95, so a rise over that level would probably signal that the market is falling.
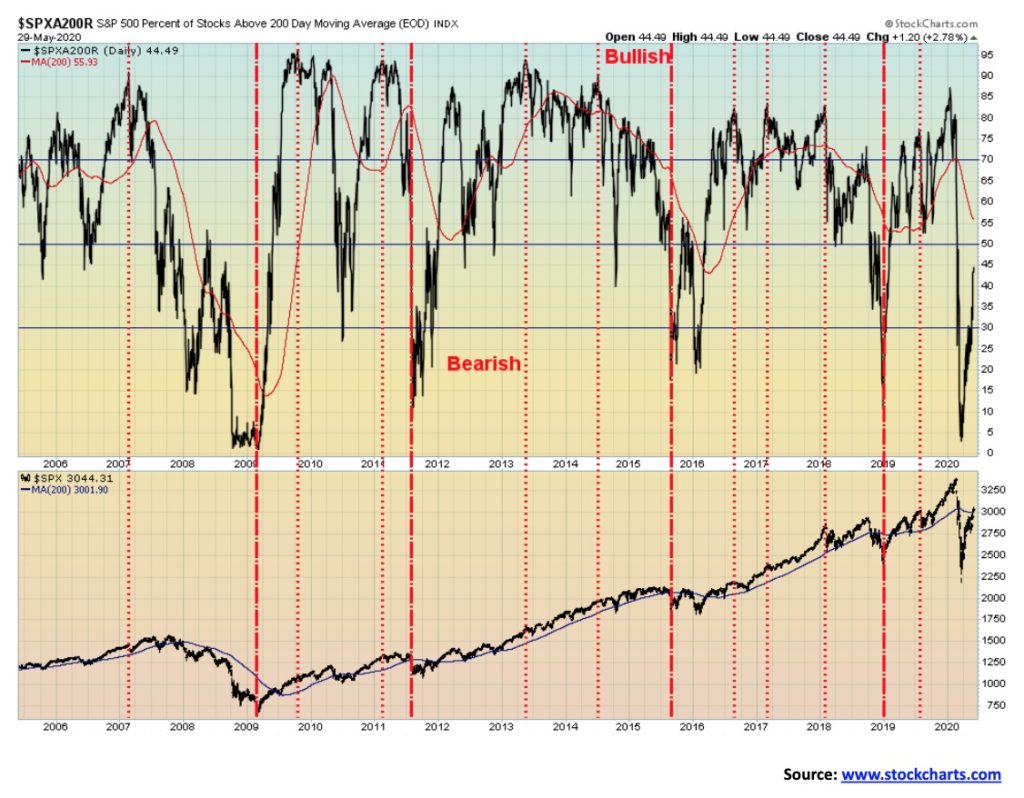
The percentage of stocks trading over the 200-day MA is still not particularly bullish. It is now up about 45%. A continued push by the S&P 500 to stay over the 200-day MA should drag more stocks over their 200-day MA and push the market into a more bullish mode. Returning to the 50% mark in a bear market rally is not unusual. You can see in the 2008 decline that the index returned twice to the 50% level or at least close to that level before turning down once again. It only rose above the 50% in 2009 and then stayed that as the bull market was underway. So far, this is not signaling we are in a bull market.
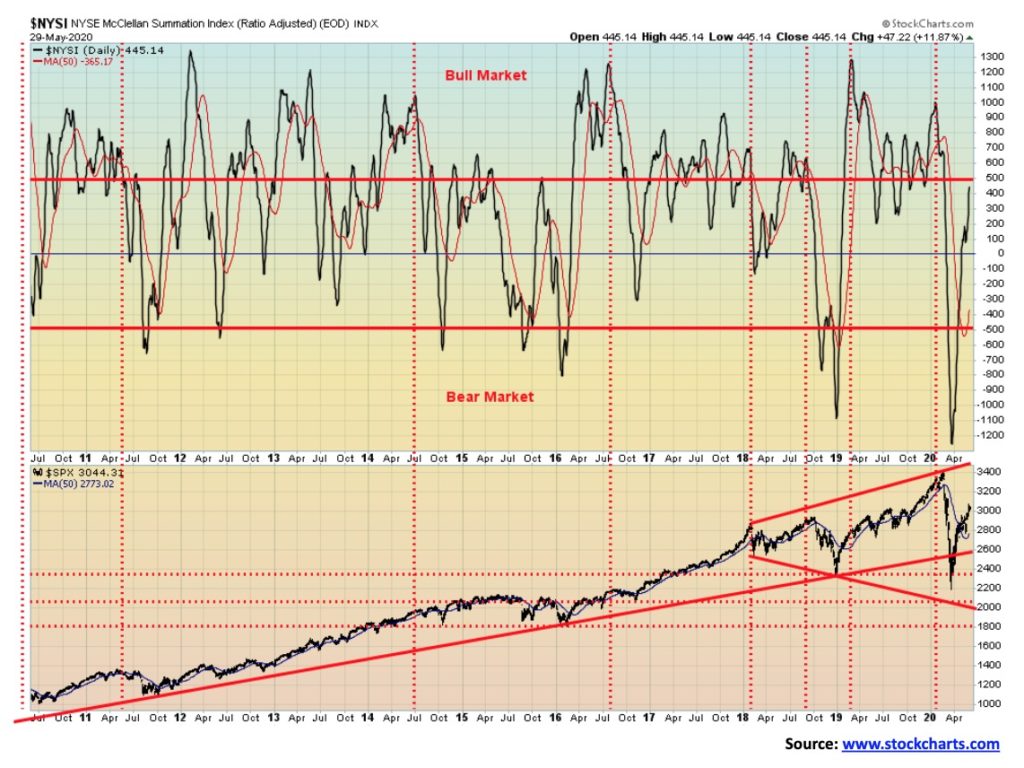
Our favourite McClellan Summation Index (ratio-adjusted), known as the RASI, is now up to 400. Yet the market is up 40%. The RASI is not yet signaling that we are in a bull market but that we have merely crawled back to neutral. Over 500 signals a bull market. The current level is at 445. Another good upward push would get us over 500.
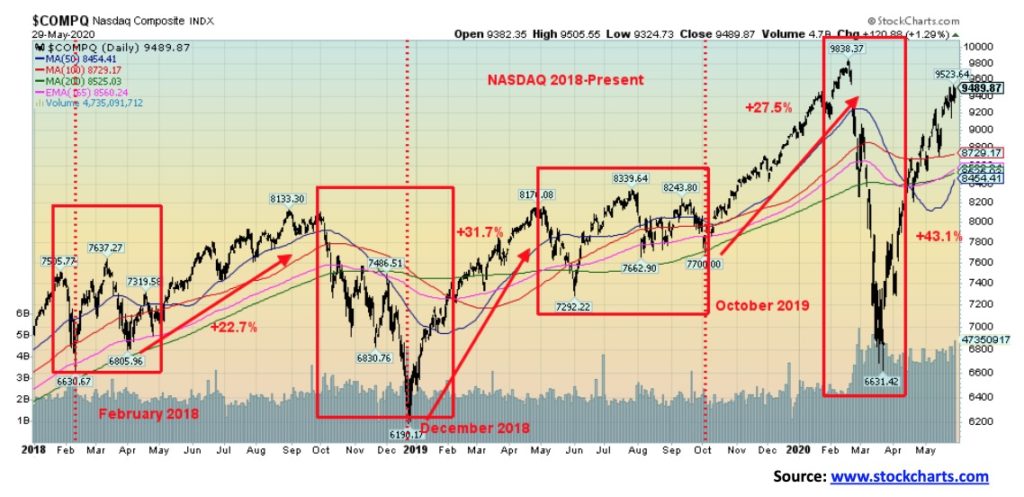
The NASDAQ has been the best performer of the major indices. But keep in mind that the NASDAQ as with the S&P 500 has been led by the FAANGs. The FAANGs make up more than 20% of the NASDAQ. As the FAANGs go up, so do the indices it seems. The NADAQ’s 200-day MA is currently at 8,525. A pullback where that level holds would be positive for the NASDAQ. We’d consider the NASDAQ as breaking down under 8,200. One thing we did notice is that following the December 2018 low, both the S&P 500 and the DJI led the NASDAQ to the upside. This time it is the NASDAQ leading while the other two lag. Could it be a sign of weakness overall?
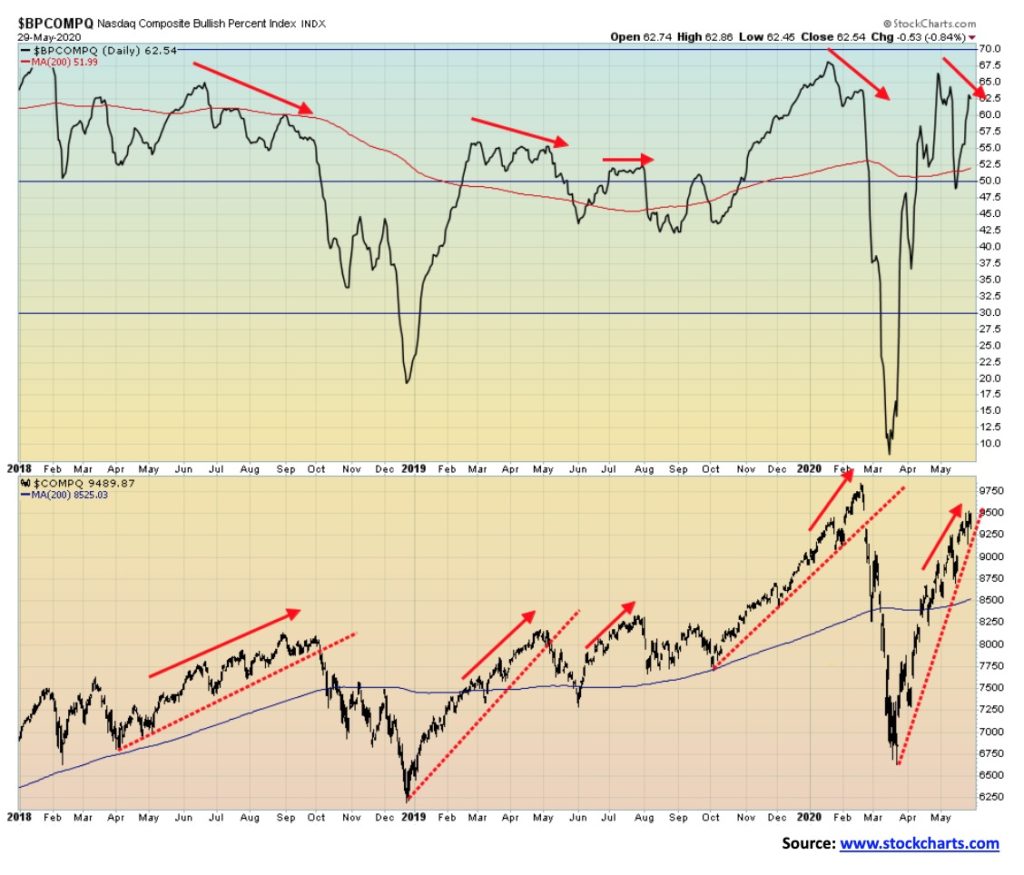
Above is the NASDAQ Composite Bullish Percent Index and the NASDAQ. Note the divergences that developed on the NASDAQ Composite Bullish Percent Index prior to each fall. Once again, we have the NASDAQ Composite Bullish Percent Index making lower highs even as the NASDAQ continues to new highs. A divergence. Each divergence resulted in a fall. The indicator doesn’t tell us when it will fall just that it will fall and we are now closer to it falling. The NASDAQ breaks around 9,250 and under 8,500 the bear could be back in force.
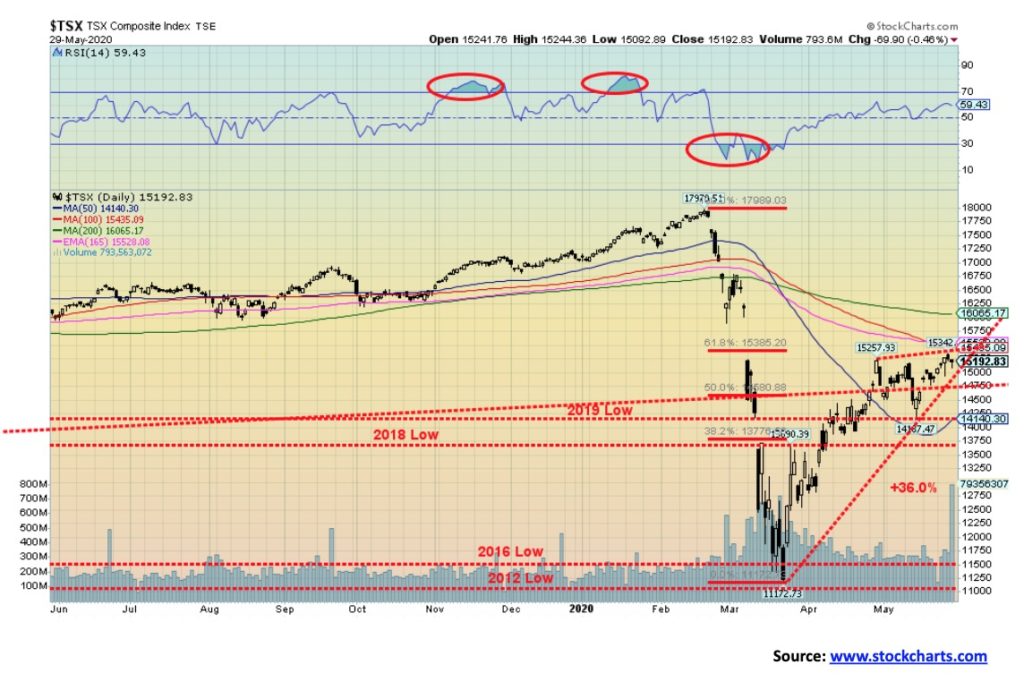
The TSX Composite rose 1.9% this past week, lagging generally behind the U.S. indices. The banks were reporting and they announced they were setting aside a staggering $11 billion for potential loan losses. Rather than punish the banks by sending their stocks lower, they actually rallied. The motto seemed to be that the banks were being smart to make those provisions. The Financials (TFS) sub-index was up 6.7% this past week leading the way for the TSX. The TFS seemed to be making up for the weakness in materials as the Materials (TMT) sub-index was down 4.1%, the Metals & Mining (TGM) was off 2.5%, and Golds (TGD) dropped 6.6%. Materials, led by gold, have had a good run this year and all three remain up on the year with Golds leading the way, up 25.8%. Financials, on the other hand, are still down 20.9% in 2020 despite the good week.
As to the rest, well, overall, eight of the sub-indices were up and six were down. Most noteworthy was Information Technology (TTK) that made new highs for the move reversed and closed lower down 3.3% on the week. That is a poor sign as IT has been a key leader on the way up. Other losers were Health Care (THC), down 4.6% and Energy (TEN), off 1.2%. The most noteworthy winners were Telecommunications (TTS), up 5.1% and Consumer Discretionary (TCD), gaining 4.8%.
Technically, the TSX appears to be forming a wedge triangle. The breakdown point is seen at 15,000. The TSX left a small hanging man pattern on the charts on Friday. And, like the S&P 500, a possible evening star was made on Thursday and another hanging man on Wednesday. However, we need the break under 15,000 to confirm a potential breakdown. Confirmation would come with a break under 14,200. Volume was pretty high on Friday on what was, overall, a small down day. That indicates to us that there was considerable selling even as buyers stepped in (churning?) and the market went nowhere, off a small 0.5% on the day.
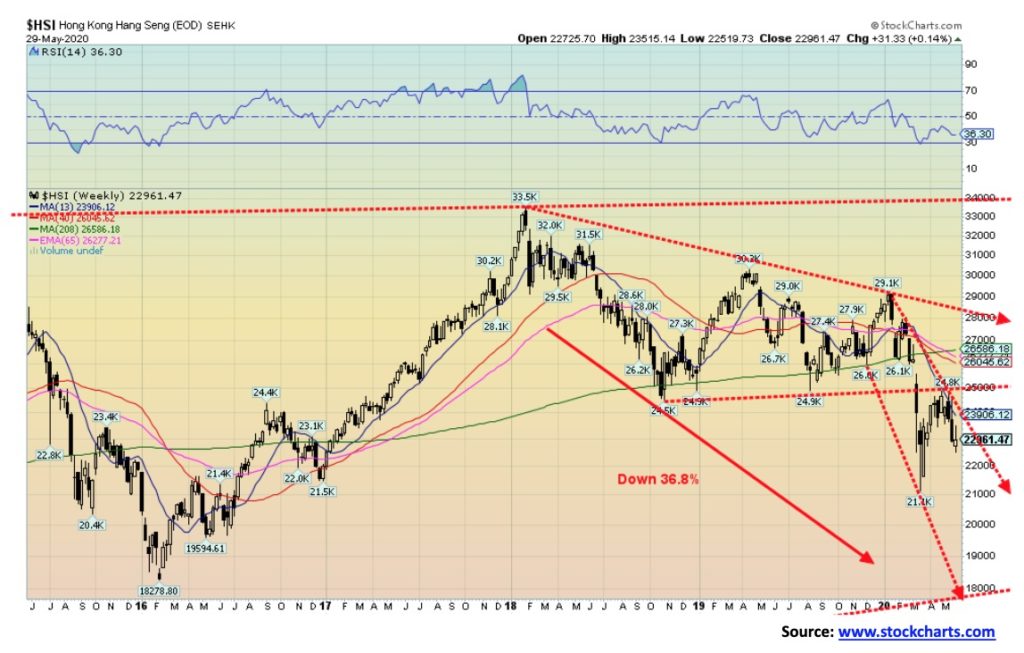
Hong Kong has been in the news with President Trump pulling the plug on Hong Kong’s favoured status. We are not yet sure how this will be played out on the Hang Seng. Hong Kong is a major global financial center and is considered the gateway to China. If targeted tariffs and sanctions are imposed it could have a considerable negative impact. Trump is caught on Hong Kong and China because it is not in his interest to tear up the trade agreement. That would reverberate back on U.S. companies. Imposing more sanctions and trade restrictions would also be counterproductive as again U.S. companies could also pay a steep price. The U.S. has a trade surplus with Hong Kong totalling $31.1 billion in 2018. Despite the potential for a crackdown on freedoms in Hong Kong, it should be noted that Trump has actually shown little interest in the fate of the people and little concern for human rights. His focus is the business side and trade. On that note there are an estimated 1,300 American companies in Hong Kong and at least 85,000 ex-pat Americans in the city. There are also upwards of 300,000 expat Canadians in Hong Kong as Hong Kong and Canada have a long relation. Could there be an exit? Given the chaos on the streets of Hong Kong and the importance of Hong Kong as a major business and financial center, pressure could also be emanating from the business and financial sector for a quelling of the chaos on the street. The Hang Seng topped back in January 2018 but the decline has been slow, off only 36.8% at the recent low in March.
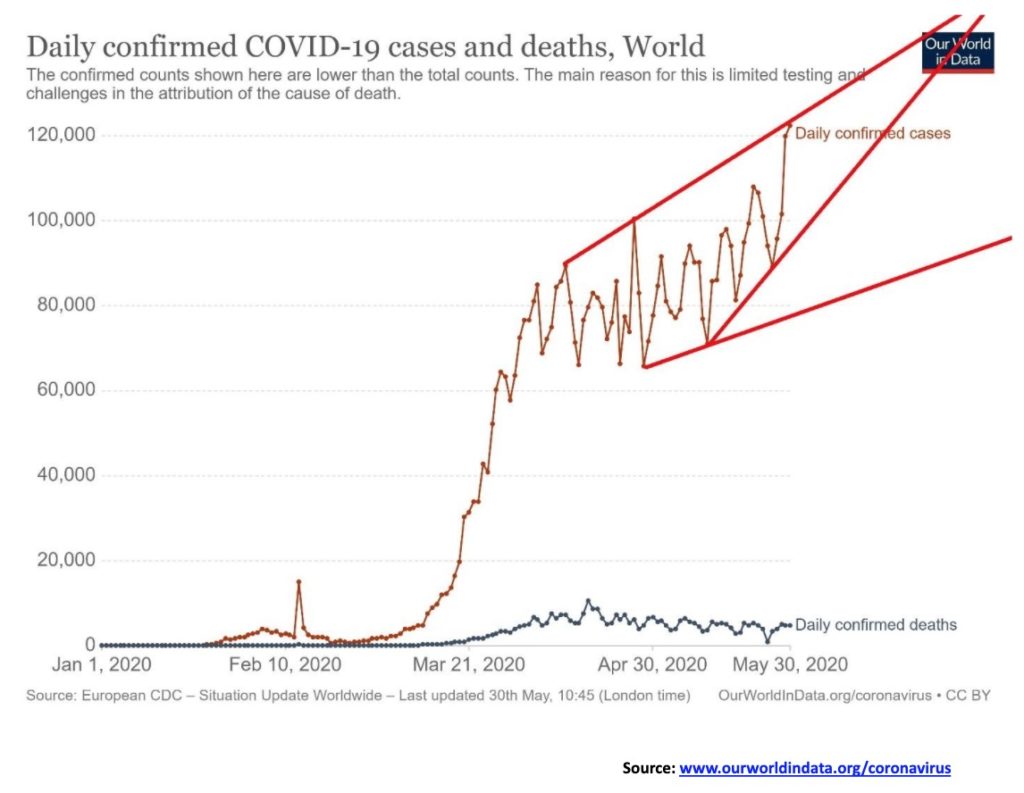
The number of COVID-19 cases just keeps on rising globally. But it is not the U.S. leading the way any more. Brazil has taken over that honour. Brazil now stands at number 2 behind the U.S. with over 500,000 cases. Also helping to push up the numbers are Russia, Pakistan, Bangladesh and Mexico. Others are also reporting elevated numbers. And in many of those developing countries the number of cases is most likely considerably understated. Best hope is maybe an ascending wedge pattern is forming. That could eventually result in a downside break.
World May 31, 2020 15:41 GMT
# of cases – 6,203,610
# of deaths – 371,855
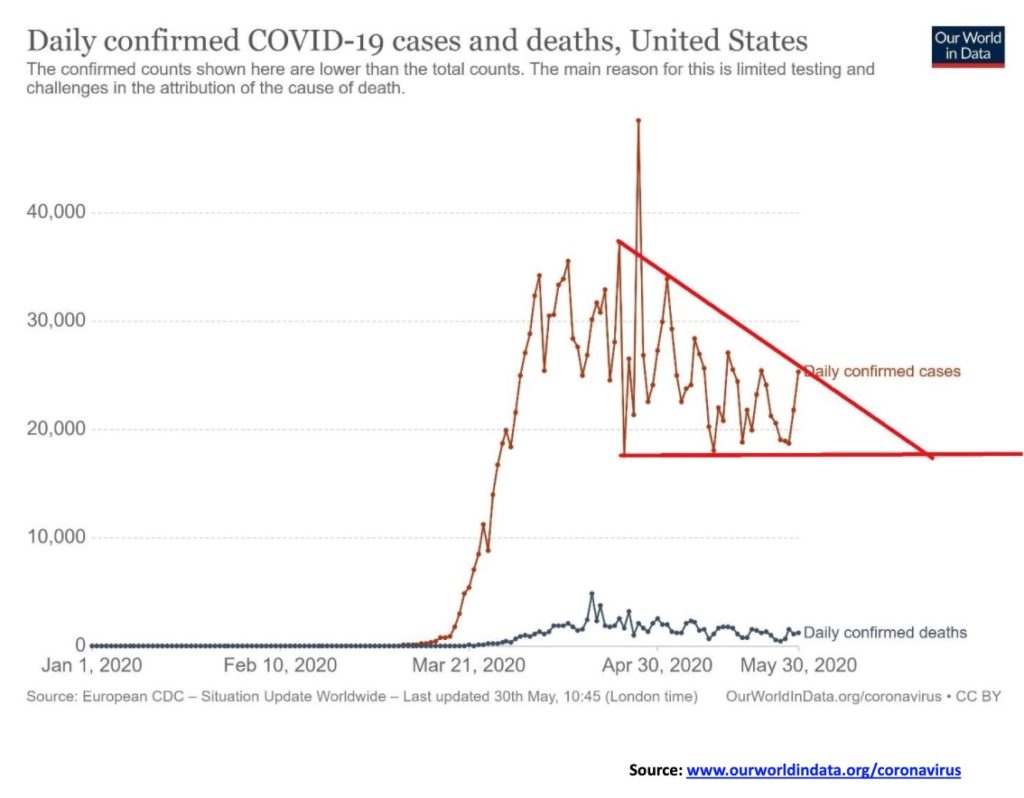
The number of cases in the U.S. remains on a downward trajectory. But it could also be poised to break out of that triangular descent. On the other hand, maybe it’s a descending triangle and they break to the downside. Let’s hope so.
U.S. May 31, 2020 15:41 GMT
# of cases – 1,819,807
# of deaths – 105,634
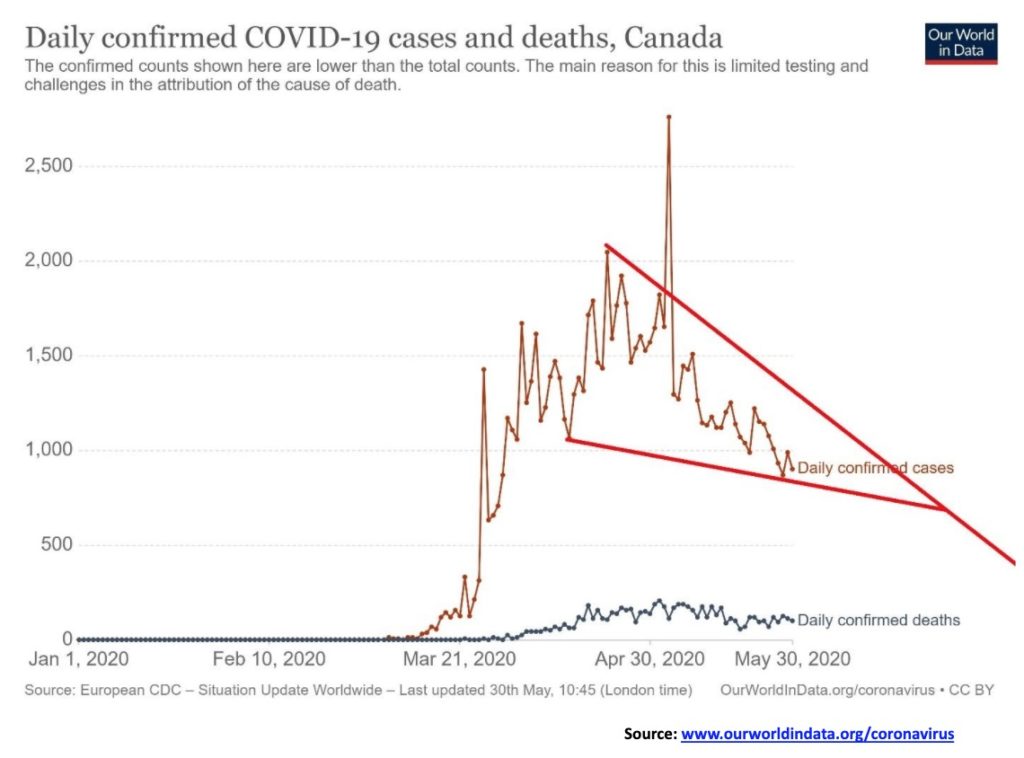
Canada is definitely on a downward trajectory. But we hope this isn’t a descending wedge (bullish) otherwise it could break soon to the upside. That wouldn’t be good.
Canada May 31, 2020 15:41 GMT
# of cases – 90,190
# of deaths – 7,073
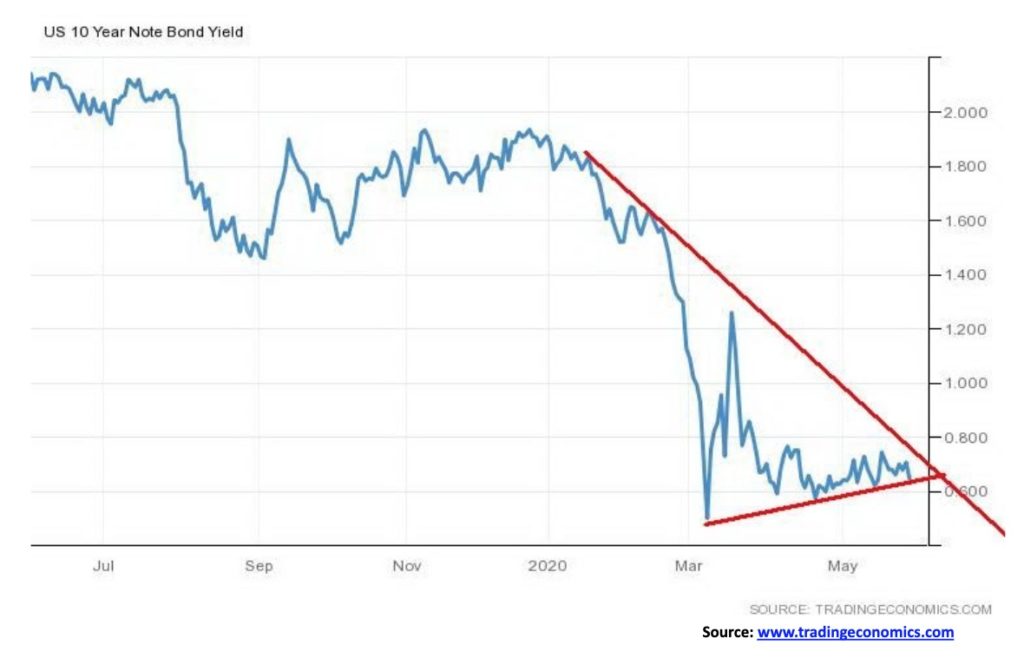
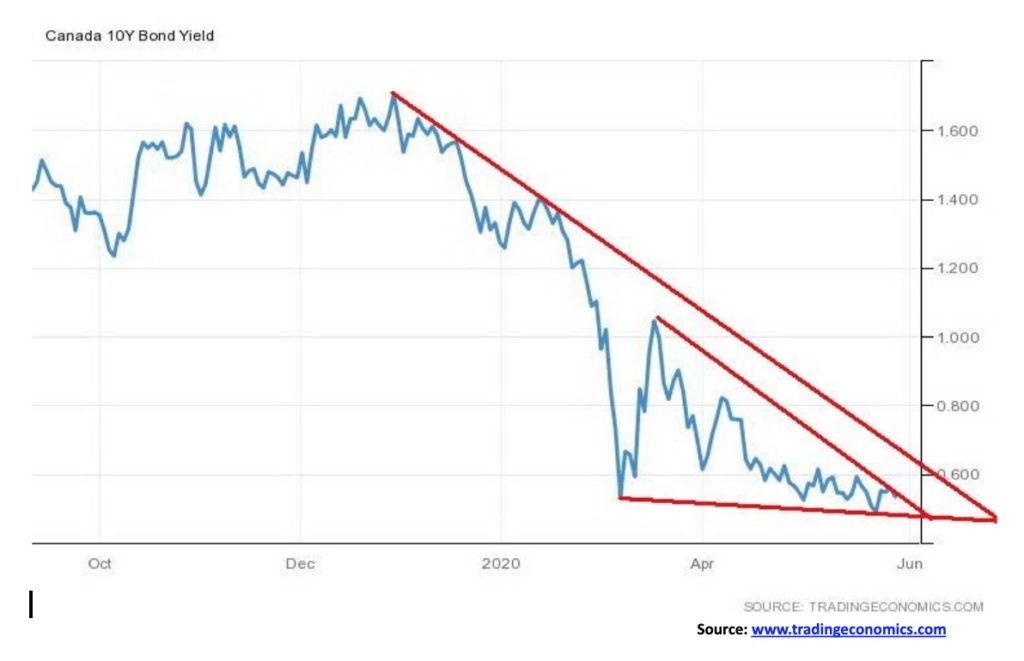
Interest rates continue to drag along at or near record lows. There was little movement in either the U.S. 10-year treasury note or the Government of Canada 10-year bond (CGB) this past week. The U.S. note closed at 0.65% off 1 bp on the week while the Cdn 10 year was up 2 bp to 0.53%. The economic numbers that we have already featured were dismal. Interest rates are not going anywhere, although they probably won’t fall much from here. There remain many who believe they will eventually go negative.
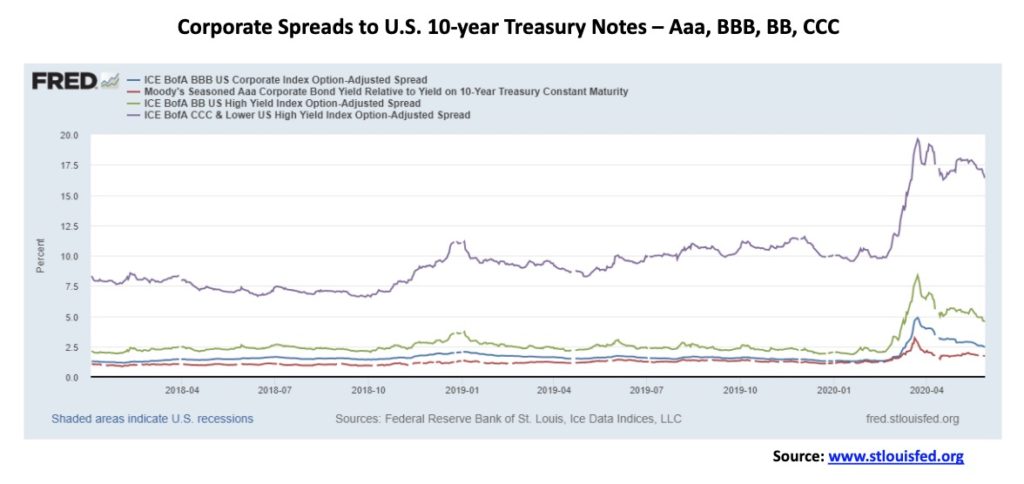
Given the largesse of the Fed backstopping the buying of corporate bonds as a part of its program, it is no surprise that spreads came in after initially rising sharply. We added in CCC-rated corporate bonds. They are the junkiest of the junk bonds. The spread on the CCC-rated bond rose to 19.47% over U.S. 10-year treasury notes at the recent peak but is now back down to 16.64% over. BB-rated bonds are the highest rating for non-investment grade corporate bonds and they are currently at 4.62% over, down from 8.37%. BBB bonds are the lowest rated investment grade and they are 2.48% over down from 4.88% over. Finally, Aaa bonds (the best) are 1.72% over, down from 3.20% over.
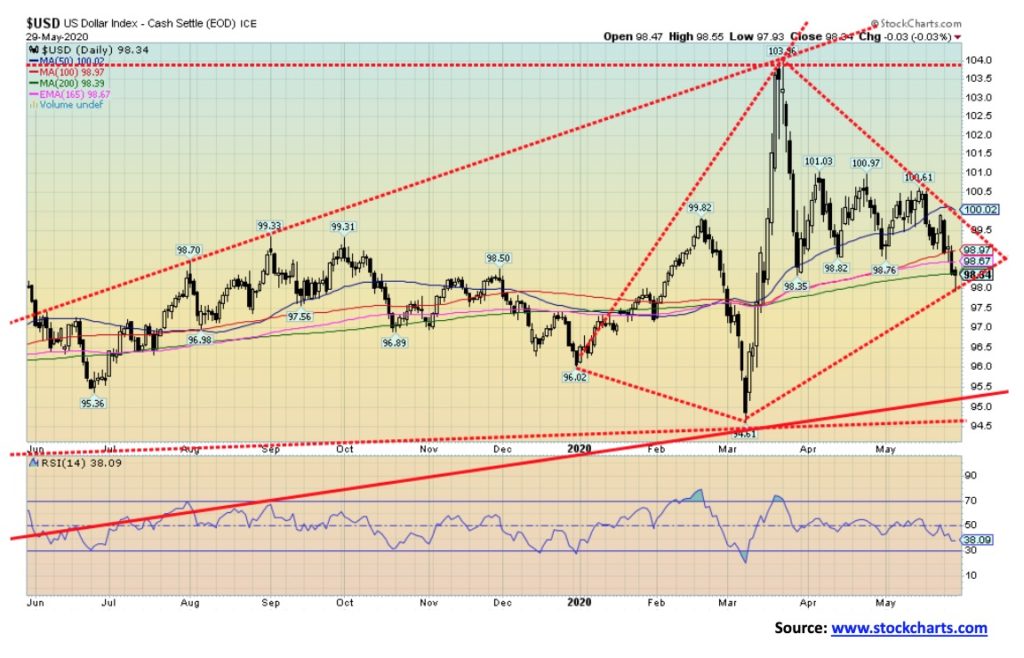
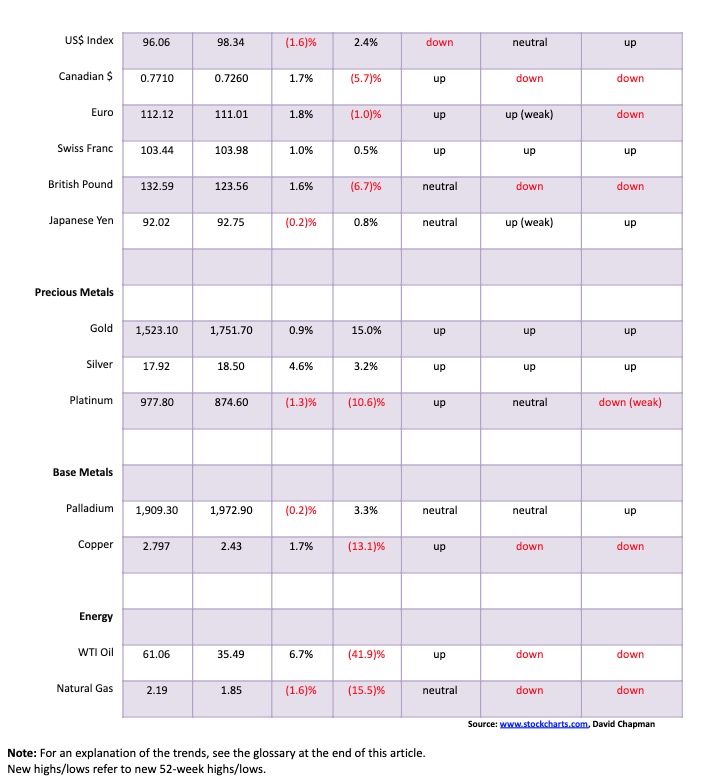
Is the breakdown of the U.S. dollar underway? The US$ Index fell 1.6% this past week as there seemed to be some fund flows out of U.S. dollars into currencies. Could it be repatriation of funds from the stock market? The euro rose 1.8%, the Swiss franc was up 1.0%, and the pound sterling gained 1.6%; however, the Japanese yen slipped 0.2%. The Canadian dollar gained 1.7% on the week thanks to higher energy prices. We continue to show what appears to be a large diamond formation on the US$ Index. The US$ Index fell to the 200-day MA this past week, penetrating just below it on Friday, and then rebounded back to close at the key MA. It left a hammer on the charts. The hammer Japanese candlestick indicator is the opposite of the hanging man we discussed earlier. It could be indicating at least a temporary bottom for the US$ Index. Follow-through to the upside this week would be key. With resistance up at 100, the US$ Index would need to surpass that level and move above 100.50 to suggest to us the diamond pattern is busting and that an upward move would be underway. A move above 102.50 could suggest new highs above 104. However, if the US$ Index returned to the downside and broke and closed under 98, then a further downward move would most likely be underway. It would take a move under 96.80 to suggest to us that the March low at 94.61 could fall. The US$ Index is at a crossroad here.
Given the growing potential for new trade conflicts or sanctions against China, gold rose this past week gaining 0.9%. Silver was a stellar performer up 4.6%. However, not confirming was platinum, down 1.3%, the gold miners with the Gold Bugs Index (HUI) down 4.1%, and the TSX Gold Index (TGD) down 6.6%. However, the bulk of the drop in the gold miners was seen earlier in the week and the two indices put in strong up days on Thursday and Friday. That silver made new highs for its current move and gold did not is another divergence we can note.
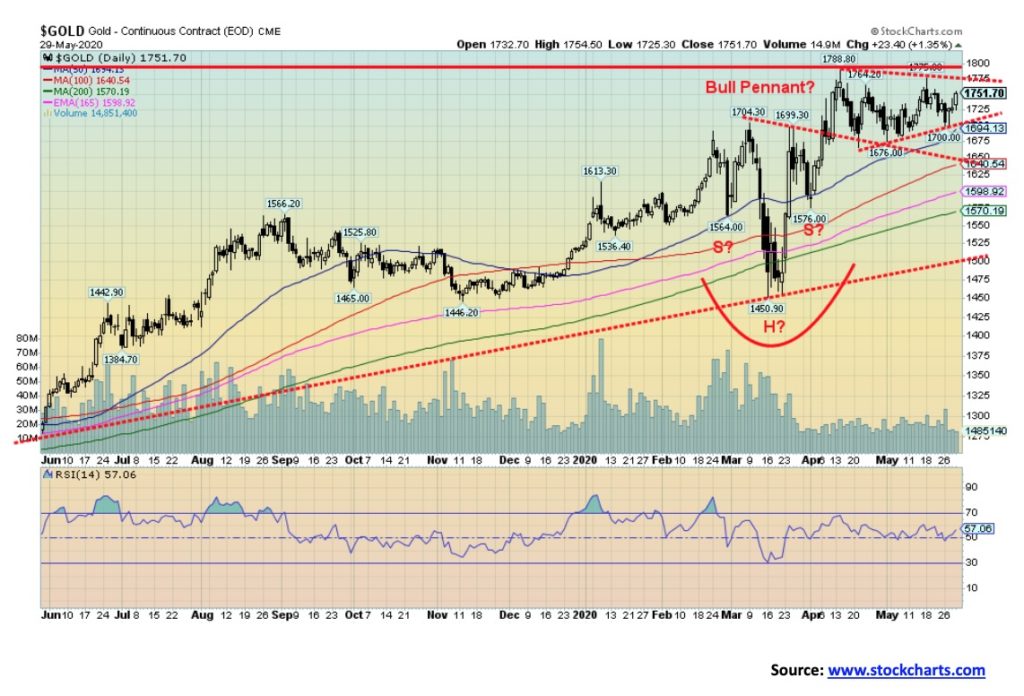
Gold has been in a trading range since hitting a high of $1,788 back on April 14. Since then we have making what appeared to be a bull pennant but now that is looking more like a symmetrical triangle. The low has been $1,676 while highs have been increasingly lower and lows increasingly higher. The question now is, which way will the triangle break? A symmetrical triangle can be either a consolidation formation or it can be topping formation. Key to the upside remains at $1,800. A firm breakout over that level could target to our head and shoulders pattern targets of $1,935–$1,950. A breakdown below $1,700 could target instead down to $1,585/$1,590. We note that the 200-day MA is currently at $1,570 and the 165-day EMA is at $1,598. A move down that far would also throw what appeared to be a head and shoulders bottom out. A breakdown under $1,575 could send gold lower and under $1,450 the March low it would be terminal and a bear market would be underway.
Fundamentally there is little reason for gold to fall, given the deteriorating economic situation, the threat of a resumption in the trade wars, the potential deterioration on the streets of the U.S. under protests, the huge amounts of money being thrown out by the Fed and Treasury to combat the negative economic effects of the COVID-19, and deteriorating global geopolitics. But logic sometimes is not a part of the equation. Gold is anathema to the central banks, even if they hold collectively some 34,000 metric tonnes as a part of their reserves. A rising gold price is not in their interest. On the positive side, recent pullbacks for gold have been met with strong buying. The fundamentals say gold should eventually break above $1,800, but one should be cognizant of the downside just in case things go awry.
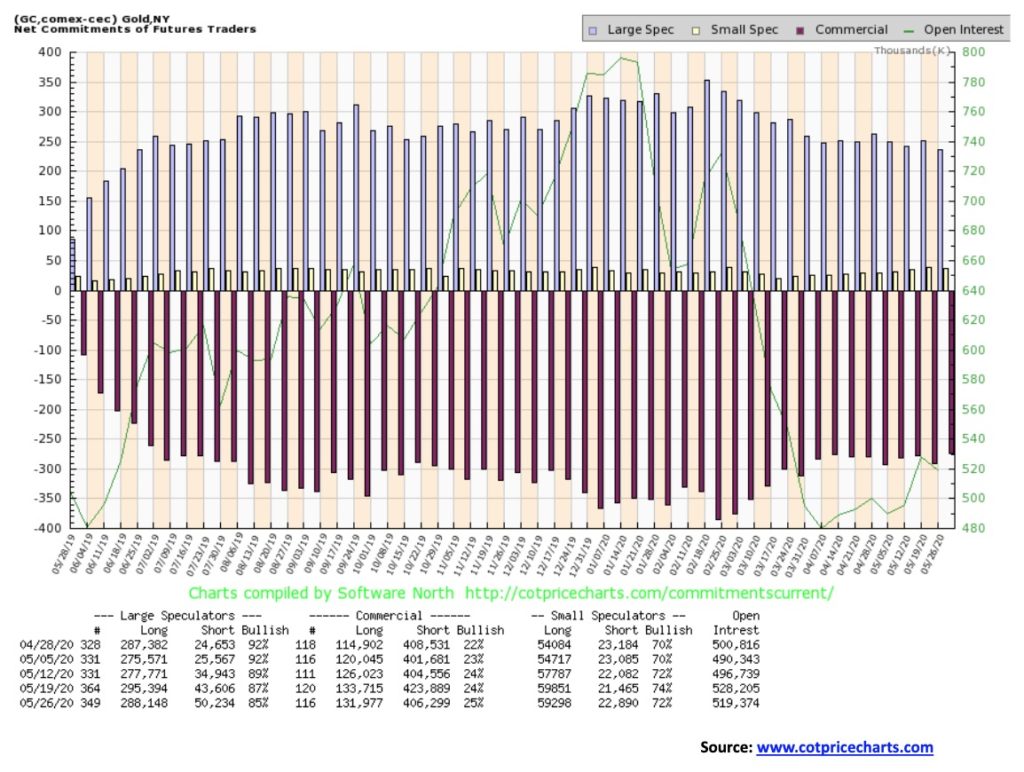
The gold commercial COT improved somewhat to 25% this past week from 24%. Long open interest however fell about 2,000 contracts while short open interest dropped almost 18,000 contracts. Overall, open interest was down. The fall in short open interest suggests short covering as opposed to fresh buying. The large speculators COT (hedge funds, managed futures, etc.) slipped to 85% from 87% as their long open interest dropped over 7,000 contracts and short open interest rose almost 7,000 contracts. The report is mildly bullish given the turn around on the commercial COT and the large speculators COT. But we wouldn’t exactly call this a really bullish report.
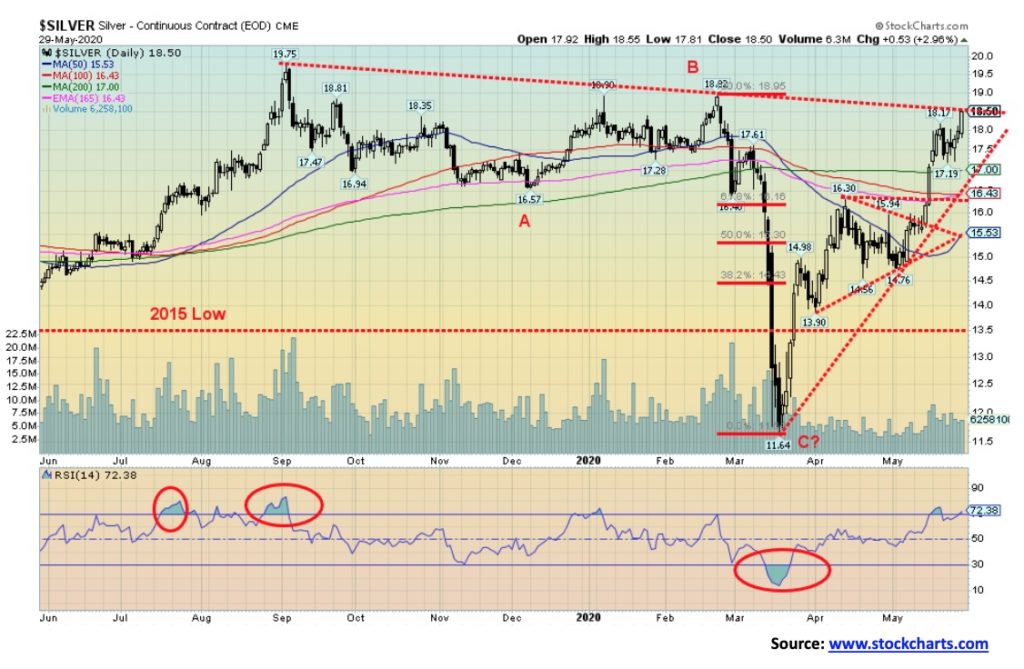
Silver enjoyed a strong week with a gain of 4.6%. Silver is now in the black for 2020, up 3.2%. Silver has been gaining some traction over the 200-day MA which is a positive development. Silver’s trends are all now pointed up, another positive development. A negative is the RSI is overbought at 72; however, overbought can remain in place for some in a strong up market. Silver now sits on the cusp of either failing here or breaking out to the upside. A move above $18.60 could suggest that silver will attempt new highs over $18.90 and over $19.75. Ultimate targets could be up to $26; however, we have to take that one step at a time and break through the other levels first. As well, there remains the 2016 high at $21.23. Looking even further back the 2013 high was at $25.12. The gold/silver ratio has now fallen under 100 down to 94.70. That is down from the all-time high at 131.40 seen at the silver low in March 2020. When the gold/silver ratio is falling we usually see a bull market in the metals. A rising gold/silver ratio is usually seen in bear markets. Friday’s upside thrust was quite positive. We expect we could see new highs above $19 shortly. Trouble would appear on a break under $17 and silver would break down under $14.75.
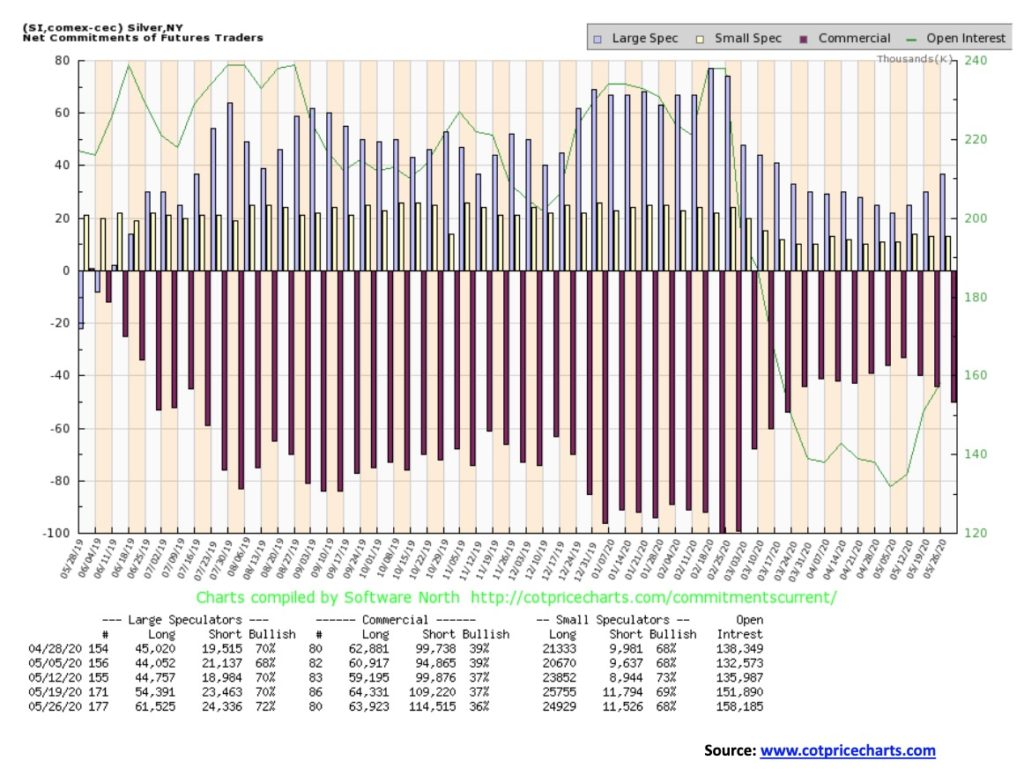
We suppose the silver commercial COT falling after silver rose this past week should not be a surprise. The silver commercial COT slipped to 36% from 37% this past week. Long open interest was down less than 500 contracts but short open interest rose over 5,000 contracts. The large speculators COT rose to 72% from 70% as they added over 7,000 contracts to long open interest but also about 1,000 contracts to short open interest. Overall, open interest rose as silver rose which is a bullish sign. We are friendly to silver going forward.
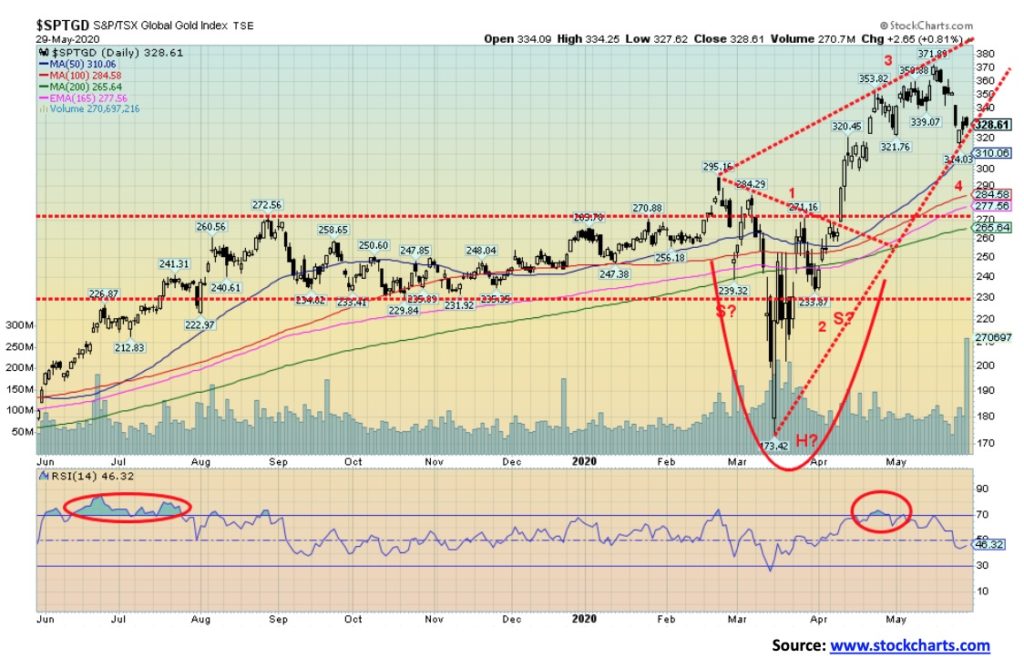
The gold mining stocks are diverging with both gold and silver and that has us a little concerned. Grant you, most of the damage was done early in the week when gold took one of its patented $20 plus drops and investors leaped in to take profits on their stocks. The Gold Bugs Index (HUI) dropped 4.1% this past week while the TSX Gold Index (TGD) was off 6.6%. They have been strong performers so even a 10% to 15% correction is not unusual for them in a rising market. The action this past week might be wave 4 up from that low seen in March 2020. The advance has been strong with the TGD, up 114% at the recent high in the space of two months. So with those kind of gains a pause should not be surprising. The question is, have we seen a low? Wednesday’s upside move was a positive development. Overall, the TGD fell 15.4% from its recent high, which, as we noted is fairly normal for the gold miners in a rising market. We saw more than a few corrections of that nature as the TGD gained almost 200% from October 2008 to September 2011. With a 100% plus move from the March low, a 15% correction appears normal. Key, of course, is that the rebound seen in the latter part of the week carries forward into the coming week. A break of 314 the low this past week could see the TGD fall further toward major support of the 200-day MA near 265. We’d consider a break under 300 as negative. To the upside there is resistance from 340 to the recent high of 371. The TGD achieved most of the target of 385 from the 173 low. A firm break over 400 would, however, project the TGD next up to 450/455. That is interesting as the all-time high in 2011 was 455.
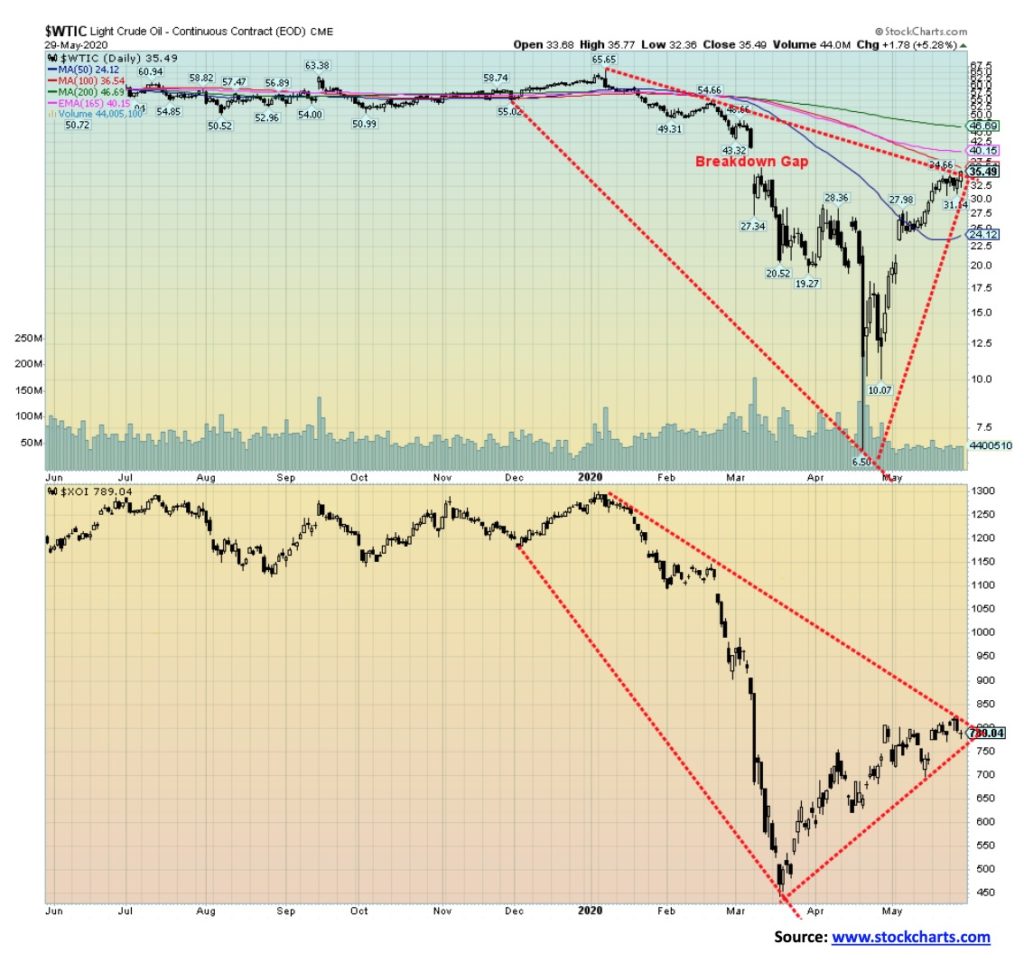
WTI oil prices rebounded strongly on Friday, gaining 5.3% on the day and saving the week from what might have been a down week. Oil rose 6.7% on the week and was up a record 88.4% on the month. Record supply cuts helped the record month after oil prices rebounded from sub-zero back in April. The energy stocks were not so good as the Arca Oil & Gas Index (XOI) rose a small 0.3% on the week while the TSX Energy Index (TEN) dropped 1.2%. Oil rallied strongly on Friday after Trump spoke and he didn’t tear up the U.S./China trade agreement as some were suspecting. It’s actually not in his interest to do so. Still, a potential purchase of $52 billion of energy sales over a 2-year period as a part of the trade agreement remains in doubt.
Oil prices are now running into a band of resistance that goes from $35 up to $45. No more supply cuts are going to come. But demand is not about to leap, although with the official start of what is known as the driving season now under way, there could be some rise in demand. But, typically, oil’s bullish period runs from December to June and then the summer doldrums start. An active hurricane season might help get prices to rise during a normally quiet time for oil and natural gas (NG). NG was down 1.6% this past week. Despite the big rally for oil it remains down on the year by 41.9%. Oil has support down to $30, but a drop back under $30 could see prices fall to better support near $24. Under $21 would could start to see some of the chaos we saw earlier when oil prices were falling from $65 to sub-zero from January to April.
—
(Featured image by Arek Socha via Pixabay)
DISCLAIMER: This article was written by a third party contributor and does not reflect the opinion of Born2Invest, its management, staff or its associates. Please review our disclaimer for more information.
This article may include forward-looking statements. These forward-looking statements generally are identified by the words “believe,” “project,” “estimate,” “become,” “plan,” “will,” and similar expressions. These forward-looking statements involve known and unknown risks as well as uncertainties, including those discussed in the following cautionary statements and elsewhere in this article and on this site. Although the Company may believe that its expectations are based on reasonable assumptions, the actual results that the Company may achieve may differ materially from any forward-looking statements, which reflect the opinions of the management of the Company only as of the date hereof. Additionally, please make sure to read these important disclosures.


From Confiscation to Cooperation: Funding Casa de la PAZ’s Social Transformation
A crowdfunding campaign on Produzioni dal Basso seeks funds to renovate a former drug-trafficking building in Cali, Colombia into Casa...


Bitcoin Surges Toward $110K Amid Trade News and Solana ETF Boost
Bitcoin nears $110,000 after a 3.5% daily gain, driven by U.S.-Vietnam trade news and the successful launch of a Solana...


Morocco Charts a Citizen-Centered Path for Ethical and Inclusive AI
The National Conference on Artificial Intelligence in Rabat united officials, researchers, and partners to shape Morocco’s ethical, inclusive AI strategy....


Cannabis Company Adopts Dogecoin for Treasury Innovation
A U.S. cannabis company is using Dogecoin (DOGE) as part of its financial reserves, aiming to blend innovation with flexibility....


Ripple Launches EVM Sidechain to Boost XRP in DeFi
Ripple has launched an Ethereum Virtual Machine (EVM) sidechain on XRPL, aiming to bring XRP into the DeFi space. With...
 |
|
 |  |
 |
|
-

 Impact Investing1 week ago
France’s Nuclear Waste Dilemma Threatens Energy Future
-

 Fintech7 days ago
Kraken Launches Krak: A Game-Changing Peer-to-Peer Crypto Payment App
-

 Africa2 weeks ago
Agadir Welcomes Nearly 570,000 Tourists by May 2025
-

 Impact Investing2 days ago
Europeans Urge Strong Climate Action Amid Rising Awareness and Support