Featured
Is the world in the early stages of a new secular bear market?
The oil market went through what may be its wildest week ever. The pandemic is dominating everything. We examine this week as to whether we are in the early stages of a new secular bear market vs. a corrective bear market. 2000-2009 was a secular bear market. 2009-2020 has been a secular bull market. The collapse into December 2018 was a correction within the context of a secular bull market.

“A recession is when your neighbor loses his job; a depression is when you lose yours.” —attributed to Harry S. Truman, 33rd President of the U.S. 1945–1953; 1884-1972. Also attributed to Ronald Reagan, actor and 40th President of the U.S. 1981–1989; 1911–2004
Reagan also tagged on to his quip “And a recovery is when Jimmy Carter loses his.” Well, it seems these days that not only did you lose your job but all your neighbors lost theirs as well. The U.S. tagged on another 4.4 million initial claims this past week, bringing the 5-week total to more than 26 million, wiping out all the job gains since 2008. That’s at least 16% of the total U.S. labor force. And, given all of those who were already unemployed, the unemployment rate (U3) could be at least 20% according to some forecasts by the time the April employment numbers come out on May 8, 2020. Some believe it will be even higher.
Canada is showing comparable numbers. Possibly even worse. According to reports, the government had received 6.73 million applications for assistance under the Canada Emergency Response Benefit (CERB). That represents potentially 30% of the entire work force. As one pundit described it, “that’s just mind-boggling.”
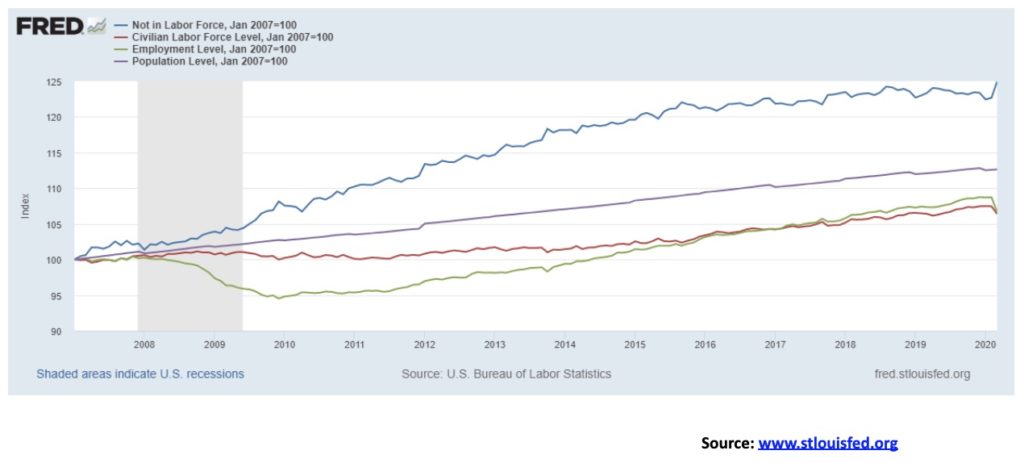
So, are we going to fall into a depression? The chart below is enlightening. What it shows is that the number of people not in the labour force in the U.S. has increased 25% since before the start of the “Great Recession” in 2007. There are now 103.5 million considered to be not in the labour force. Of that total 54.8 million are retired and 9.9 million are disabled. That still leaves potentially 38.8 million looking for work, although some proportion of that are full-time students. Except that students are not exactly attending school these days. The total for those not in the labour force has jumped over 10 million in the last month or so. On the other hand, the civilian labour force has gone up by 6.4% in the same period and is falling. The employment level is up 6.7% but it also is falling while the population total is up 12.6%. The population total is the noninstitutional population level defined as those 16 years of age and older not currently in an institution; i.e., prison, mental facility, or home for the aged.
So, are we headed for a depression as some claim? Evidence suggests it is real possibility. Unemployment is, as they say, “off the charts.” Some economists are predicting that the unemployment rate could hit over 30%. That is higher than it was at the peak during the Great Depression. The service economy in both countries, which makes up about 70% of the economy in terms of employment, has been walloped. Retailers, restaurants, bars, and more have been devastated. But now the layoffs are extending to white collar workers in companies because their volumes are down sharply. Car sales have plummeted in North America and the EU. And we note now that house listings and sales are also plummeting. Is it a matter of when, not if house prices start to fall? Consumer confidence is falling off the map. The Consumer Confidence Index in the U.S. has fallen to 71 in April from 89.8 in March and 101 in February. In Canada it’s worse. April Consumer Confidence was at 35.6 vs. 53.0 in March and 54.0 in February. That’s the lowest level in over a decade.
All of that suggests that the consumer can’t carry the economy and the consumer makes up 70% of the economy. As a result, income is “cratering.” If people can’t pay their rent, it reverberates onto the landlord and then he too is in trouble. Thousands could be pushed onto the street homeless and destitute, despite efforts to put money into people’s pockets. Many, however, will fall through the cracks. Most people have very little in the bank and have lived pay check to pay check. People are hoarding food and use of food banks is already starting to rise. Worse, soup kitchens and even food banks have been forced to close as well, some because they can’t get deliveries. Most food banks are operated by volunteers, many of them seniors who are now reluctant to show up. As to food itself, meat plants are closing because of outbreaks and warehouses that sort and move food are under increasing pressure. If an outbreak occurs there, one could see shortages show up at the retail grocery level.
The entire retail sector could be hemorrhaging. In the U.S., Marcus Nieman is filing for bankruptcy. But right behind them could be J.C. Penny, Macy’s, and Nordstrom. In Canada, retailers Pier 1 Imports, Carlton Cards, and Forever 21 have already closed their doors. But others potentially in trouble are Gap, Home Outfitters, Bouclair, Zellers, and even The Bay. There are many more. Malls could become ghost towns especially if they lose their anchor tenant such as The Bay. Large commercials have defaulted on their April rent which is beginning to reverberate through REITS; residential REITS less so.
More people working from home adds up to more potential problems for the commercial real estate sector. That also translates into fewer cars on the road which could transfer negatively onto the automobile industry—and the energy sector is already on its knees with rising bankruptcies. But grocery stores are doing well and so should delivery services and, given everything going on, robotics, biotech, and pharmaceuticals should do well. But if anyone thinks we are going to go back to the way it was before this unprecedented shutdown they should probably give their head a shake. A V-shaped recovery is most likely out of the question and so is a U recovery. More likely an L, or a weak W.
Have we entered your “garden variety” bear market or have we entered a secular bear market? We believe it’s most likely the latter. If that’s correct, then this would be the third secular bear market since the Great Depression. The first was 1966–1982 and the second 2000–2009. But bear markets are not just a straight down affair. There are primary bear and bull markets during the secular bear phase. Similarly, there are primary bear markets during a secular bull market. The just-completed secular bull 2009-2020 had three bears of some note: 2011, 2015–2016, and 2018. The worst one was the 2018 bear that actually fell the roughly 20% requisite definition of a bear market. Some believe this drop is just another primary bear within the context of the secular bull market.
The 1966–1982 bear had five bears: 1966, 1968–1970, 1973–1974, 1976–1978, and 1981–1982. It also had four bulls: 1966–1968, 1970–1972, 1974–1976, and 1978–1981. The 2007–2009 secular bear was made up of two bears and a bull: bears 2000–2002 and 2007–2009; bull 2002–2007. Even the Great Depression/War years were made up of four bears and three bulls. The bears were 1929–1932 (the big one), 1937–1938, 1939–1942, and 1946–1949 (the shallow one). The bulls were 1932–1937, 1938–1939, and 1942–1946.
While the bear moves are steep—53.8% down for the Dow Jones Industrials (DJI) 2007–2009—the bulls can be equally spectacular, with 94.4% DJI 2002–2007. Typically, they define a bear market as a 20% drop. The recent drop qualified, given the 38.4% drop for the DJI from Feb 12, 2020 to Mar 23, 2020. But what would make this the start of a secular bear as opposed to your garden variety bear?
The sixth tenet of Dow Theory states that “a trend is assumed to be in effect until it gives definitive signals that it has reversed.” It is not necessarily easy to discern whether it is a normal secondary correction vs. the first leg of a new trend in the opposite direction. Even technical analysts don’t agree about that. An uptrend is a series of higher highs and higher lows. A downtrend is a series of lower lows and lower highs. Until a previous low is broken, the trend remains up and vice versa; i.e., until a previous high is broken the trend remains down. There are short (daily or even intraday), intermediate (weekly), and long (monthly) trends. We also use very long (yearly).
When a previous monthly low is broken or, better, previous yearly lows are broken, then we believe that a trend has shifted; in this case from a secular bull to a secular bear. The best case we could find was the 1987 crash that saw the DJI fall 36.1% from August 25, 1987 to October 19, 1987. It was a drop comparable to the drop we just witnessed.
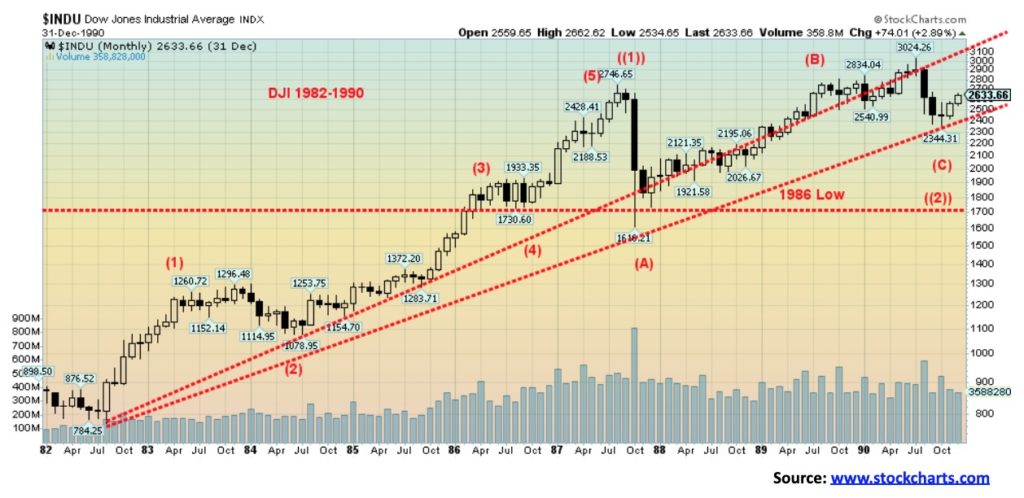
Our monthly chart below shows the DJI from 1982 to 1990. 1982 proved to be the final low of the 1966–1982 secular bear market. The first wave up was from 1982 to 1987. It rose in five waves with two corrections along the way in 1984 and a pause in 1986. The 1987 stock market crash did take out the low of 1986 and at the time many were calling for a major bear market and even for another Great Depression. The crash also broke the uptrend that had been in place since 1982.
Yet the wave proved to be merely a correction within the context of a bear market. October 19, 1987 was the low and the drop never closed under the 1986 low on a monthly basis. The wave turned out to be the A wave of an ABC correction flat that made a higher low for the C wave in 1990 to complete wave 2. The market then embarked on wave 3 up that topped in 1998 when the fourth wave kicked in during the Russian/LTCM collapse. Wave 5 topped in January/March 2000. The 1987 crash proved to be a secondary correction within the context of a secular bull market that lasted from 1982 to 2000.
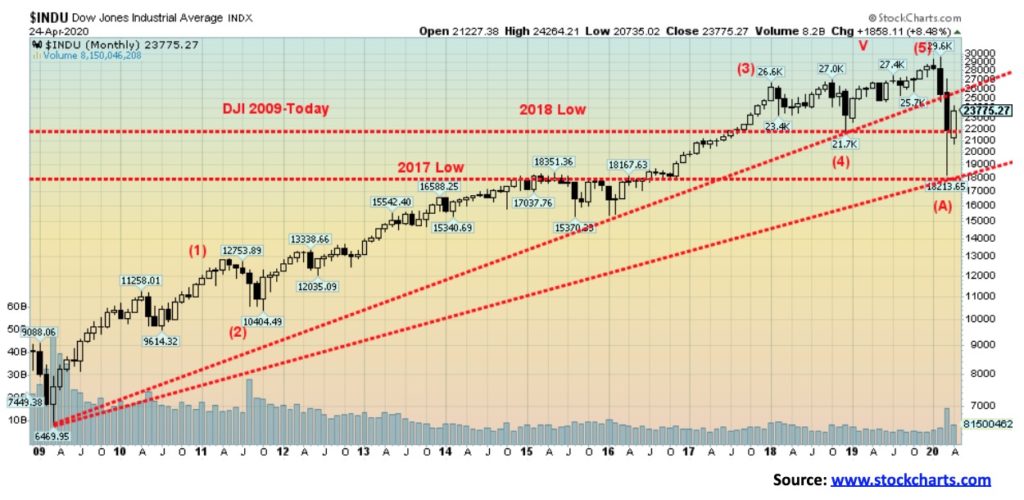
While today’s situation appears comparable to the 1987 crash, there are some significant differences. As with the 1987 crash, we broke under the 2019 low and we also broke under the 2018 low although we didn’t close under that low. We did, however, close under the 2019 low, something the 1987 crash did not do as it never closed on a monthly basis below the 1986 low. The 2020 crash almost broke the 2017 low as well. This, we believe is a far more serious crash than what we witnessed in 1987.
The top in February 2020 was not only the top of a five-wave advance from the 2009 low but it was also the top of a five-wave advance cycle advance from the Great Depression/War. Cycle wave 1 was 1949 or some say 1942 or 1946 to top in 1966. Cycle wave 2 was the secular bear from 1966–1982. Cycle wave 3 was 1982–2000 and cycle wave 4 was the secular bear 2000–2009. The final and fifth wave was 2009–2020. It would appear we may have completed a major super cycle to the upside 1949–2020. What follows is a super cycle wave to the downside. The last super cycle wave down was 1929–1949.
It is interesting to note that while the DJI did not close below its key yearly lows, the TSX Composite did as it closed below the 2017, 2018, and 2019 yearly low. That signals to us that this is not your secondary correction but the start of something potentially more long-lasting. It is not as yet conclusive that this is the start of a new secular bear market; however, given the evidence so far, the odds suggest that we could be in the early throes of one. What would end the potential for a longer-term bear market? New sustained highs above the February 2020 high. During the long 1966-1982 bear there were a number of occasions when the bull rally took out a previous year’s high, however, none were sustained and the take outs were generally 5% of less.
One of the key drivers of the 2009–2020 bull was companies buying back their own stock. It was a massive debt-for-equity swap with many financing the buyback with debt. It is estimated that the buybacks added upwards of 1,000 points to the S&P 500 alone, according to economist David Rosenberg of Rosenberg Research. Going forward, stock buybacks are most likely not going to be a major factor as companies’ profit margins are squeezed, given the magnitude of the current collapse.
Adding to the woes is the potential for a housing market crash. Sales have plunged and while prices have wavered, falling slightly, they have not as yet crashed. We note that some $14 billion was pulled out of mutual funds over the past month. Those funds are not likely to come back any time soon. People are going to be more cautious, even if we were told we could be back to normal tomorrow. That, however, is highly unlikely; while there is some evidence the number of cases is plateauing, there is little evidence they are actually declining.
Pensions could be negatively impacted, depending on the losses for pension funds. The baby boomers who have been a major driver of the markets are now 65 or older. Back at the time of the 2008 financial crisis, they were only 54. Economic growth was feeble during 2009–2020 despite historic ultra low interest rates, trillions in QE and trillions in new debt. Going forward, it is likely to be even more feeble. Our expectations are that, at best, we are looking at what Japan has been going through since 1990 with anaemic growth, despite trillions of dollars in stimulus and years of ultra-low interest rates. In other words, the velocity of money is no longer working, nor has it for years. We explain that later. Conservative savings will take precedence over investment in the stock market and even spending.
Going forward, we would expect that interest rates will remain low for years, not dissimilar to what they have been for the past thirty years in Japan. Yet it won’t spur investment. Negative real yields are probably here to stay for quite some time. The question is, what could the massive growth in debt do to interest rates? If the debt is purchased primarily by the Fed or, in Canada, by the Bank of Canada, interest rates are liable to remain low. We are witnessing a massive deleveraging of the economy, which leads to financial collapse, endless low interest rates, and endless QE. QE will actually have little effect as the money will be hoarded, not spent. Most bond purchases from banks wind up as reserves held at the Federal Reserve, not funds used to lend or for investment. Credit conditions have tightened considerably and, with banks facing unknown losses, they are reluctant to make new loans.
In the stock market, selective sectors will do well. And gold should do well as it offers safety and is negatively correlated to both stocks and bonds. However, that doesn’t mean that gold won’t go through shakeouts. Over the next few years, we are expecting the 23–25-year cycle to occur (last seen in 2001). But before that a blow-off could be seen. Gold is the central banker’s antithesis.
While the coronavirus appears to be leveling out, it is leveling out a high level. There is a rush in some U.S. states to open up again. Oddly, even Trump does not agree with that. There have been armed demonstrations in a number of U.S. states against the lockdown (civil disobedience). Do they turn violent? Despite the desire to open up again, the odds do not favour much movement in that direction until at least the end of May. The trouble is that the spread and severity of the coronavirus are difficult to predict.
A U.S. government study suggests the coronavirus could last up to 18 months or longer and come and go in waves. There is no clear path as yet to a vaccine which could still take months to develop. In the interim, the economy is on its knees, unemployment is soaring, supply chains are broken, and shortages could develop while bankruptcies, homelessness, and even violence could rise. We are also seeing the potential for shortages in the food sector. Farmers are plowing crops under because it is cheaper than suffering losses bringing them to market. Because of the collapse of tourism and restaurants, demand has actually fallen. There are reports as well of farmers slaughtering chickens and pigs. There is a looming solar minimum due around 2022 and we could actually see a global cooling. The world has also been suffering with droughts and in Africa, a plague of locusts. Historically periods of cooling are associated with droughts and pandemics.
Despite throwing billions, even trillions at the problem, at best all it’s going to do is try to keep things somewhat afloat. And even if things opened up tomorrow, it could take months to see some improvement in the job’s pictures. The longer it goes on, the worse it gets. There are no easy solutions.
We leave with recent thoughts from George Friedman of Geopolitical Futures. George’s key points are:
- Recessions are a painful but necessary part of the business cycle. They cull weaker businesses and shift capital and labor to better uses.
- Depressions are economic events created by non-economic exogenous forces, such as wars or disease.
- The measure of a depression is the extent to which it destroys hopes and dreams.
- The last U.S. depression in the 1930s arose from war and was solved by war.
- Depressions create desperate people hungry for everything, especially some hope for a future.
- The coronavirus has similarities to war, such as the state mobilizing people and diverting them from work.
- The world doesn’t go back to what it was after a depression. A mild one will make people change their dreams, but they will at least still have dreams.
We are probably not at the bottom yet. We can’t yet say we are in an economic depression, but the evidence doesn’t look good so far. As Freidman writes, solving the coronavirus is a technical problem. The question is, what price will the political system decide we should pay? And for how long do we accept the solution?
George Friedman’s article can be found here:
https://geopoliticalfutures.com/recession-and-depression/
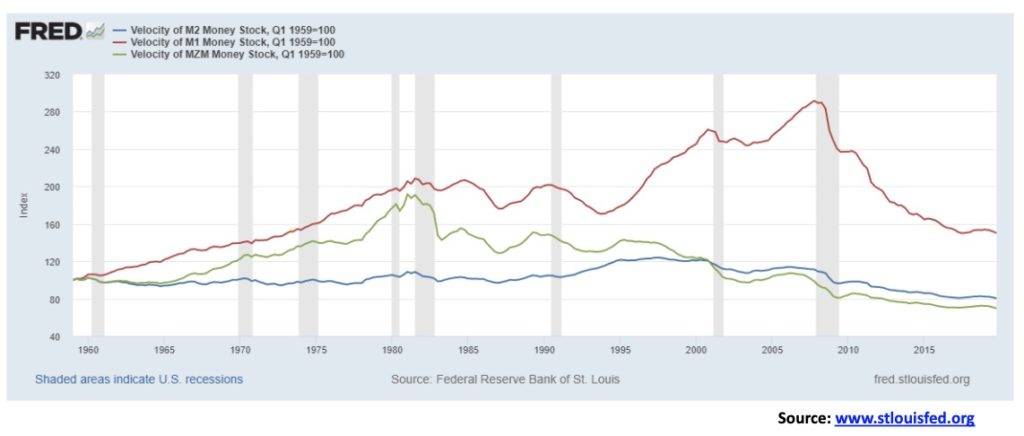
The velocity of money is the rate at which people spend. Velocity of money also closely resembles the rate at which credit is formed in the economy. When the velocity of money is high, it is changing hands faster to purchase goods and services. When it is low, it is more likely the money is going for investments and savings. The more people borrow, the higher the velocity of money as that money is used to purchase goods and services. But if instead it is going into investments, then that does nothing for the velocity of money. Think of velocity of money as the rate at which money turns over in the economy.
The formula for velocity of money is simple: VM = PQ/M where PQ is nominal gross domestic product (GDP)—i.e., the purchase of goods and services in the economy—divided by M = money supply. There are three measurements of money supply. M1 is the amount of currency in circulation; i.e., treasury notes or bills, coins, cash, demand and chequing accounts, traveler’s cheques, etc. M2 is M1 plus all savings, money market accounts, and time deposits. MZM is M2 less any time deposits plus all money market funds. MZM wants to measure everything that might be available for spending in the economy. There is also M3 which is M2 plus large time deposits, institutional money, and repos.
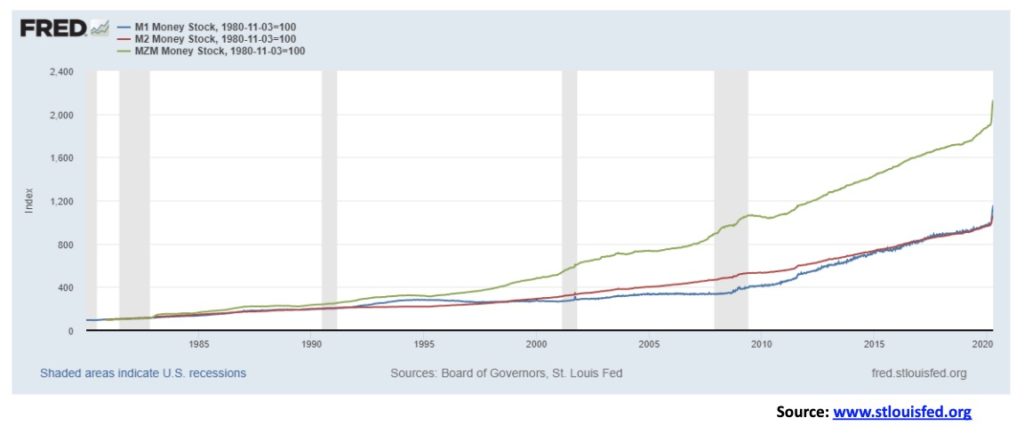
Money supply has exploded upward. Since early March, all three measurements of money have exploded upwards by roughly 15%. But, as we have seen since 2008 for M1 and dating back into the 1980s and 1990s for M2 and MZM, money is not being spent. There has been considerable monetary formation but it is not being spent or, should we say, it is not being spent at the rate it used to be spent. That helps explain the anaemic GDP since the 2008 financial crisis. Despite a huge jump recently in money supply, this money is most likely being hoarded or even used to pay down debt.
All of that bodes poorly for the economy going forward. And it helps to explain why inflation remains low because there is nothing to help push up prices. So, no matter how much money you throw at things, it is unlikely the money is going to be spent. And that will help keep interest rates low. As well, if people stop borrowing (a form of money creation) that will also help push down the velocity of money because once again money not borrowed is money not spent.
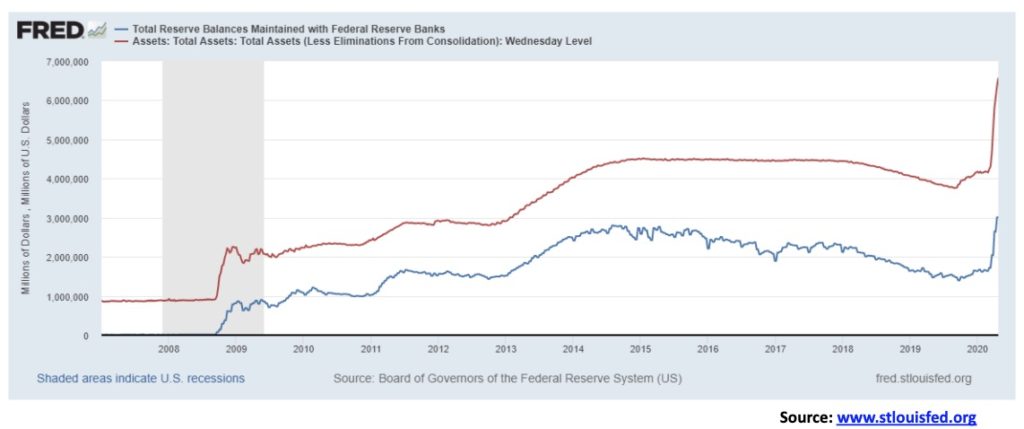
Two more charts. The amount of reserves held by banks with the Federal Reserve has exploded since September 2019. That was when the Fed started its repo program. Add in the bond buying since the coronavirus pandemic struck and the amount of reserves held has exploded upwards as has the Fed balance sheet. The amount of reserves held by the banks has leaped by 114% since September 2019 while the Fed’s balance sheet is up only 73%. Higher reserves tells us the money is being set aside. It is not being lent out into the economy. Nor, it seems, is it fully finding its way into the stock market in speculation. At least not yet.
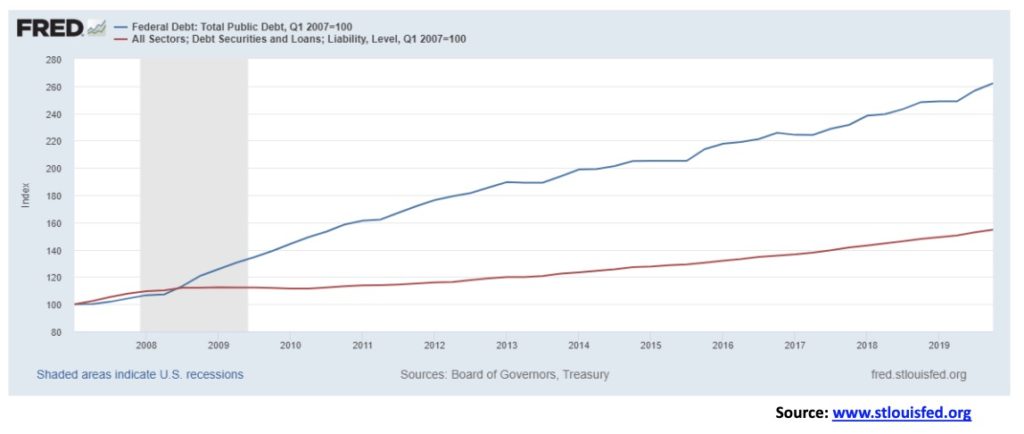
This final chart below shows how debt has exploded. Again, since 2007 total borrowings (government state, muni and federal, corporations, and consumers) are up roughly 155% since 2007 at the start of the 2007–2009 financial crisis. On the other hand, government debt has exploded upwards by 262% and for the U.S. Federal government now stands at $24.5 trillion and climbing. There is lots of money but it’s going nowhere and doing nothing. If it feels like we are standing still, we are—and it appears as if we will soon be regressing.
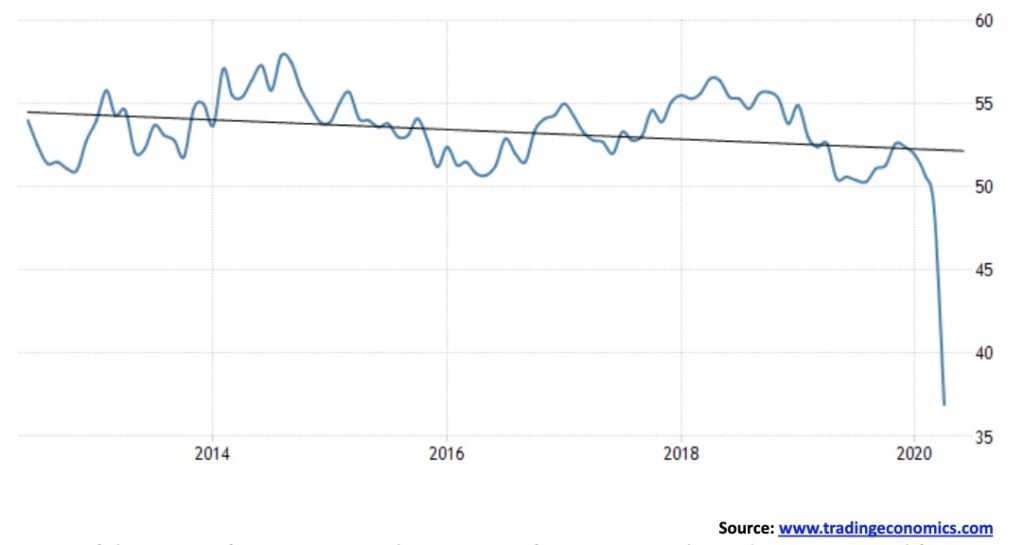
A picture of three manufacturing PMIs. The U.S. manufacturing PMI plunged to 36.9 in April from 48.5 in March. It was below expectations of 38. It is the sharpest decline seen in 11 years and reflects the sharp drop in orders, both foreign and domestic. Production sunk at a record pace in April, given factory closings and stay-at-home orders. Confidence is also falling. Any reading below 50 signals recessionary conditions.
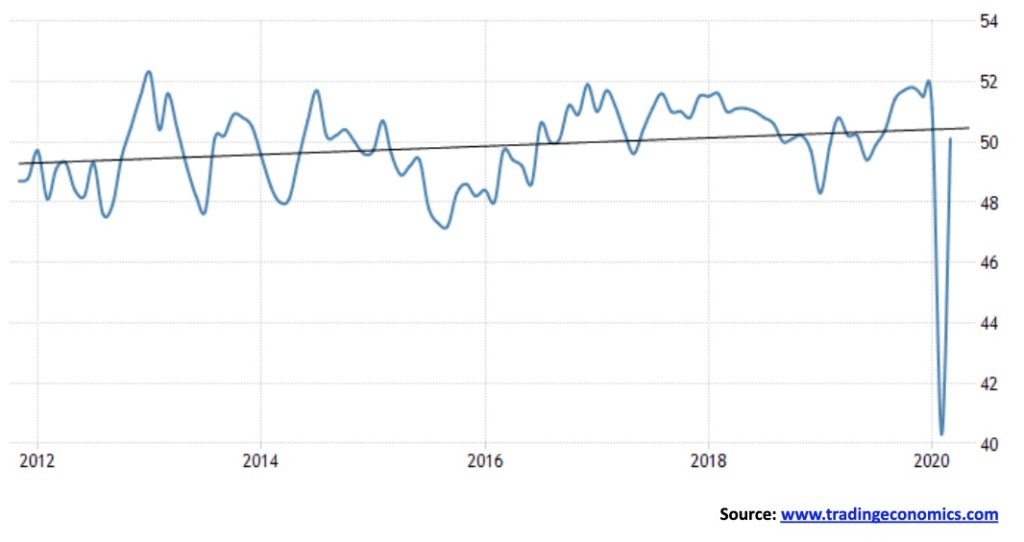
The Chinese manufacturing PMI jumped back up in March 2020 to 50.1 from February’s record low of 40.3. It easily beat consensus. It signals improvement in the Chinese economy following the shutdown and travel restrictions that were seen in February because of the coronavirus. However, we learn that demand is weak with new orders falling and export sales falling rapidly. Employment has also fallen sharply. Supply chains remain under pressure. But, oddly, firms remain optimistic that things will pick up once the restrictions are off. They had better not have a relapse.
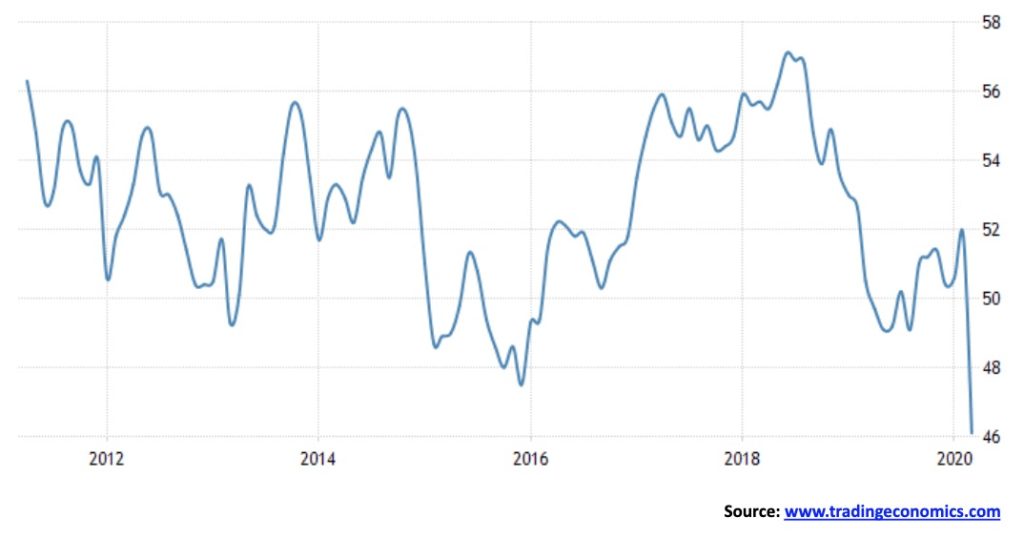
Finally, Canada’s PMI fell to 46.1 in March from 51.8 in February. The April figures are not out yet and we expect to see a further fall in the PMI. There was a big drop in operating capacity as well due to low demand given the emergency health measures because of the coronavirus. New orders fell at their fastest pace ever, and export sales were also falling as firms responded to lower demand and reduced production. Costs were up due to the fall in the Canadian dollar.
Overall, not a great picture for manufacturing in any of the countries, even China despite the bounce back. The eurozone manufacturing PMI was also sharply lower in April to 33.6 from 44.5 in March. The number came in sharply below expectations. All are showing recessionary conditions although technically China recorded a reading marginally above 50. But our expectation is it was feeble growth. We’ll watch for China’s April numbers with interest.
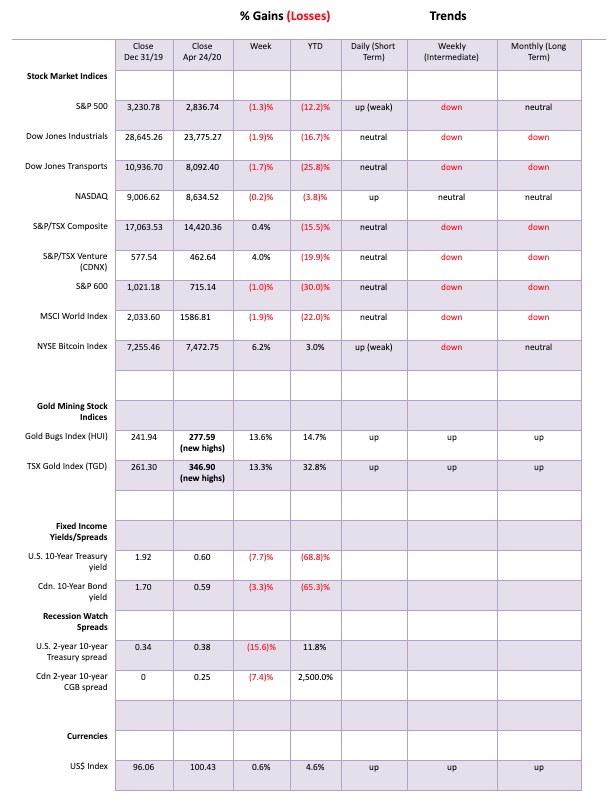
After rising for four of the past five weeks, the S&P 500 faltered this week, falling 1.3%. Other markets also fell. The Dow Jones Industrials (DJI) was down 1.9%, the Dow Jones Transportations (DJT) dropped 1.7% and remains down 25.8% on the year, while the NASDAQ fell only 0.2% and has been the best performing index, down only 3.8% so far in 2020. The S&P 600 small cap continues to be quite weak, falling 1.0% and remains down almost 30.0% in 2020. Here in Canada the TSX Composite bucked the trend, rising 0.4% and the TSX Venture Exchange (CDNX) is the star, up 4.0% even as it is still down 20.0% in 2020.
Overseas the London FTSE was up a small 0.1%, the Paris CAC 40 dropped 2.4%, the German DAX was off 2.7%, China’s Shanghai Index (SSEC) was down 1.1%, while the Tokyo Nikkei Dow (TKN) was up 0.7%.
Overall, the picture remains bearish for the stock markets. Given the damage caused by the closing of the global economy in order to deal with the coronavirus, the odds of a recovery any time soon are slim to none. While a number of states are saying they are going to open, when they do, this might turn out to be a classic buy the rumour (they are going to open) sell the news (they did). There is expected to be a sharp drop in earnings growth in 2020 of at least 14%. The potential for defaults in the corporate bond market remains very high with even the possibility of sovereign defaults. Despite the phase one deal signed in January with China, trade tensions remain high. There remains geopolitical risk with tensions with North Korea and Iran; as well, the U.S. and China continue to snipe at each other, although a military clash is out of the question. Helping the stock markets are the massive stimulation packages, the fourth one passed this past week for $484 billion. Ultra-low interest rates are probably here to stay.
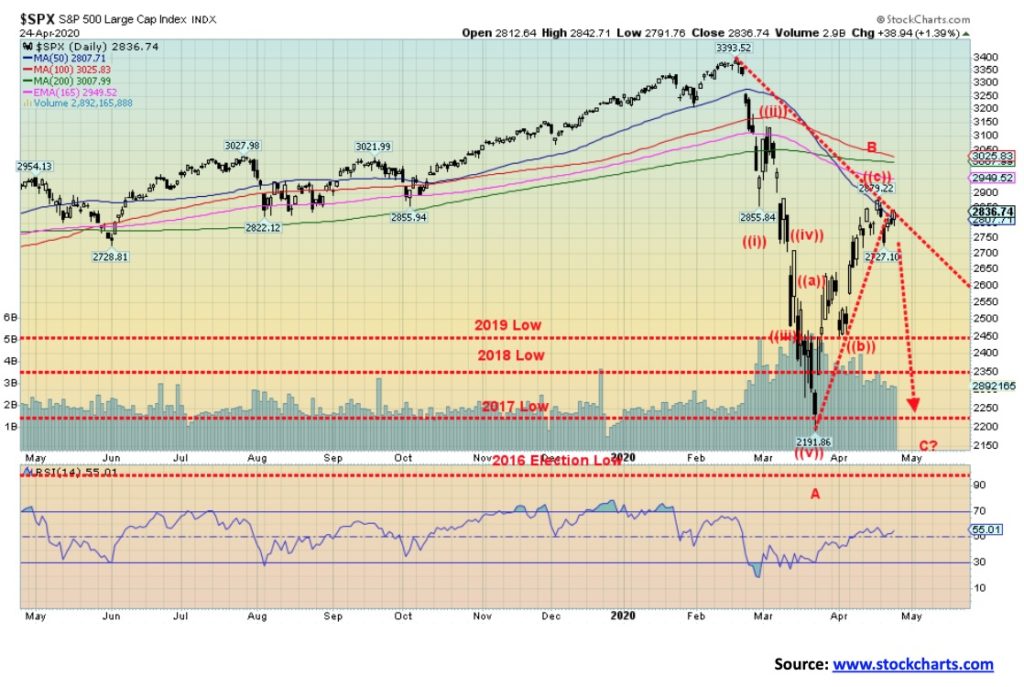
The S&P 500 has stalled out at the 50-day MA and between the 50% and 61.8% retracement levels of the entire drop. There is considerable resistance between 2,800 and 3,000 for the S&P 500. Above 3,000 things begin to look up. Above 3,100 new highs are possible. The S&P 500 broke below uptrend support earlier in the week and now seems to be testing up to that resistance zone. Strong buying early in the day seems to be being met with selling later in the day. That to us is a sign of a weak market. The move since the low on March 23 appears to have unfolded in an ABC-type manner, signaling a corrective move only.
The fall from the high appears to have fallen in 5 waves, suggesting an impulse move to the downside. As we have noted, we broke both the 2019 and 2018 lows and briefly penetrated the 2017 low, coming perilously close to the 2016 election low. That we closed under both the 2018 and the 2019 low suggests to us that we have potentially entered a longer-term bear market. If that’s correct, then a C wave to the downside could soon unfold that tests the recent low or takes us to new lows. A break under 2,700 would suggest to us that the C wave down is underway. A break under 2,350 would suggest new lows ahead. Note as well how volume tailed off sharply during this corrective rally whereas the collapse saw very high volume. There are a large number of earnings reports out this coming week. Unless they beat expectations, these could weigh on the market and help push it lower. Q1 GDP is also out and is expected to show a decline of 4.6%. vs. a 2.1% gain in Q4. Initial claims are also expected to remain at 3.7 million after 26 million claims over the past five weeks. Home sales are also expected to decline over 10% for March and prices could show softening.
There are no pretty pictures. The only hope for the market is that the banks decide to spend the money they are sitting on as a result of the Fed’s bond purchases by buying stocks. That is not likely to happen any time soon as the funds appear to be staying with the Fed as reserves.
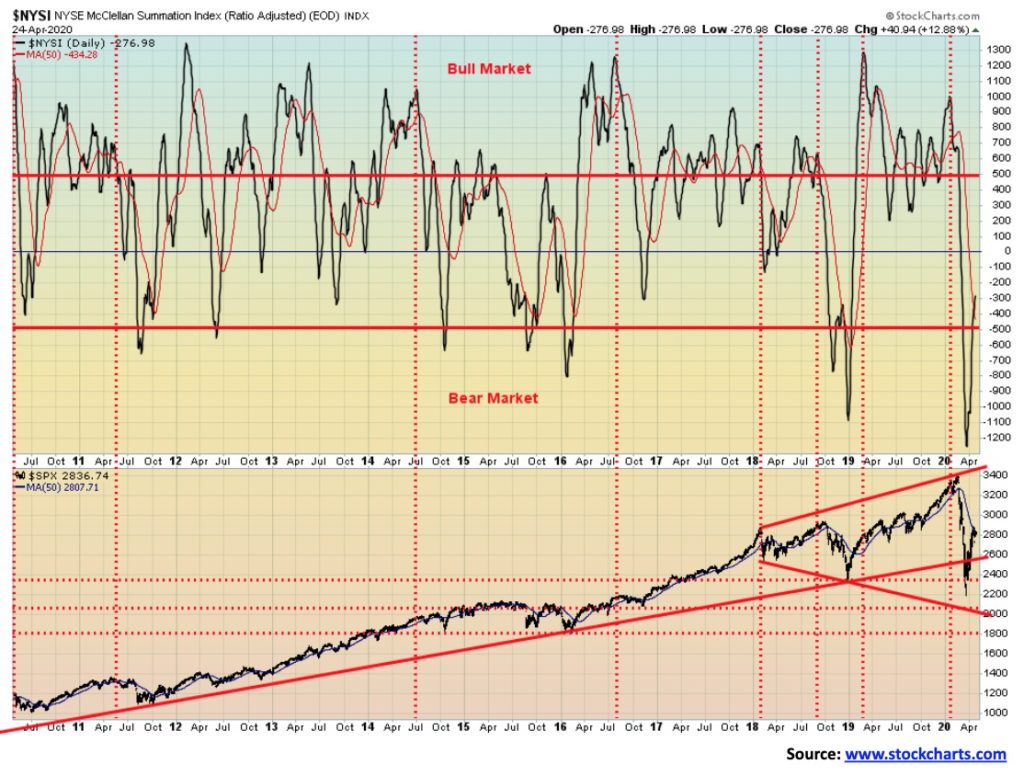
The McClellan ratio adjusted Summation Index (RASI) rose slightly this week to -277, but we still consider it to be bearish. Despite the improvement for the S&P 500 the RASI remains negative. Readings above zero would be signaling to us that there remains more upside. Note that, back in 2018, the RASI quickly rose above 0 suggesting that the market was poised for further gains. The sluggishness of the RASI suggests to us that, given the S&P 500 is at resistance, it might soon take the path of least resistance which is down.
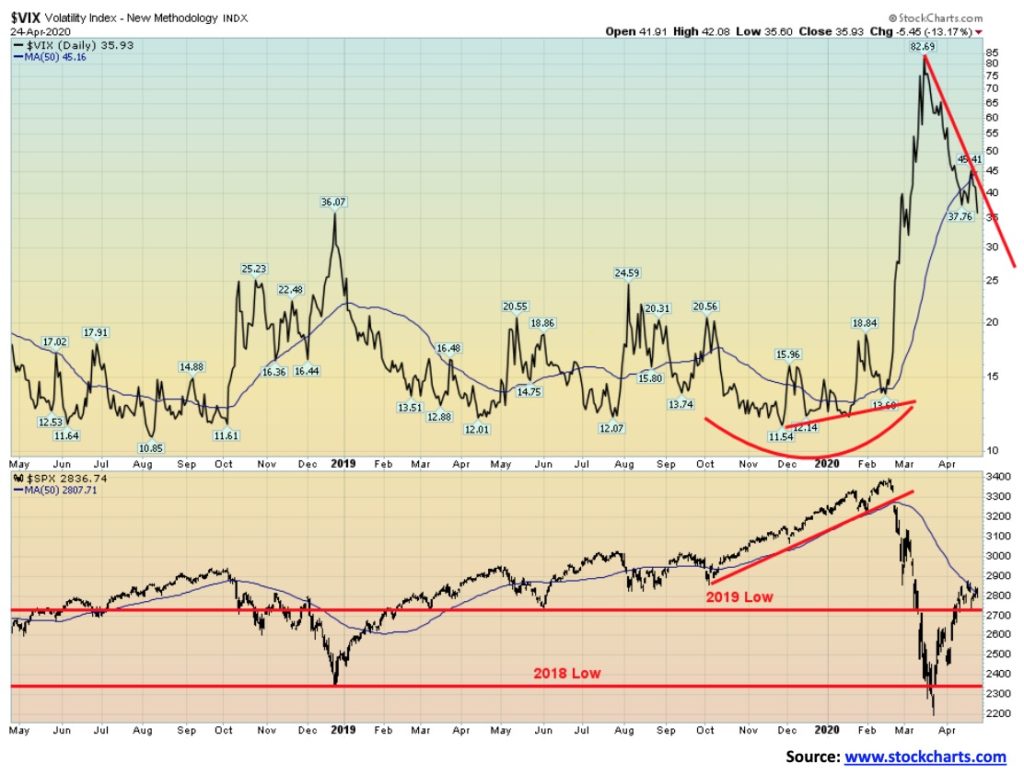
The VIX volatility index has fallen below its 50-day MA even as the S&P 500 is hanging just below its 50-day MA. We would not qualify that as a divergence although the VIX fell to new lows this week while the S&P 500 failed to take out its recent high. The spike seen at the recent low was almost as high as what was seen in 2008 at the height of the financial crisis. That’s how crazy it got when the stock market collapsed in March. The VIX is coming down, but we don’t expect it to return to the lows seen in 2019 any time soon.
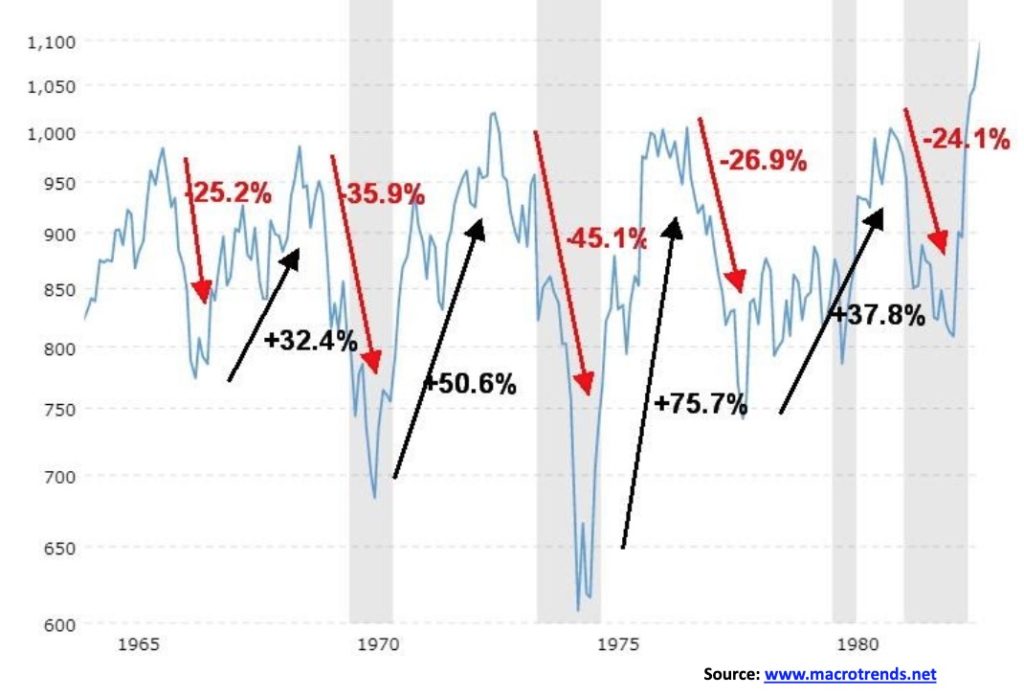
Above is a picture of the 1966–1982 bear. Our initial thoughts on how a secular bear might unfold have us thinking that a period over years of sharp ups and downs might be how this one plays out. We don’t believe we’ll see a 1929–1932 bear that wiped out upwards of 90% off the DJI. But we might see something like this. The initial drop February to March 2020 saw the DJI fall 38.4%. That’s in line with some of the declines seen 1966–1982. The rebound rally thus far has seen the DJI rise 33%. It is all fairly compressed, something that wasn’t seen during the 1966–1982 bear. Total time elapsed so far is only 41 days since the top of February 12, 2020.
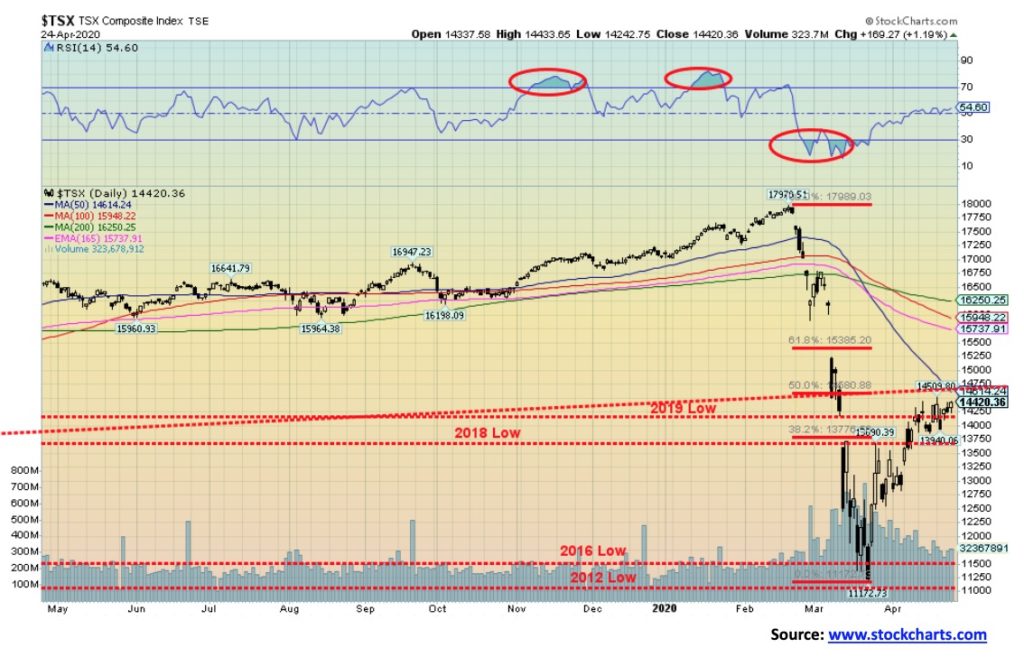
Despite a down week for the U.S. indices, the TSX Composite managed to eke out a small gain of 0.4% this past week. It marked the 10th day of trading roughly between 14,000 and 14,500. The 50-day MA is currently at 14,615 and that appears to be acting as resistance thus far. We have also retraced roughly 50% of the drop that was seen from the high on February 20 to the low on March 23. The TSX fell 38% in a mere 32 days. The collapse saw the TSX take out yearly lows of 2019, 2018, 2017, and 2016 and almost retraced right back to 2012, effectively wiping out almost 8 years of gains. Since the low some sub-indices have preformed better than others. Of the 14 sub-indices, only five are up on the year led by Golds (TGD) +32.8%, Information Technology (TTK) +13.9%, Materials (TMT) +10.7%, Metals & Mining (TGM) +0.6%, and Consumer Staples (TCS) +1.6%. Materials and Golds both saw 52-week highs this past week. All others are down on the year, led by Energy (TEN) -54.4%. Five others are down more than 20% thus far in 2020, perpetuating the reality of a bear market: Health Care (THC) -33.3%, Financials (TFS) -25.0%, Real Estate (TRE) -27.5%, Consumer Discretionary (TCD) -23.7%, and Income Trusts (TCM) -23.5%. The remaining three are Industrials (TIN) -10.3%, Utilities (TUT) -5.5%, and Telecommunications (TTS) -11.1%. Going forward, we see the five that are up on the year as the best places to invest, with possible selections from the three that are down up to 11%. The other six sectors we would avoid although Health Care may have some picks in the biotech or pharmaceutical stocks.
If the TSX Composite is to go higher, then it needs to take out 14,600 soon. Above that level, a move to the 100-day MA near 15,900 is possible. However, the market is starting to stall and resistance is strong in this area. A breakdown under 13,700 would suggest to us that the counter-trend rally is over and we could see a test of the lows. Under 11,950 new lows are possible. Given that the TSX has broken yearly lows all the way back to almost 2012 suggests to us that we have very likely entered a multi-year secular bear market. However, not all sub-indices have, as we noted.
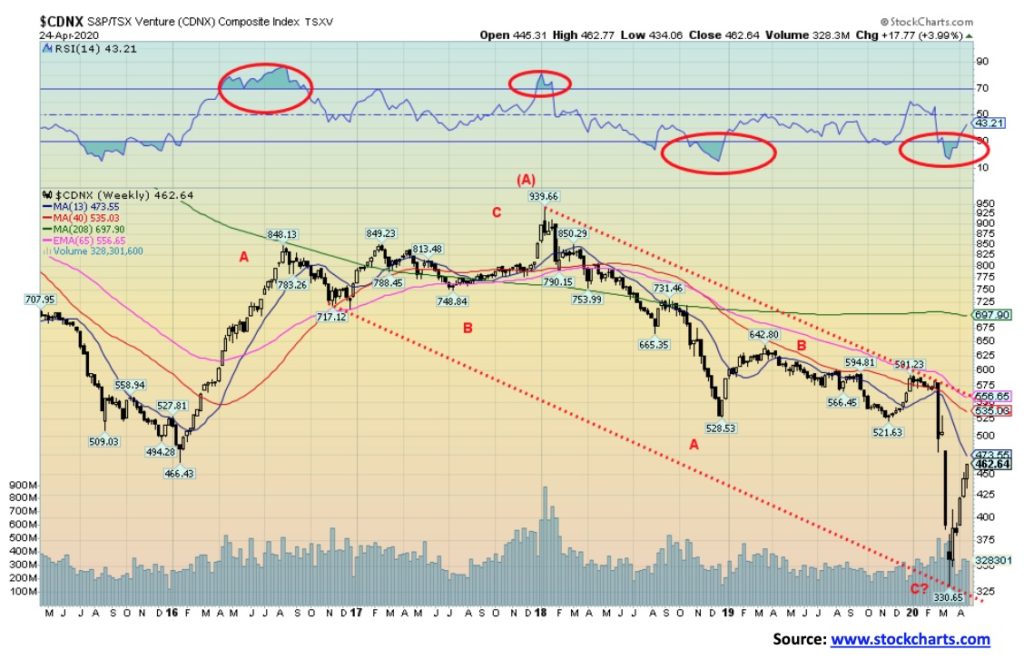
It has been some time since we noted the TSX Venture Exchange (CDNX). The CDNX made new all-time lows at the recent low of 330. Worse, this was a 65% drop from the highs of 2018. The CDNX is made up of 50% junior mining stocks, predominantly gold mining. The CDNX lost 90% from 2006 to the recent low. We believe that was a watershed mark and we could now see the CDNX embark on a potentially significant rally. The CDNX is up about 40% from the recent low. However, it still has a long way to go. We believe that the CDNX completed a 5-wave collapse from that high back in 2006. The first wave down saw the CDNX lose 80% into a low in 2008; wave 2 up was a gain of 263% topping in 2011; wave three down bottomed in early 2016 losing 81%; while wave four up topped in 2018 with a gain of 102%. The final wave down saw the CDNX fall 65%. Investing in the CDNX is not for the faint of heart. Naturally, we don’t know yet that the CDNX has made its final low. A move over 600 would be positive, but we need to take out the 2018 high at 940 to confirm the low at 330. Getting back to the all-time high at this time is merely a pipe dream as the CDNX would have to gain over 900% for that to happen. But regaining even the 200-day MA is not impossible. The 200-day MA is currently at 537. The 4-year MA is at 697 and regaining that too is not out of the question at this time. Regaining the 2018 high of 940, a 185% gain from the lows, could translate into numerous junior mining stocks doubling, tripling, and even quintupling from their lows. The rewards are great, but we admit trading on the CDNX is not for the faint of heart. Know your risk.
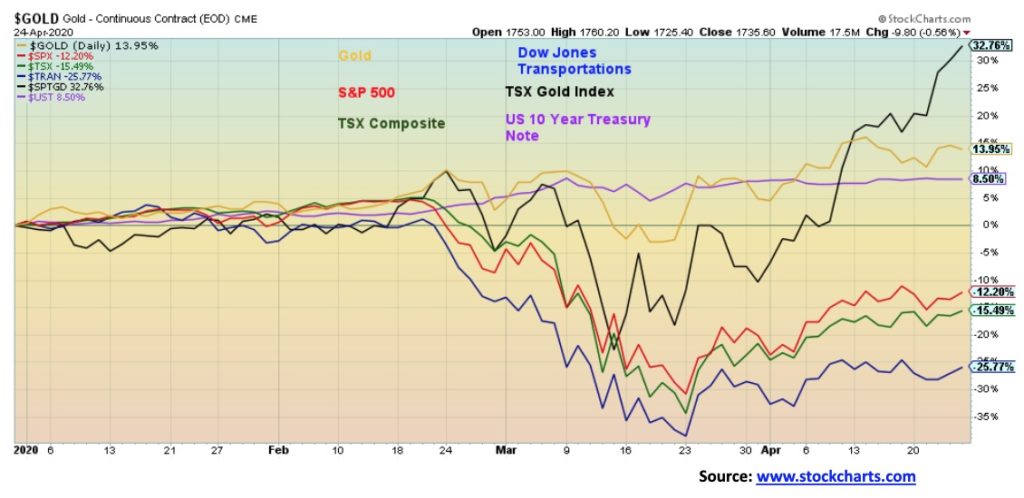
Gold and gold stocks have been the best performers so far in 2020. Gold is up about 14% while the TSX Gold Index (TGD) is up 32.8% year to date. The only other one in the black is the U.S. 10-year Treasury note up 8.5% before coupons. Bonds and bond funds have been positive performers in 2020. To the downside, the S&P 500 has lost 12.2% year to date, the TSX is down 15.5%, while the Dow Jones Transportations (DJT) has been one of the biggest losers, down 25.8% thus far in 2020.
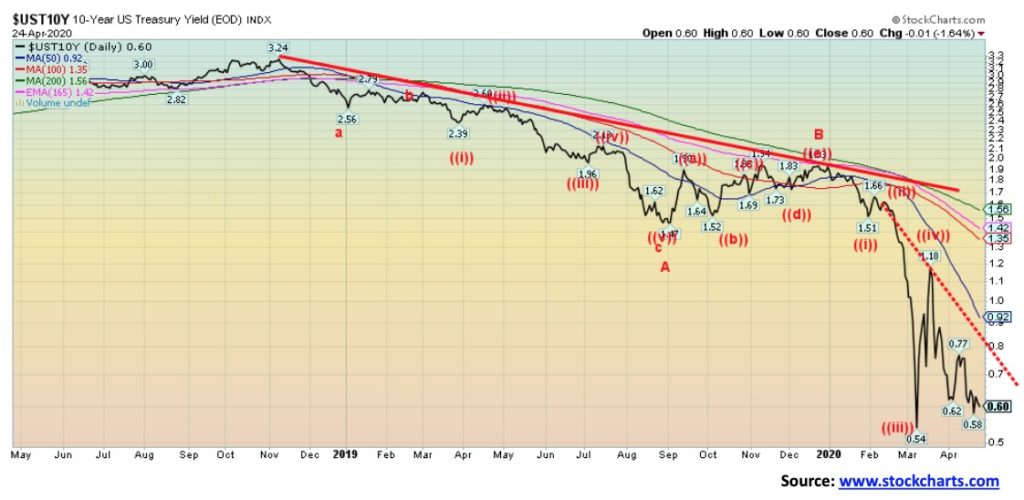
The U.S. 10-year treasury note fell to 0.60% this past week, down from 0.65% the previous week. Bond yields fell on strength in the global bond markets and weakness in the U.S. economy. With stocks still attempting to rally, it has cautioned the rally in bonds. Friday’s economic numbers were mixed with durable goods orders falling 14.4% in March, well below expectations and the weakest in over five years. However, non-defense capital orders rose 0.1% when a decline of 6.7% was expected. The University of Michigan Consumer Confidence came in at 71.8, slightly better than expected.
The Congressional Budget Office (CBO) expects Q2 GDP to be down 12% with unemployment averaging 14% in the quarter. U.S. advance Q1 GDP is due out this Wednesday. The consensus estimate is for a decline of 4.6% for the quarter. The previous Q4 2019 saw a gain of 2.1%. The Fed also meets this week and the expectation is that the Fed will leave interest rates at the benchmark of 0–0.25%. Canada is due to release the February GDP. They are expecting a small gain of 0.1%. However, the expectation for March is that it will be negative. U.S. initial jobless claims are expected to be 3.7 million this coming week, adding to the 26 million already reported. The manufacturing PMI is expected to come in at 36.4 vs. 48.5 for March. Also watch for China’s manufacturing PMI due out on Friday. They are expecting to come in at 47.8 vs. 50.1 in March.
Bonds are expected to remain somewhat bullish or at least not rise (price as prices move inversely to yields) much going forward. The economic damage of the coronavirus is severe. Monetary stimulus from the Fed along with central bank rates pushed to zero or lower are helping to push bond rates lower. We expect this to continue. While the U.S. and China continue to snipe at each other over many things, it is quiet on the trade front following China agreeing to the phase one deal in January. The massive amount of debt the U.S. Treasury has to issue to pay for all the bailouts is a reason that there could be upward pressure on rates. However, given the Fed could buy a chunk of it, it would help mitigate any rise in rates. Only over 0.90% does the 10-year have a chance to rise to significant resistance up at 1.25%. Low rates may be here to stay although the ability to fall much lower may be minimal.
A story we saw was that the U.S. in its ongoing trade war with China would default on the U.S. debt held by China. We doubt the story very much. You don’t selectively default. If you default one you automatically default on everybody. And such an event would be catastrophic for global financial markets.
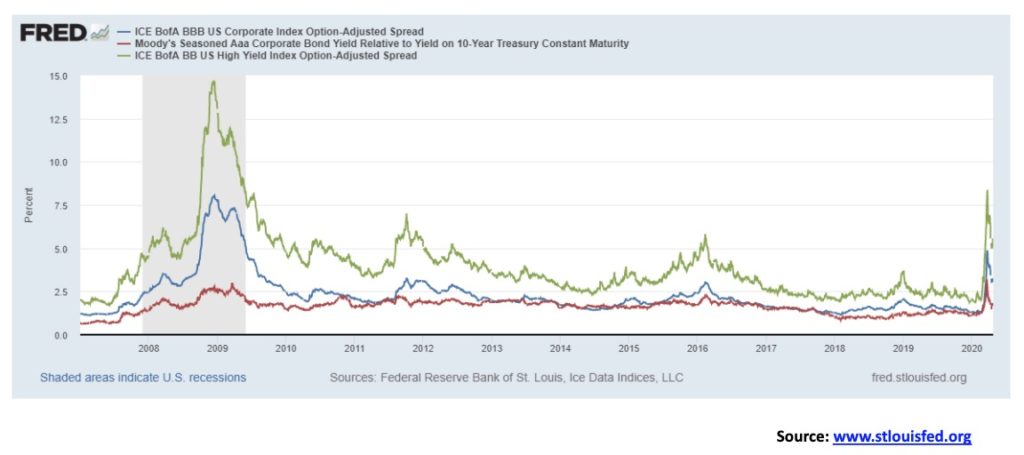
Given the massive injections by the Fed into the financial system and the lowering of interest rates, this has helped ease the recent rise in spreads. BBB bonds, the lowest investment grade, have seen the spread over treasuries fall back to 3.11% from a recent high of 4.88%. That’s still above the recent low of 1.33 seen in February. Similarly, the Aaa bonds have fallen back to 1.64% from 3.20% and BB bonds, the highest rated junk bonds, are currently at 5.53%, down from 8.37%. A reminder that corporate debt in the U.S. is at an all-time high while credit quality is at an all-time low. There are expectations of a minimum of $150 billion in defaults coming and it could be over $1 trillion. We wouldn’t expect the Fed to throw life jackets out to junk bond companies. S&P has downgraded some 1,270 companies so far in 2020. S&P downgraded only 906 in all of 2019. In 2009, at the height of the financial crisis, S&P downgraded some 1,500 companies. That record is expected to fall this year, possibly within a month or so.
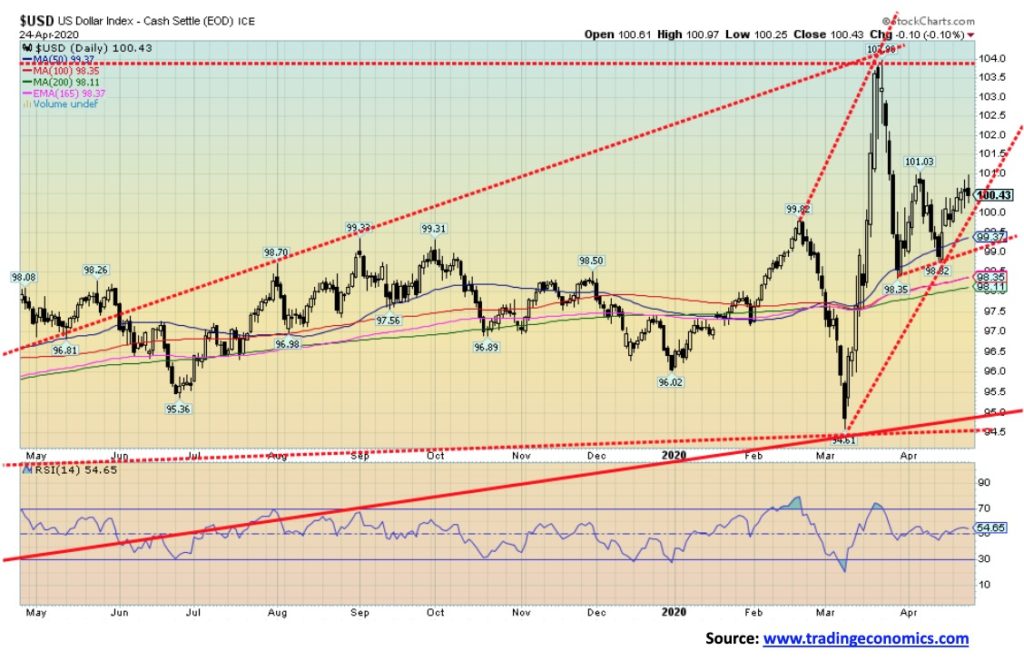
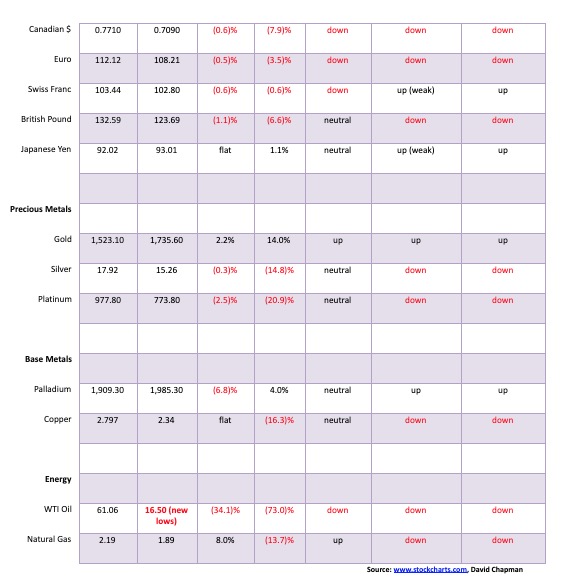
The US$ Index rose 0.6% this past week, hitting a high of almost 101 before it reversed and closed slightly down on the day, losing 0.1%. With stocks being somewhat stronger, it reduced dollar liquidity demand. The U.S. dollar also reacted negatively to the very weak durable goods orders. The U.S. approved another big bailout package of $484 billion. It is the fourth such aid package since the pandemic got underway.
Other currencies fell given the strength in the U.S. dollar this past week. The euro was off 0.5% and we are expecting to see new lows soon. The eurozone economy is a mess. The pound sterling was off 1.1% as coronavirus cases mounted and the outlook for the U.K. economy darkened. Even the normally strong Swiss franc was weak, losing 0.6% even as it remains the best of the major currencies outside of the U.S. dollar. The Japanese yen also fared well and was flat on the week. The Canadian dollar fell 0.6% and closed once again under 71.00.
The U.S. dollar remains strong against major and minor currencies and that, as we have frequently noted, puts extreme pressure on trillions of dollars of debt denominated in U.S. dollars but issued by foreign entities. China is particularly vulnerable and the PBOC is trying to stem the hemorrhaging of Chinese companies. PBOC cut its one-year medium lending facility this past week and injected ¥56.1 billion (US7.9 billion) into the financial system.
Given conditions elsewhere, the U.S. dollar remains a go-to currency because of negative yields in the EU and Japan, the weakness everywhere caused by the pandemic and trade tensions that persist, seemingly benefitting the U.S. dollar.
Friday’s high just shy of 101 left a potential small double top on the charts. The breakdown point is at 99 and, if correct, projects down to 96.30. The major breakdown point is below 95. Above 101 the U.S. dollar index could rise further to test 102. The recent high was seen just under 104.
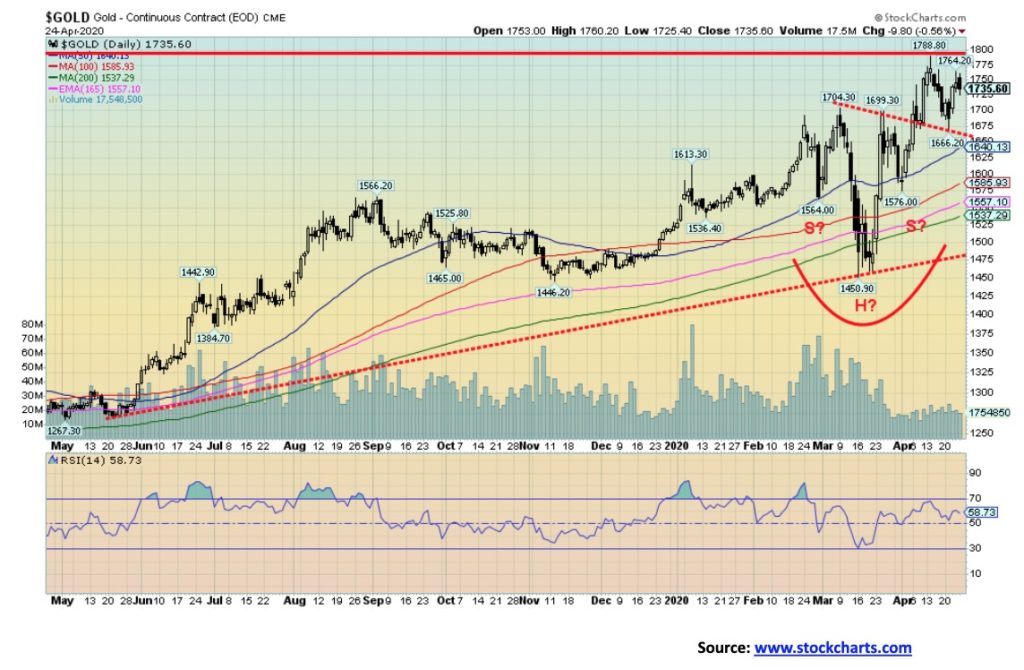
Gold put in a positive week, gaining 2.2% and closed at its highest level since 2012. So far, it has fallen short of the previous high at $1,788. However, an intraday move over $1,760 suggests gold could soon see new highs. We would have preferred a close over $1,760 rather than an intraday move. Gold did make a good test of the neckline of what may be a head and shoulders bottom pattern. The pattern, if valid, projects gold to rise to at least $1,950. A breakdown below the right shoulder at $1,575 would bust the head and shoulders pattern and send gold tumbling towards the recent low near $1,450. Given the massive amount of stimulus being showered on the economy by the central bankers, coupled with weak economic numbers, the odds do not favour gold falling at this time. It is, however, difficult to predict how gold might respond if the stock market were to have another plunge as it did in March. Gold followed the market down, but gold’s fall was not as steep as the drop in the stock market.
While gold rose, the other precious metals did not. Silver lost 0.3% while platinum fell 2.5% and continues to underperform. Industrial metals were also weak following weak economic numbers. Palladium fell under $2,000, off 6.8% while copper prices were flat on the week. Gold has been rising for good reason, given its negative correlation with stocks and bonds and being viewed as a safe haven. The gold stocks are now leading, which is something we usually see in a strong bull market. So, we hope that’s right. However, sentiment tends to get high quickly and then we see all sorts of forecasts of $3,000 gold, $5,000 gold, $10,000 gold, $20,000 gold. And that usually makes us nervous that the market is getting too bullish. But the rise in gold prices has brought some institutional money into the gold miners, helping to explain their recent strength. We are also noticing a bit more bid on the junior mining exploration stocks. But we need more speculative money into that market to really get it going.
Gold seems reasonably priced here and the RSI at 59 is not too overbought. So, there is room for it to move higher. Gold’s next 31-month cycle low is due into 2021 and the next 7.83 cycle low is due into 2022–2024. The 23.5-year cycle low that should correspond to the next 7.83 cycle is due in 2021–2027 but more likely in the same time frame as the 7.83 cycle low. It remains possible that we could have a blow-off top before gold collapses into the 23.5-year cycle low. Our preference is to take it one step at a time. Our focus right now is the next target at $1,950 but mindful of the breakdown zone at $1,450 with the initial break under $1,666.
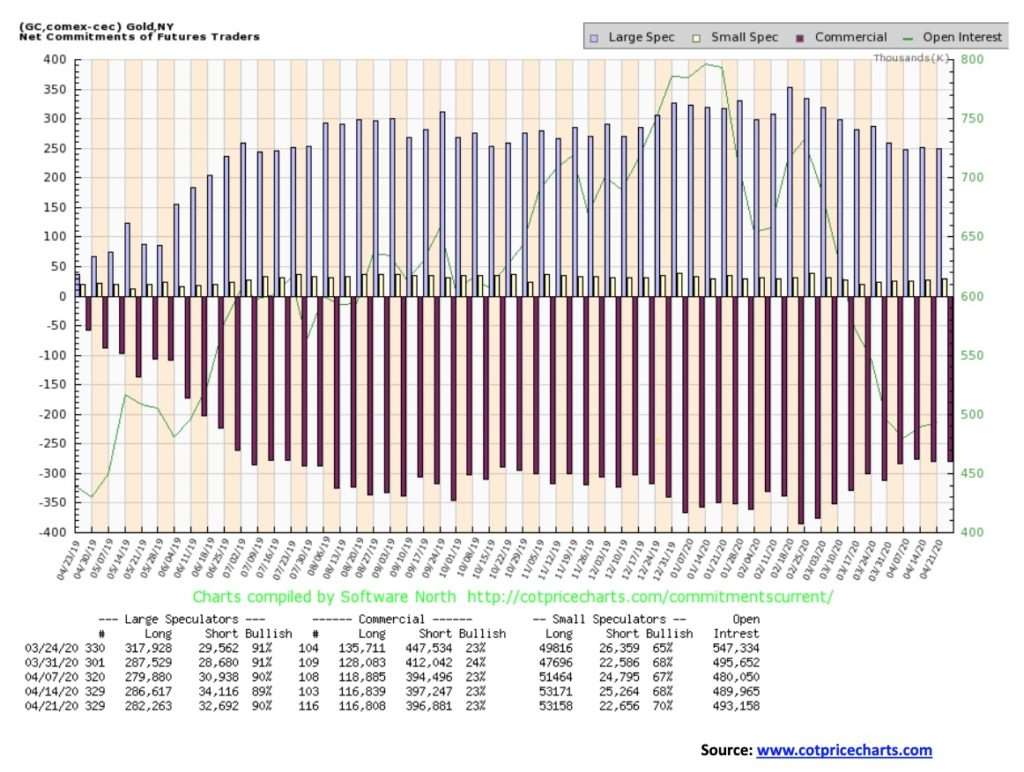
The gold commercial COT remained unchanged this past week at 23%. Long open interest was virtually unchanged while short open interest fell only about 400 contracts. This has to have been one of the quietest weeks we ever seen for the commercials. The large speculators (hedge funds, managed futures, etc.) COT rose slightly to 90% from 89% even as they dropped their long open interest by over 4,000 contracts and their short open interest also fell down roughly 1,400 contracts. Overall, the COT is still bearish for gold.
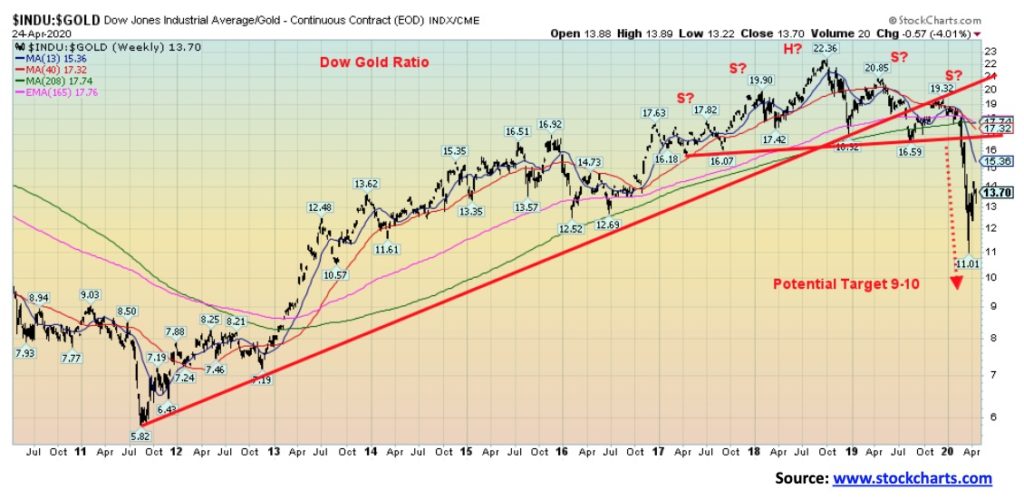
A few weeks ago, we mused that the Dow/Gold ratio could fall to between 9 and 10 once it broke what appeared to be a multi-year head and shoulders topping pattern. Well, the low thus far is 11, seen on March 23 at the time of the stock market low. Since then the rally in stocks has slightly outperformed gold, but overall gold remains the stronger investment in 2020. The target of between 9 and 10 is not eliminated yet. Only a move back over 17 would end that. In today’s market that is not likely and gold should remain a better choice over stocks going forward.
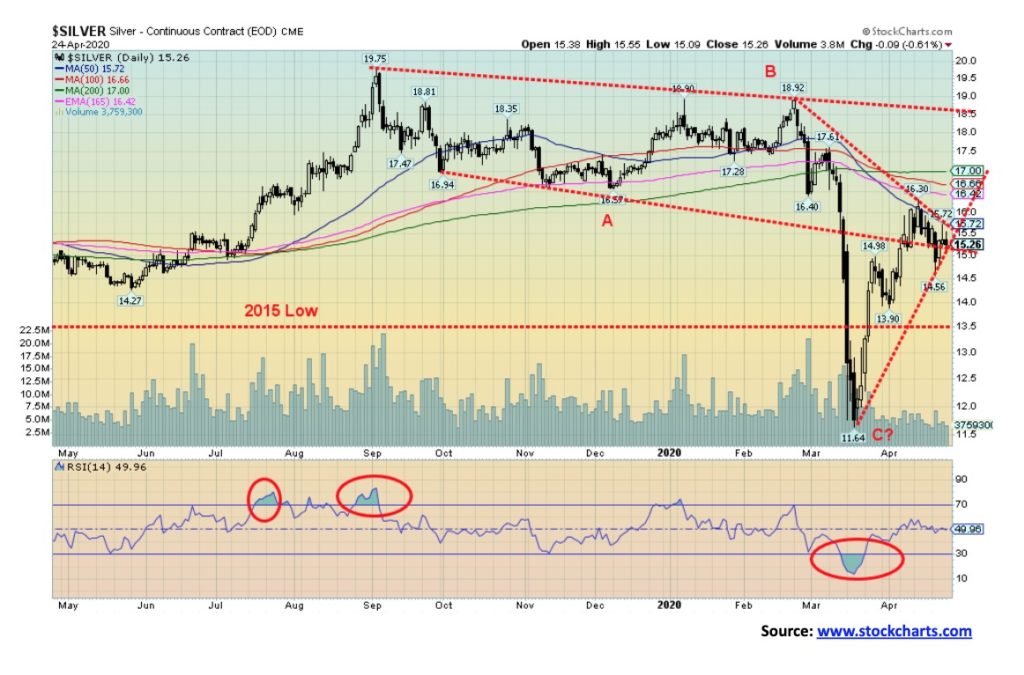
Once again, even as gold prices were higher on the week, silver prices languished and closed down small off 0.3%. Weak economic numbers hurt industrial metals and silver continues to get lumped in with industrial metals. The gold/silver ratio remains very elevated, currently at 113.7. If the ratio were down at 70 at least, silver would today be at $24.80. Historically, at least, a high gold/silver ratio has signaled a rally in the precious metals with silver leading the way. Silver is now pressing against support. A break of $15.15 could send prices lower. Final support would be at $14.55 and a break under that level would signal a decline to around $13.50. Silver has considerable resistance up to $17. But a firm break over $17.25 could see silver rise to new highs above $19. If the triangle forming is a bottom, then a firm break over $15.75 could in theory see silver rise to about $23. That silver smashed through previous years’ lows, including the 2015 low, suggests that silver may be in a longer-term bear market. But that doesn’t stop strong upside rallies including ones that see new highs. Once over $17.25, major resistance can be seen at $18.50.
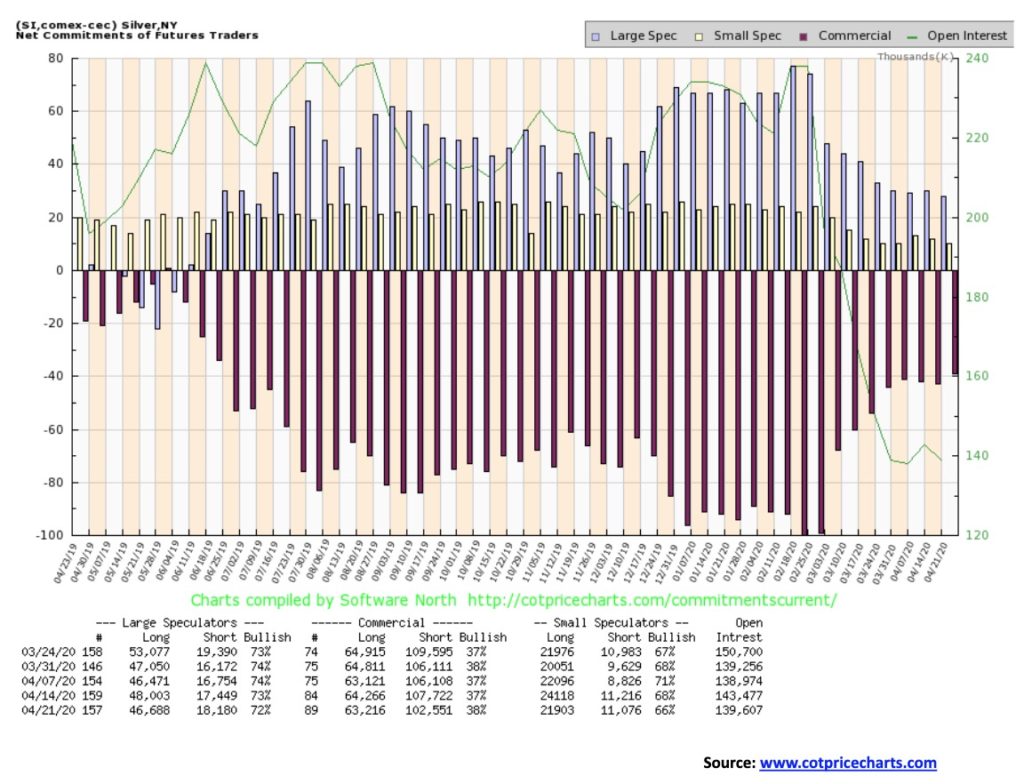
A small improvement for the silver commercial COT going to 38% from 37%. Long open interest slipped by roughly 1,000 contracts but short open interest dropped around 5,000 contracts. The open interest continues to contract, suggesting that the shorts are continuing to cover, a positive development. The large speculators COT was also largely unchanged, dropping to 72% from 73%. Their long open interest fell roughly 1,300 contracts and short open interest rose about 700 contracts. These are small changes, but they are mildly more bearish than previously.
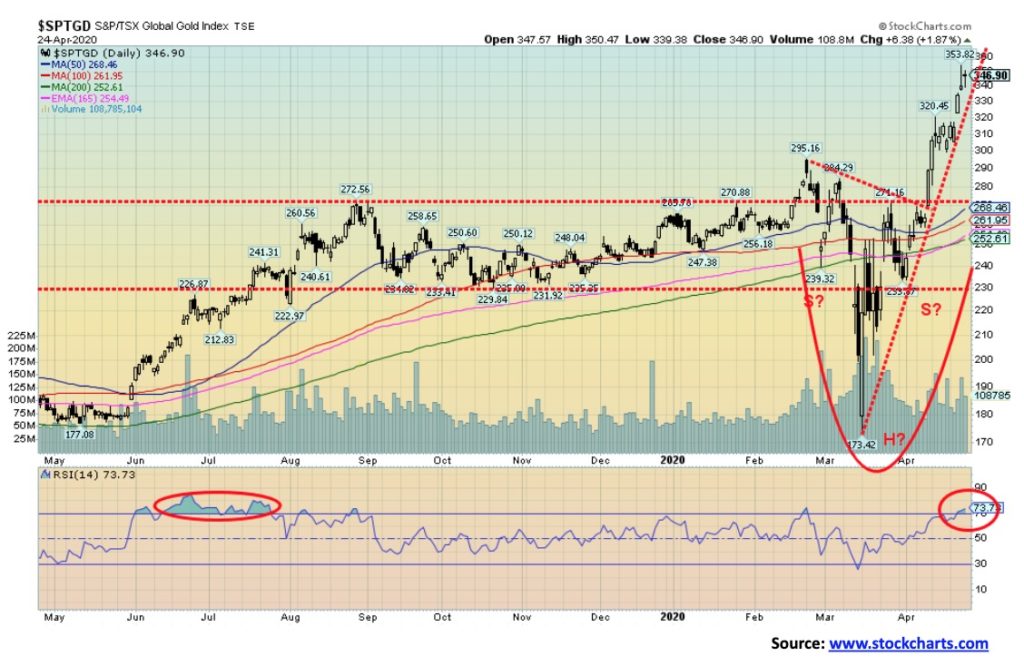
The gold stocks, as represented here by the TSX Gold Index (TGD) and also the Gold Bugs Index (HUI), continue to rise at a swift pace. This past week both indices made new 52-week highs as the TGD gained 13.3% and the HUI was up 13.6%. Many individual stocks made new 52-week highs as well. Despite the excitement of making new highs, a reminder that the TGD is still down 24% from its all-time high seen in 2011 while the HUI is still down 57%. We continue to wonder whether the TGD made a head and shoulders bottom, although normally the right shoulder does not fall below the left shoulder. Usually it is the other way around. But, if correct, the potential target zone for the TGD is up to 382. Not only is the BPGDM over 90% but the RSI is now over 70 in a zone usually seen as a potential top. However, back in June/July 2019 the RSI was similarly over 70 and stayed that way for weeks as the market moved higher. The BPGDM at the time was over 80 although it never got over 90. A pullback wouldn’t hurt to ease some of the overbought condition. A break under 330 would signal at least a pause. Preference, however, is that the TGD hold above 300 on any pullback.
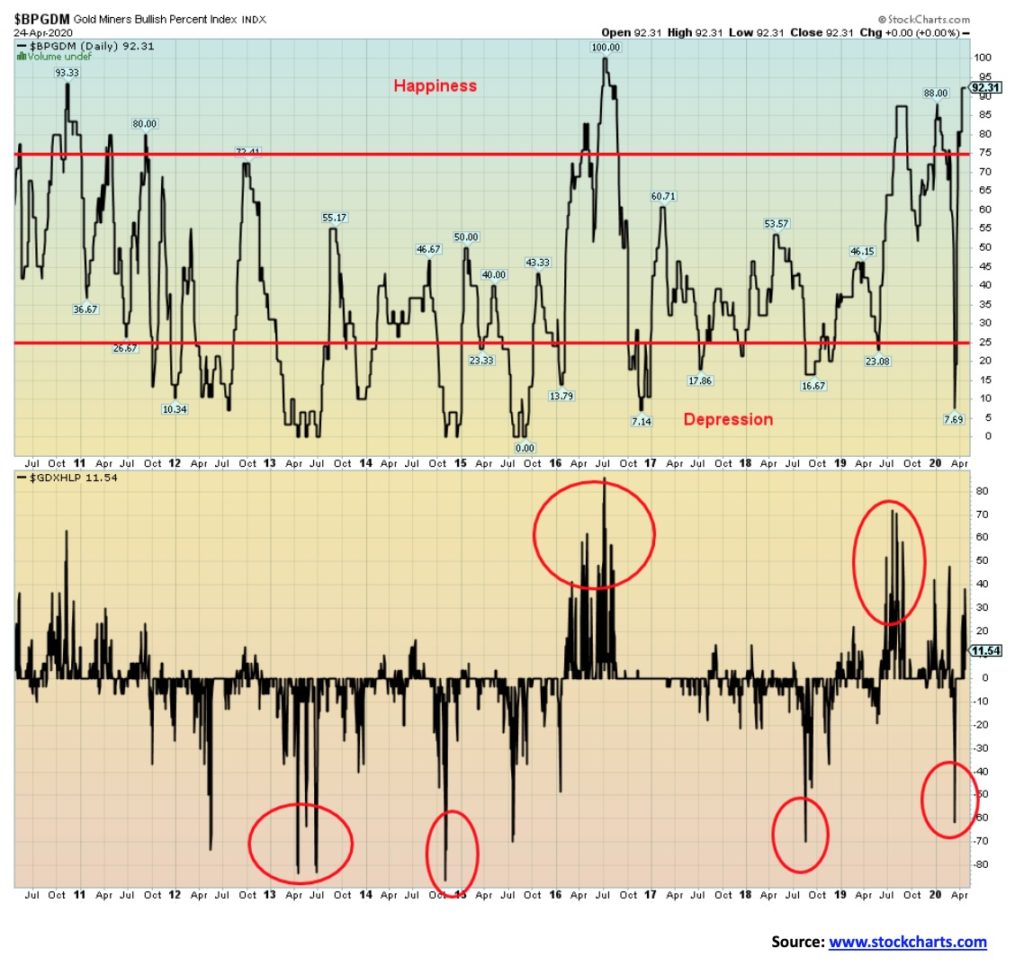
We are showing once again the chart of the Gold Miners Bullish Percent Index (BPGDM) as a reminder that bullish sentiment towards the gold miners remains very elevated, currently at 92.3%. The Gold Miners New Highs – New Lows Percent Index (GDXHLP) remains below peak levels. If the two of them are elevated, then it might be wise to take profits. But, given the BPGDM is elevated while the GDXHLP is not at what one would call extremes yet, we may have further room for the gold mining stocks to move higher. The BPGDM is a warning. It does not necessarily signal a top but it suggests that one could be at hand. However, if it reached a 100 as it did back in July 2016, then profit taking would be wise. But the GDXHLP was also highly elevated as well confirming the top.
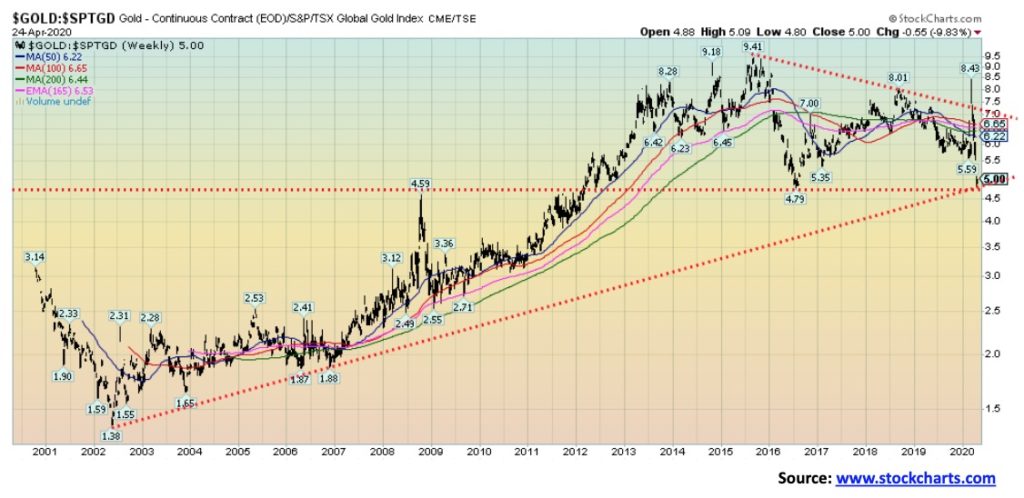
Is the tide shifting towards the gold miners over physical gold? The gold/TGD ratio has fallen to its lowest level since 2016. A firm break under 4.80 could project down towards the lows seen in 2002. Even falling to levels last seen in 2011 when gold was over $1,900 would be a good move on the part of the gold miners. That would put the ratio down around 3.50 and, if that were translated to today, the TGD would be at 495 and a record high.
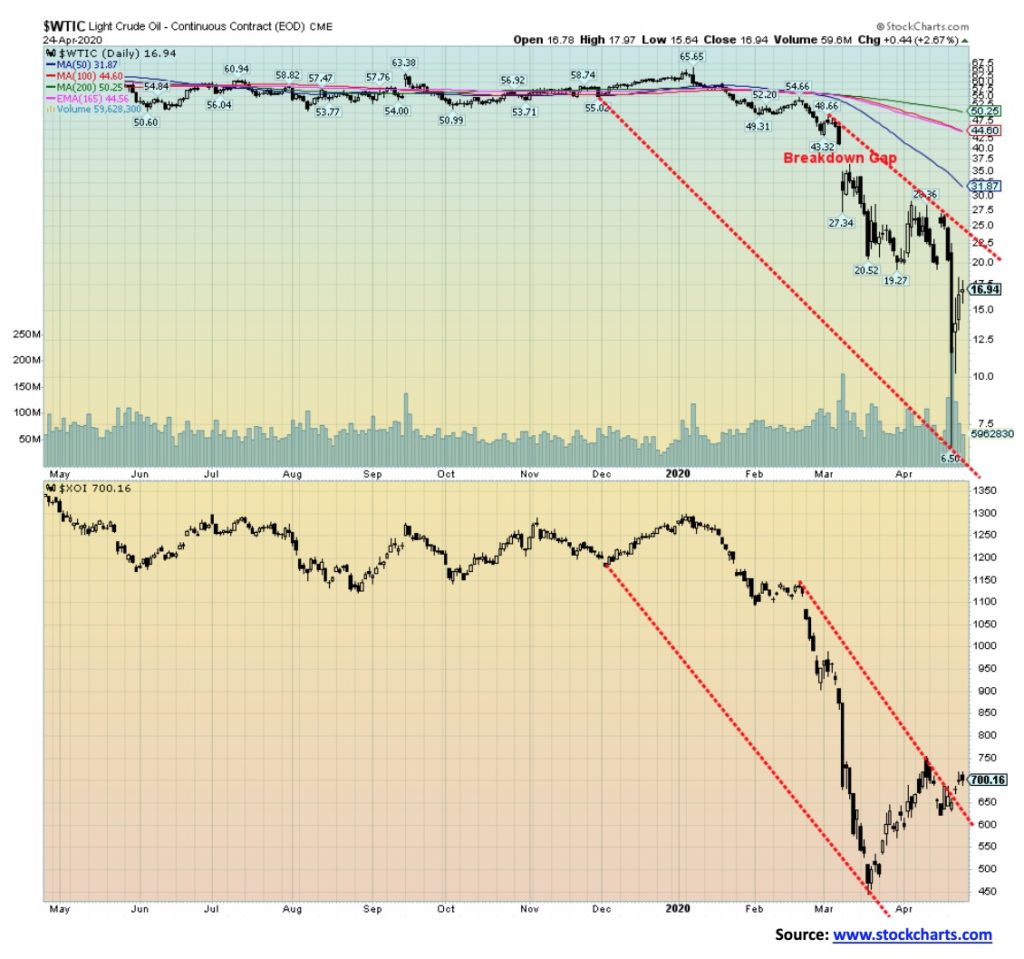
It wouldn’t be an understatement to say that the past week was a wild and scary week in the energy market. On Thursday WTI oil prices surged to $17, a 30% jump. Oil prices trading in the teens sounds catastrophic. Except it looks downright reasonable to negative $37 seen on what might be the most insane day in oil’s history. Yes, they had to pay people to take it away. Demand had plummeted because of the COVID-19 pandemic and supply cuts hadn’t remotely kept up with the plunge in demand. The result was an oil glut with nowhere to put the stuff.
Refined products are grossly oversupplied and they have taken to stuffing the oil into tankers at sea. As a result, the cost of renting a tanker has soared. It is not like this is milk or something. You can’t just dump it. As refineries shut down, the supply glut grows. With no clear end in sight to the pandemic or to the lockdowns, demand is going to remain depressed for weeks, maybe months. If refineries are losing money on processing which they are, the refineries will shut down, dumping more oil on an oversupplied market.
All this has left companies in dire straits. Bankruptcies will soar. Mergers will take place in an attempt to save something. The U.S. shale industry may never recover. Dividends will be slashed or cut altogether. The big integrated companies may limp to the finish line but many other companies will just disappear.
Wells need to be shut, but you can’t just turn the taps off then back on again, especially in Canada’s western oilsands. Nobody wants Canada’s oil. Western Canada Select did close Friday at $1.10, but mostly it has been negative of late. Helping oil prices firm a bit after plunging into the depths was sabre-rattling by the U.S. against Iran. Oh, yes, start a war in the Middle East in the Gulf and the Straits of Hormuz. That ought to push oil prices up a bit.
Meanwhile, jobs are being shed at a rapid pace. Banks are preparing for the worst, upping their reserves for loan losses. How can you plan with oil priced below zero? One can pretend all is well, and certainly a $1.7 billion investment by the Government of Canada to clean up abandoned wells in Western Canada will help sustain some jobs. The reality is, no one knows when things might get back to normal. Normal these days is oil priced in the teens or lower.
Surprisingly, the energy stocks were actually up on the week with the Arca Oil & Gas Index (XOI) gaining about 2% while the TSX Energy Index (TEN) fared even better, up 5.4%. Natural gas (NG) rebounded a bit, up 8% to 1.89. But WTI oil was down 34.1% on the week, closing out at $16.50 (June futures). Okay, that is better than negative $37 which cash/May futures hit earlier in the week. But what about next month? Do we repeat this all over again because sufficient cuts to production still haven’t been made?
The pain in the oil industry is going to remain with us, long after anything returns to anything resembling normalcy. This may be the new normal. If oil gets lucky, maybe it can rally to the top of the channel near $22.50. More likely is a return to the bottom of the channel near $5. The reality is, even steeper cuts are required. But in the competitive geopolitical world of oil, everyone is generally out for themselves.
—
(Featured image by Jose Francisco Fernandez Saura via Pexels)
DISCLAIMER: This article was written by a third party contributor and does not reflect the opinion of Born2Invest, its management, staff or its associates. Please review our disclaimer for more information.
This article may include forward-looking statements. These forward-looking statements generally are identified by the words “believe,” “project,” “estimate,” “become,” “plan,” “will,” and similar expressions. These forward-looking statements involve known and unknown risks as well as uncertainties, including those discussed in the following cautionary statements and elsewhere in this article and on this site. Although the Company may believe that its expectations are based on reasonable assumptions, the actual results that the Company may achieve may differ materially from any forward-looking statements, which reflect the opinions of the management of the Company only as of the date hereof. Additionally, please make sure to read these important disclosures.


Youth Cannabis Use in Colorado Is Falling — But the Full Story Is More Complex
The 2026 Colorado survey shows teen cannabis use fell to 10 percent in 2025, down from 21 percent in 2015....


Morocco’s Growth Holds at 4.6% as Agriculture Offsets Economic Pressures
Morocco’s economy grew 4.6% in Q1 2026, driven by a strong agricultural rebound offsetting declines in industry. Services expanded moderately...


Abivax Shares Surge as New Trial Data Eases Safety Concerns Over Ulcerative Colitis Drug
Abivax shares surged nearly 36% after positive updated trial results for its ulcerative colitis drug obefazimod reassured investors following earlier...


El Dorado Raises $9M to Expand Cross-Border Fintech Platform
El Dorado, a Latin American fintech improving cross-border financial services, raised a $9 million Series A led by Paradigm with...


Bitcoin Stalls Near $60K as Strategy Moves, ETFs Outflow, and EU MiCA Rules Take Effect
Bitcoin hovers near $60,000 with ETF outflows, while Strategy boosts reserves, sells BTC, and raises dividends to reassure investors. Ethereum...
 |
|
 |  |
 |
|
-

 Crypto5 days ago
Bitcoin and Ethereum Slide as Market Pressure Builds Amid Strategy Concerns and Layer 2 Disruptions
-

 Business2 weeks ago
Fed Policy Shift Raises Concerns Over Debt and Inflation Risks
-
 Crypto1 day ago
Bitcoin Stalls Near $60K as Strategy Moves, ETFs Outflow, and EU MiCA Rules Take Effect
-

 Biotech1 week ago
Galicia Launches €805M Biotechnology Strategy to Drive Innovation and Competitiveness (2026–2030)