Crypto
GDP rises in Q2; Bitcoin soars higher
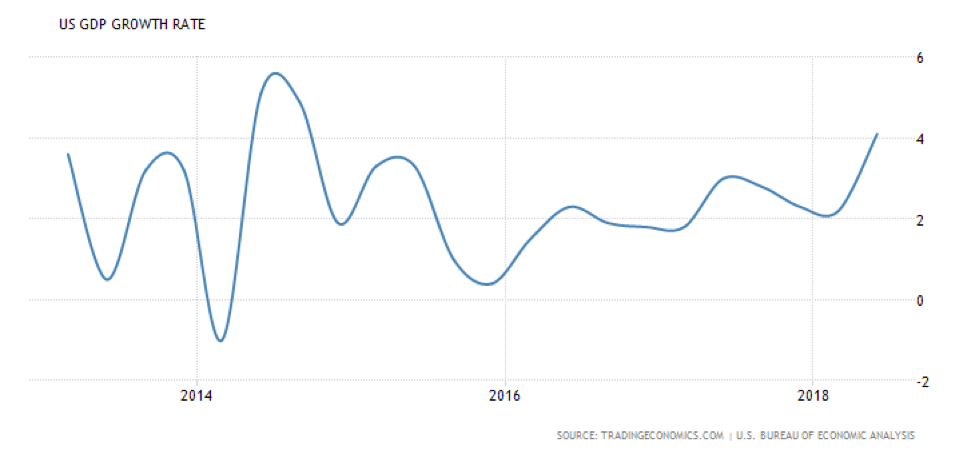
GDP rose by 4.1 percent, slightly exceeding expectations while Bitcoin bounced back triumphantly at $8,400.
“The world runs on individuals pursuing their self interests. The great achievements of civilization have not come from government bureaus. Einstein didn’t construct his theory under order from a, from a bureaucrat. Henry Ford didn’t revolutionize the automobile industry that way”. — Milton Friedman
“The government solution to a problem is usually as bad as the problem”. — Milton Friedman
“If you put the federal government in charge of the Sahara Desert, in 5 years there’d be a shortage of sand”. —Milton Friedman
“There’s no such thing as a free lunch”.—Milton Friedman
Milton Friedman was a giant of American economics. He was one of the leaders of what became known as the Chicago School of Economics. His ideas and theories permeated government policies, especially from about 1980 onwards. His monetary theories influenced even the Federal Reserve’s response to the global financial crisis of 2007–2009.
His political philosophy praised the virtues of a free market economic system with minimal intervention. Friedman was an advisor to Republican administrations under Richard Nixon and Ronald Reagan and British Conservative governments under Margaret Thatcher. He advocated policies such as a volunteer military, floating exchange rates, abolition of medical licenses, a negative income tax, deregulation, and school vouchers. He also opposed the war on drugs. Not all of his ideas became a part of the fabric of the U.S. and elsewhere, but many did.
Friedman was born in Brooklyn in 1912 and passed away in San Francisco in 2006. Along with John Kenneth Galbraith and John Maynard Keynes, he is regarded as one of the giants of the economics of the 20th century. In many ways, Friedman’s economics was the antithesis of Galbraith and Keynes. For the most part, it is Friedman’s economics that became economic orthodoxy even to the point of it being imposed on other countries through U.S.-dominated institutions such as the IMF and the World Bank.
Friedman was an advocate of fiat money or a paper money standard guided by monetary rule rather than tying money to a gold standard. He believed it was a less costly system and less open to inflationary excesses, thus providing a stable background for monetary growth and economic expansion. He blamed speculative bubbles on the Federal Reserve and not on excesses by the “capitalists.” His thoughts prevail today.
It could be argued the great debt buildup and subsequent stock market run-up since the financial crisis of 2007–2009 have been placed on the actions of the Federal Reserve and the other central banks—the ECB, the BOJ, and PBOC—through years of abnormally low even zero and sub-zero interest rates and quantitative easing (QE) where they purchased bonds from the financial system. Many blame those policies as the money from QE, rather than reaching “Main Street,” went into “Wall Street” and speculation. The policy of zero and even sub-zero interest rates resulted in an explosion of borrowing by governments, corporations, and consumers globally. Global debt has exploded by upwards of $100 trillion since the financial crisis of 2008.
Friedman was a believer in minimal government intervention in the economy. He firmly believed in liberalized trade and global movement of labor. One of his famous quotes was “there is no alternative way so far discovered of improving the lot of the ordinary people that can hold a candle to the productive activities that are unleashed by a free enterprise system.”
We wonder how he would view the state of today with the threat of trade wars, currency wars, and more. The rejection of liberalized trade by the U.S. such as the Trans-Pacific Partnership, the launching of tariffs triggering potential trade wars, the building of a wall at the border to keep Mexicans out are the antithesis of Freidman economics. Ironically, so is Brexit. Whether one wishes to agree or not with Milton Friedman, it is his economics that has dominated the world since about 1980. Globalization took place on a scale never before imagined. There was an economic integration of trade flows, capital flows, and migration and they took place at an accelerating pace, until now. Living standards rose, life expectancy rose, infant mortality declined, educational attainment grew, while even democracy grew and absolute poverty declined.
Yes, there were dislocations as a few benefited considerably while many felt left behind and struggled. But more were hauled out of poverty in Asia, Latin America, and even Africa even as those in the Western developed countries floundered to some extent. With the introduction of huge swaths of unskilled workers into the global economy, this tended to suppress wages everywhere. Highly skilled workers benefited, but unskilled workers stagnated. The result is tensions, particularly in Western societies, that are now translating themselves into the election of populists that say they will “make things great again”.
But now that is all under threat as global institutions are being attacked, trade is being attacked, and the threat is that the world could return to the “beggar thy neighbor” policies that contributed to the Great Depression. Trade wars (tariffs) and currency wars benefit no one. Globally, economic growth is beginning to slow. Halting globalization and trade growth is not the answer to winning. Economic gains as a result of globalization have over time benefitted the entire economy, but it has been uneven as it benefitted fewer while many were left behind with stagnating wages. Overall, the Western economies have benefitted from cheaper imported goods. But if tariffs and closed borders take hold high-income earners would lose some purchasing power but lower-income consumers would lose a considerable amount of purchasing power. The rich get richer and the poor, well…
Open borders, something Friedman would have heartily endorsed, are becoming closed borders. In the EU the common currency, along with open internal migration, opened up wounds that the creators have been unable to resolve. But Brexits are not the answer either. Mass migration from Africa, the Mid-East, Central America, and Mexico because of war, famine, and drugs has created a further problem as it is viewed that they are taking advantage of us. That, in turn, has given rise to xenophobia, anger, and hatred and again the election of populists who say they will fix the problem.
Note most of these problems are inherent in Western economies such as the U.S., Canada, and the EU. The areas that benefited from globalization in Asia, Latin America, and even Africa to some extent are not facing the same problems. The rise of China can only be termed an economic miracle, yet China is now at the center of the storm as having caused grief for American workers.
Since the world came off the gold standard back in 1971 and moved to a system of floating exchange rates and fiat money there has been unbridled growth. But there has also been instability as each succeeding crisis has, in many ways, been worse than the previous one. The Western economies have faced a financial crisis in 1974–1975, 1980–1982, 1990–1992, 1998, 2000–2002, and 2007–2009. Each required more and more debt to bail themselves out. And now in a world of $247 trillion of debt, the ability to weather the next financial storm has been severely compromised.
Oddly, gold could play a role once again in stabilizing world economies. It occurred once before in the depths of the Great Depression when gold was revalued upward from $20.67 to $35. It was a de facto devaluation of the US$. The U.S. has the world’s largest gold reserves, estimated at 8,133.5 metric tonnes. The U.S. carries them on their books at around $11 billion. At today’s prices, they are actually worth $320 billion. If the price of gold were revalued today to cover the U.S. monetary base of $3.6 trillion gold would need to be priced closer to $14,000. A repricing of that nature would also be a devaluation of the US$. Trump has attacked the Fed for hiking interest rates and, in turn, putting upward pressure on the US$. Trump could use gold as a weapon in his war against China and also against the Fed through a revaluation.
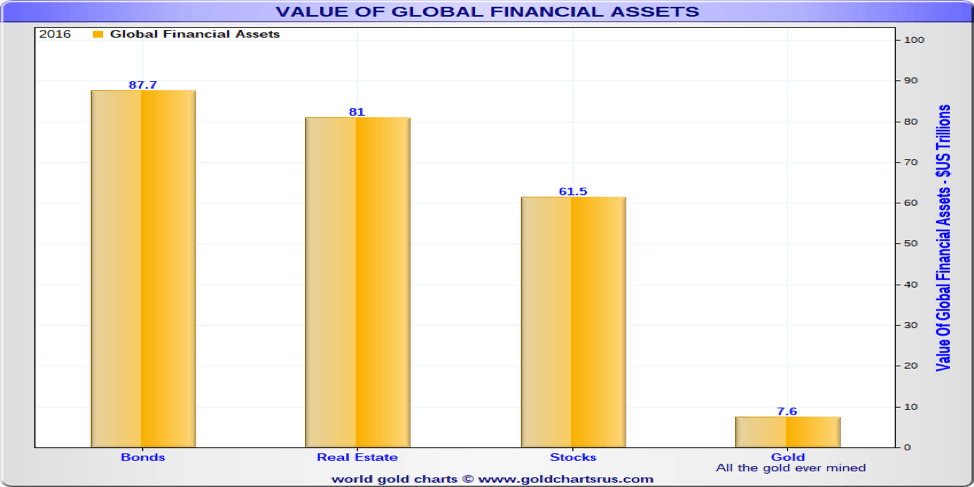
Now that would be an ultimate antithesis of Milton Friedman. Gold as an asset makes up a very small percentage of global assets as the chart below shows. All the gold ever mined at today’s prices is about 3 percent of global assets. And that was in 2016. It may even be less today. Most gold is either held as reserves by central banks, is in jewelry, or is just inaccessible.
© David Chapman
Bitcoin Watch!
© David Chapman
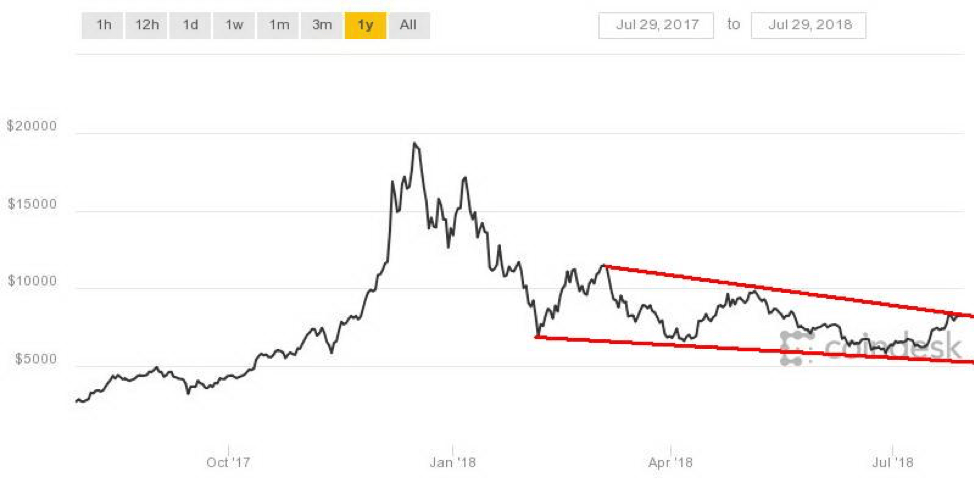
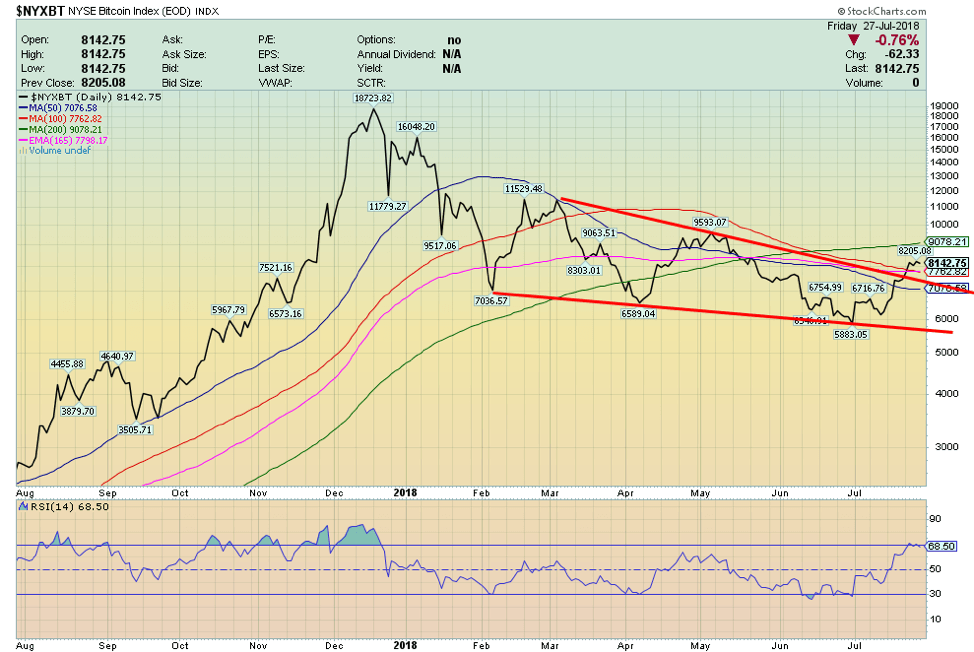
For the first time since May 2018 Bitcoin has jumped back over $8,000 reaching a recent high of just over $8,400 before pulling back under $8,000. Bitcoin is up about 6% on the week after pulling back from this week’s peak. A perusal of the larger cryptos reveals that not all followed Bitcoin to the upside as overall it was mixed.
So, is this it as the bulls are proclaiming? That we are on our way back in a new bull leg to the upside to challenge the former highs near $20,000? Well, of course, it is possible, but overall this move has the look and feel of merely a more substantial correction to the recent down leg. Looming above is the 200-day MA, currently near $9,000. That should be a resistance zone. $9,000 would also represent a zone of Fibonacci resistance. Above that level, $10,800 would be the next zone of Fibonacci resistance.
While it is possible institutional buying may have helped this rally, the reality is we are still picking up stories of hacking against exchanges, calls for regulation, and frauds. One story had Bitcoin approaching $10,000 on a crypto exchange known as WEX. WEX, in turn, was a successor to a defunct exchange. Apparently, the problem is people can’t get their money out. WEX operates out of New Zealand. Some believe it is a scam. And therein lies the problem with cryptos. How do you know where you are dealing can be trusted? The reality is you can’t due to a lack of regulation.
There are now 1,690 different cryptos, parodies, etc. listed at Coin Market Cap vs. 1,656 a week earlier. My, how it has grown. The market cap of all cryptos is listed currently at $288 billion vs. $281 billion last week, a small gain of $7 billion. There are 19 cryptos listed with a market cap of $1 billion or higher vs. 18 the previous week. There are 885 defunct, dead, or otherwise coins listed at Dead Coins vs. 876 the previous week. It is simply amazing that the universe grows despite all the pitfalls and the fact that many have lost a substantial amount of money. On the other hand, many have made a substantial amount of money but more likely they are fewer. It would be like finding gold in the Yukon in 1898–1900 during the Gold Rush.
Resistance is up to $9,000, and now that we are back under $8,000 that level could also act as resistance. Support is seen down to $7,000, but below that, another drop towards $6,000 could occur.
© David Chapman
Markets and trends
|
|
% Gains (Losses) Trends
|
|||||||
| Close
Dec 31/17 |
Close
Jul 27/18 |
Week | YTD | Daily (Short Term) | Weekly (Intermediate) | Monthly (Long Term) | ||
| Stock Market Indices | ||||||||
| S&P 500 | 2,673.63 | 2,818.82 | 0.6% | 5.4% | up | up | up (topping) | |
| Dow Jones Industrials | 24,719.22 | 25,451.06 | 1.6% | 3.0%
|
up | up | up (topping) | |
| Dow Jones Transports | 10,612.29 | 10,957.18 | 2.0% | 3.3% | up | up (weak) | up (topping) | |
| NASDAQ | 6,903.39 | 7,737.42 (new highs) | (1.1)% | 12.1% | up | up | up (topping) | |
| S&P/TSX Composite | 16,209.13 | 16,393.95 | (0.3)% | 1.1% | up (weak) | up | up (topping) | |
| S&P/TSX Venture (CDNX) | 850.72 | 707.37 (new lows) | (0.7)% | (16.9)% | down | down | neutral | |
| Russell 2000 | 1,535.51 | 1,663.34 | (2.0)% | 8.3% | neutral | up | up (topping) | |
| MSCI World Index | 2,046.47 | 2,005.98 | 1.2% | (2.0)% | up | down (weak) | up (topping) | |
| NYSE Bitcoin Index | 14,492.18 | 8,142.75 | 9.1% | (43.8)% | up | down (weak) | neutral | |
| Gold Mining Stock Indices | ||||||||
| Gold Bugs Index (HUI) | 192.31 | 165.655 | (3.7)% | (13.9)% | down | down | neutral | |
| TSX Gold Index (TGD) | 195.71 | 182.09 | (3.6)% | (7.0)% | down | down | neutral | |
| Fixed Income Yields/Spreads | ||||||||
| U.S. 10-Year Treasury yield | 2.40 | 2.96 | 2.4% | 23.3% | ||||
| Cdn. 10-Year Bond yield | 2.04 | 2.29 | 5.1% | 12.3% | ||||
| Recession Watch Spreads | ||||||||
| U.S. 2-year 10-year Treasury spread | 0.51 | 0.29 | flat | (43.1)% | ||||
| Cdn 2-year 10-year CGB spread | 0.36 | 0.23 | (8.0)% | (36.1)% | ||||
| Currencies | ||||||||
| US$ Index | 91.99 | 94.46 | 0.2% | 2.7% | up (weak) | up | down (weak) | |
| Canadian $ | 0.7990 | 0.7660 | 0.5% | (4.1)% | up (weak) | down | neutral | |
| Euro | 120.03 | 116.59 | (0.6)% | (2.9)% | down (weak) | down | up | |
| British Pound | 135.04 | 131.09 | (0.2)% | (2.9)% | down | down | down (weak) | |
| Japanese Yen | 88.76 | 90.11 | 0.5% | 1.5% | neutral | down (weak) | neutral | |
| Precious Metals | ||||||||
| Gold | 1,309.30 | 1,223.00 | (0.7)% | (6.6)% | down | down | neutral | |
| Silver | 17.15 | 15.49 | (0.4)% | (9.7)% | down | down | down | |
| Platinum | 938.30 | 831.70 | 0.3% | (11.4)% | down | down | down | |
| Base Metals | ||||||||
| Palladium | 1,061.00 | 918.50 | 3.3% | (13.9)% | down | down | up | |
| Copper | 3.30 | 2.80 | 1.5% | (15.2)% | down | down | up (weak) | |
| Energy | ||||||||
| WTI Oil | 60.42 | 68.69 | 0.6% | 13.7% | neutral | up | up | |
| Natural Gas | 2.95 | 2.78 | 0.7% | (5.8)% | down | down | neutral | |
Note: For an explanation of the trends, see the glossary at the end of this article. New highs/lows refer to new 52-week highs/lows. © David Chapman
© David Chapman
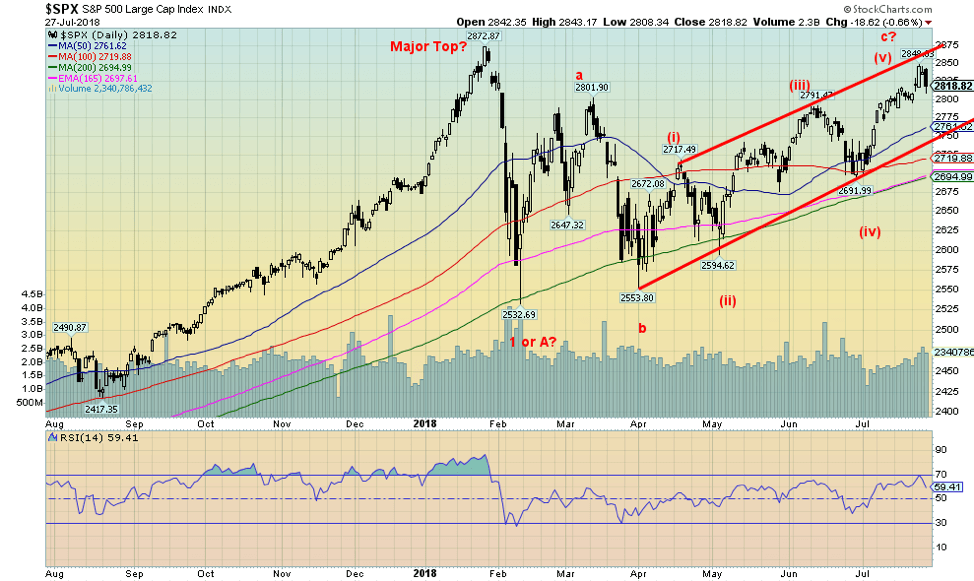
Friday was not kind to the S&P 500 as it fell 0.7 percent. This occurred as we note on the day of the “blood moon.” We cover that further in our “Chart of the Week.” Still, the S&P 500 managed to eke out a gain on the week of 0.6 percent. The Dow Jones Industrials (DJI) continued its recent good run, gaining 1.6 percent while the Dow Jones Transportations (DJT) also gained 2 percent. Friday’s fall came after Q2 GDP was announced at 4.1 percent. Seems the market was in “sell on news” mode. The best is behind and Q3 won’t be as good. Elsewhere, the NASDAQ, thanks to Facebook (FB-NASDAQ), fell 1.1 percent on the week. The TSX Composite was also down, losing just under 0.3 percent while the TSX Venture Exchange (CDNX) continued its losing ways, down 0.7 percent to new 52-week lows. Overseas, the London FTSE was up 0.1 percent, the Paris CAC 40 gained 2.1 percent, the German DAX was up 2.4 percent, while in Asia the Shanghai Composite (SSEC) jumped 1.6 percent and the Tokyo Nikkei Dow (TKN) was up just under 0.1 percent.
The S&P 500 made new highs for the move up but has so far fallen just short of the January highs of 2,873. Could this be a major double top? Time will tell. The neckline is way down around 2,575. So, it has a way to fall just to test that neckline. But if that breaks down, then look out below. The S&P 500 has support down to around 2,760, but below that best support comes in at 2,690 and the 200-day MA at 2,694. Only new highs above 2,848 might change the potential for a decline at this time. Confirmation of a top would come with a break under 2,760.
© David Chapman
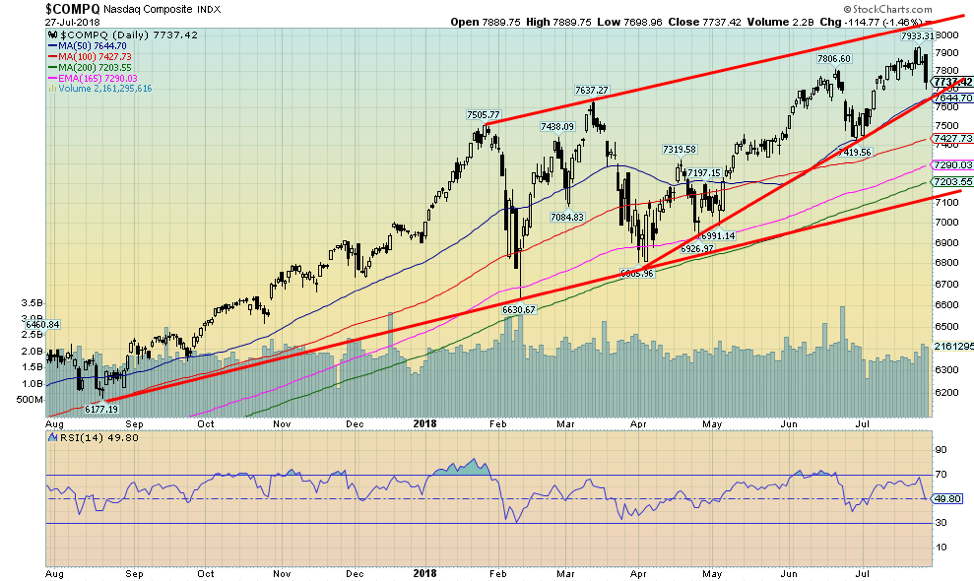
Thanks to Facebook (FB-NASDAQ), the NASDAQ took it on the chin this past week falling 1.1 percent. Twitter (TWTR-NASDAQ) didn’t help as it took a hit this past week. FB lost 35 percent on the week while TWTR fell 21 percent. The decline in the NASDAQ happened after it once again made new all-time highs at 7,933. The Q is down 2.4 percent from that level. The NASDAQ also had an outside week making new all-time highs followed by a lower low below the previous week and a lower close. That is called an outside week “Key Reversal” and it could signal a major top. Interestingly, the biggest drop on the week occurred on Friday, the day of the blood moon (see our “Chart of the Week” below). If this is a key reversal, then follow-through is needed to the downside. And, of course, no new highs must occur. The key breakdown occurs under 7,400 and especially under 7,200. This could be a case of “look out below.”
© David Chapman
Trump was dancing with joy with the release of the Q2 GDP that came in unexpectedly above expectations at 4.1 percent. The market had generally expected a gain of around 4 percent. It was the best gain in four years. The Q1 GDP was revised upward to 2.2 percent.
Given there are so many gimmicks today with regard to the calculation of GDP, one sometimes has to take this with a grain of salt. As well, the distribution of GDP growth has been uneven with certain areas of the country doing quite well and others not so well. The upper echelon of wealthy and professionals have fared the best. But keep in mind all of this is on the back of years of ultra-low, even zero interest rates, billions of dollars of quantitative easing (QE) and, most recently, tax cuts that largely benefit the wealthy. But they add considerably to U.S. debt.
Since the recession of 2007–2009, U.S. government debt has basically doubled and it is expected that the tax cuts will add $1 trillion annual budget deficits over the next decade. Since Trump was elected, the U.S. debt has leaped over $1 trillion at a faster pace than it did in Obama’s final years. Trump’s economic policies may have helped the short-term, but further out the U.S. economy will pay for his prolificacy. Trade wars, currency wars, deregulation, increases to defense spending while continuing to ignore America’s vast infrastructure needs (not to say the devastation being caused by hurricanes and wildfires) all will take their toll.
The U.S. debt is expected to soon cross $22 trillion, the largest in the world. Trump has also railed at the Fed over interest rates and the high US$. It is unprecedented for a President to make that kind of comments about the Fed. The huge amount of stimulus is stoking inflation and the Fed, no matter what the President says, needs to maintain its independence and will very likely hike interest rates again in September. Enjoy the good times of the Q2 GDP. They may not last.
© David Chapman
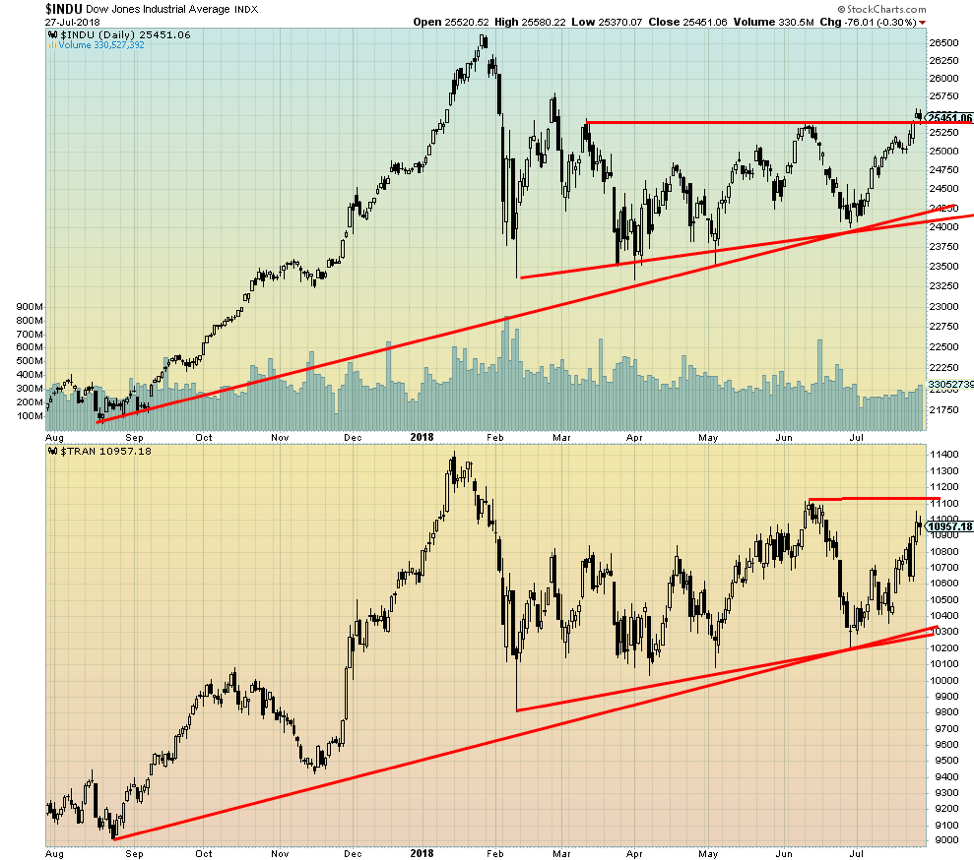
This is clearly unconfirmed, but this past week, the DJI made slight new highs while the DJT did not. Of course, the DJT is not that far away from making new highs. The new highs are only in the context of the current up move as the all-time highs seen in January 2018 remain a considerable distance away. For the DJI, a breakdown under 25,000 would signal danger while for the DJT the breakdown point comes near 10,600 but especially under 10,300. New highs for the DJT would change this scenario. Both the DJI and the DJT have been diverging from indices such as the NASDAQ that did see new all-time highs.
© David Chapman
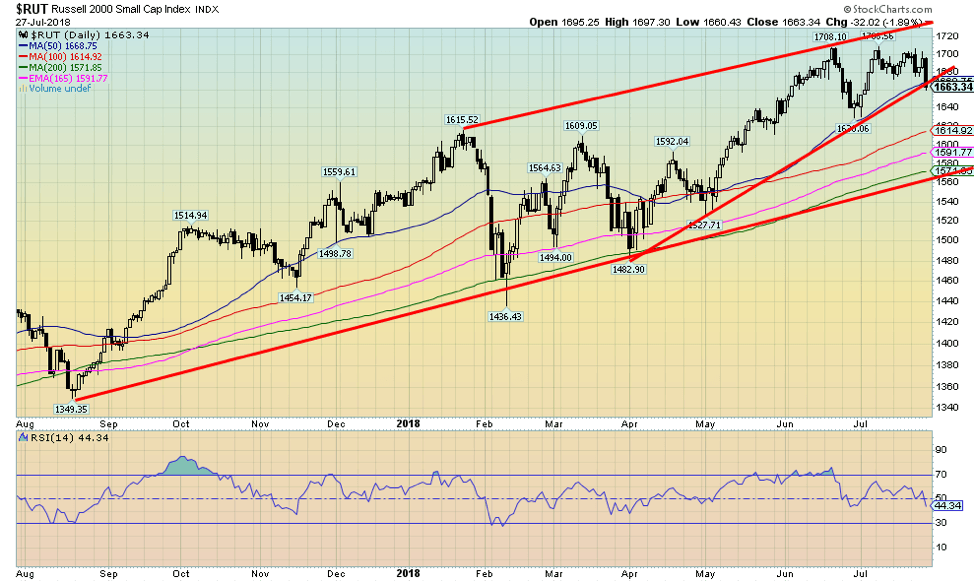
Is the Russell 2000 about to crack? The Russell 2000 has performed admirably, outperforming the large-cap indices such as the DJI and the S&P 500. But a failed attempt at new highs and then Friday’s break appears to suggest the party is over. New lows below 1,630 would confirm a breakdown. There is a potential double top in place with targets down to 1,550 once the Russell breaks under 1,630. New highs would change that scenario. Long-term trendline support can be seen at 1,570.
© David Chapman
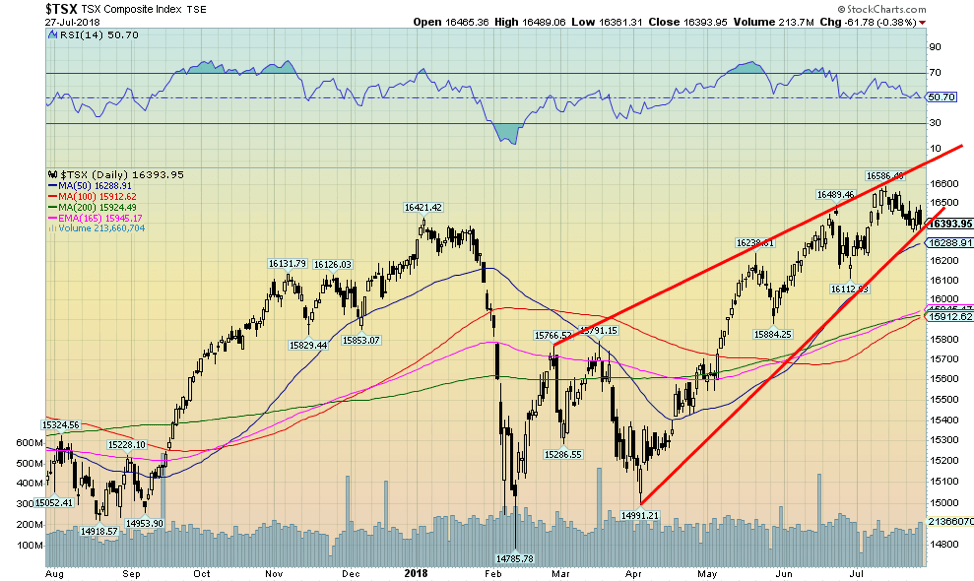
While the TSX Composite continues to form what appears to be an ascending wedge triangle we have failed thus far to have a firm breakdown. The 50-day MA is currently near 16,290, so a firm break under that level could signal the start of a steeper decline. The wedge triangle does suggest a return to the previous low near 14,990. There is considerable support down to 15,900. New highs above 16,590 might change this growing negative scenario. Indicators are turning down.
© David Chapman
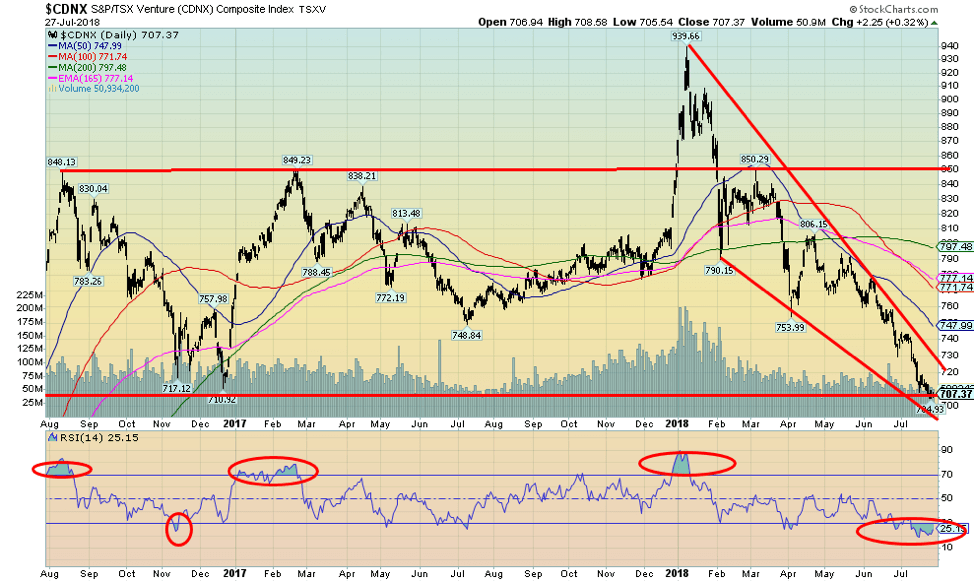
Absolute misery: thy name is the TSX Venture Exchange (CDNX). It just keeps on going down. This past week the CDNX, which is made up of 50 percent junior mining stocks, fell another 0.7 percent and is now down 16.9 percent in 2018. The CDNX is back at lows seen in December 2016. The CDNX had fallen to new 52-week lows.
The good news is the CDNX continues to form what appears to be a huge descending wedge triangle. But we need a spark to lift it out of its misery. A break above 720 would be positive, but there is considerable resistance up to around 775/800. So, there is a lot of work to be done.
On the other hand, it appears to be near the bottom of the wedge triangle. Momentum is slowing and we have had a few weeks now of sub 30 RSI. Readings under 30 do suggest that a bottom could be near but they do not herald a bottom in and of itself. For that we need a rebound and breakout over resistance currently near 720.
© David Chapman
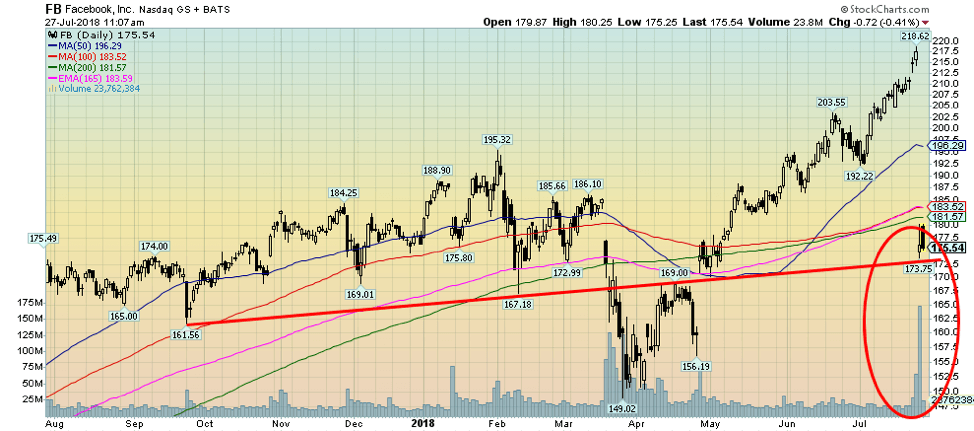
In a shocking move, Facebook (FB-NASDAQ) plunged some 19 percent on July 26, 2018, following the announcement of a revenue miss and a slowdown in daily active users. That had followed significant problems with data leaks and fake news scandals. At one-point, intra-day FB was down some 24 percent before bouncing back. Upwards $119 billion in market cap was wiped out, a historical record drop for one company. To really put this in perspective, the drop was bigger than the entire market cap of Nike, GE, Goldman Sachs, Blackrock, Starbucks, Airbus—and throw in a few small South American economies—combined.
Despite the drop, FB remains above the lows it hit back in March/April 2018 at the height of its data leaks and fake news scandal. That would require another 15 percent drop in value. FB remains up about 360 percent from its IPO level. Mark Zuckerberg, the founder and largest shareholder who holds roughly 28.2 percent of the company, lost about $27 billion overnight. But, no worries—he won’t be standing in line at the food bank any time soon. FB thought its profits could be squeezed for years because of the high costs of improving privacy safeguards and also because of slowing usage of advertisements. Oddly, analysts didn’t see this coming. But then that is what it is like at a top. Surprise!
© David Chapman
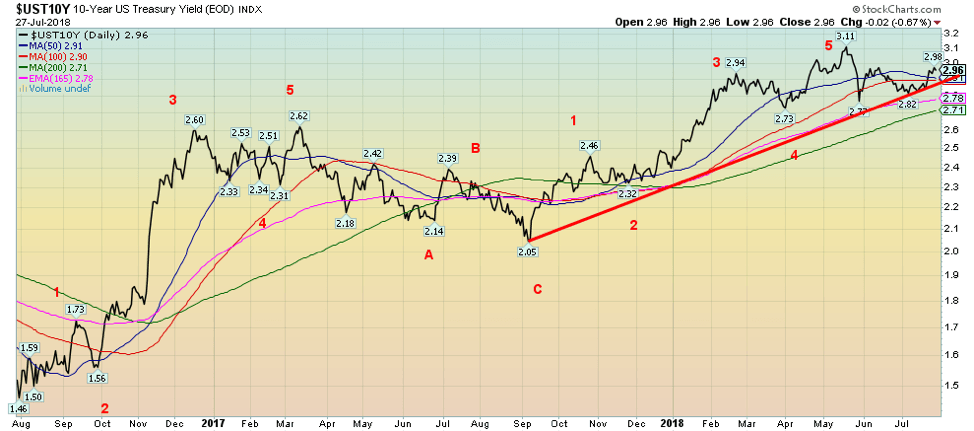
The 10-year U.S. Treasury note jumped 7 bp this past week. The 10-year jumped on news of the stronger than expected Q2 GDP, up 4.1 percent. It was the biggest weekly jump in two months. It keeps the pressure on that the Fed will hike interest rates once again in September, probably by another 25 bp.
On the other hand, PCE inflation was only up 1.8 percent, down from 2.5 percent in Q1. The core PCE inflation rate was 2 percent, but that was also down from Q1’s 2.2 percent. It also didn’t help Treasury yields that rose on news that the BOJ might ease up on its easy money policies. That news sparked selling in both Japanese Government Bonds (JGBs) and U.S. Treasuries. The ECB, on the other hand, has signaled that they will ease off their easy money policies in the summer of 2019. The bond market didn’t react to consumer sentiment that came in at 98.2 in June vs. 97.9 in May. The market had expected 97.3.
Recession watch spread
© David Chapman
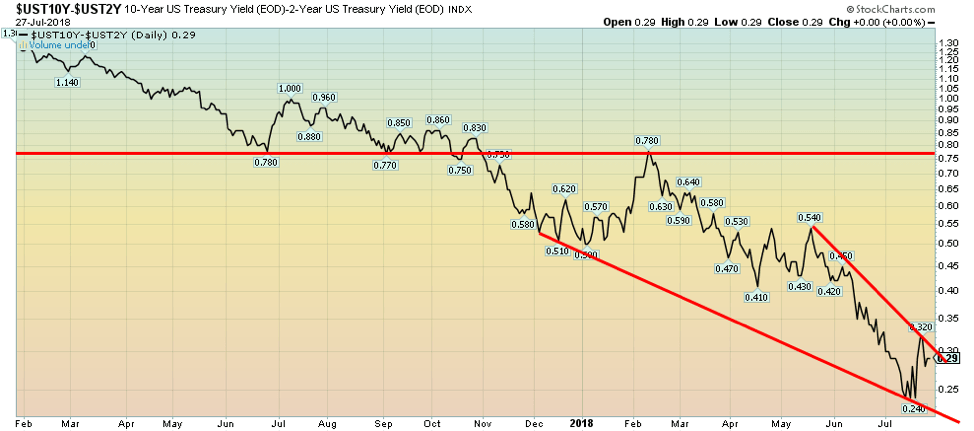
Nothing has changed this past week with our recession watch spread as it remains at 0.29 percent. Both the 10-year and the 2-year Treasury notes rose this past week by 7 bp. The downward trend for the 2–10 spread is maintained, and we continue to believe that by sometime in 2019, we should cross into negative territory. We, therefore, continue to be on target for a possible recession starting sometime in 2019.
© David Chapman
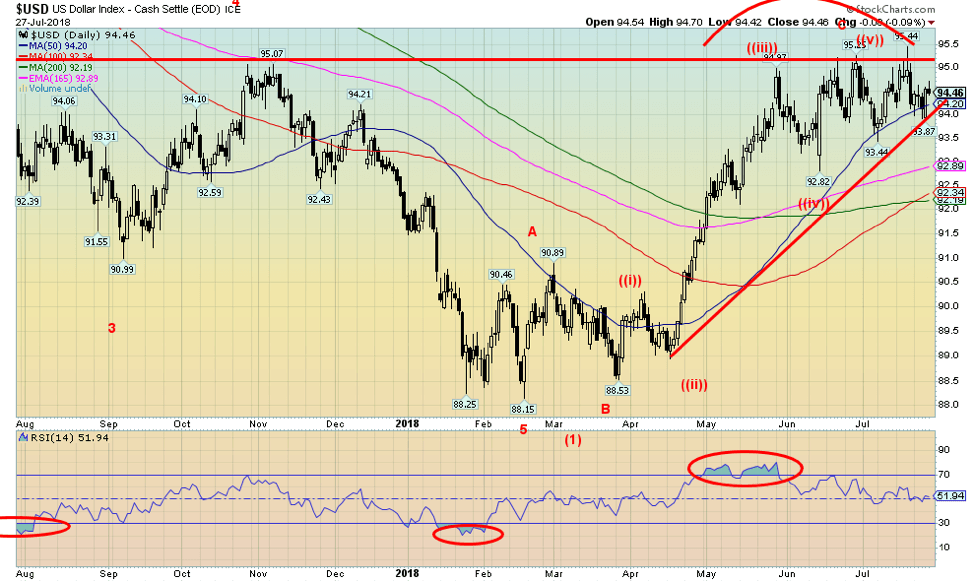
The US$ Index continues to hang up. Pushed by stronger than expected GDP growth, and the certainty that the Fed should hike interest rates two more times in 2018, the US$ Index has been foraying near 95. So far, it has failed to break firmly over that level. It has fulfilled targets that suggested at least 95.25 with a high so far of 95.44.
What hasn’t happened is a breakdown. Right now, the breakdown level is looming closer currently near 94. There would be good support down to 92. All of this is based on the US$ Index not making new highs above 95.44. This past week the Cdn$ gained 0.5 percent, the Euro was lower by 0.6 percent, the British Pound—thanks to continued Brexit concerns—fell 0.2 percent, but the Japanese Yen strengthened, gaining 0.5 percent. The US$ Index gained 0.5 percent this past week, mostly because of the fall in the Euro and the Pound. We appear to have completed five wave ups from the February 2018 low at 88.15. At a minimum, we should now start a corrective period. As long as it holds above 92 the US$ Index could regroup and make another attempt on the highs.
© David Chapman
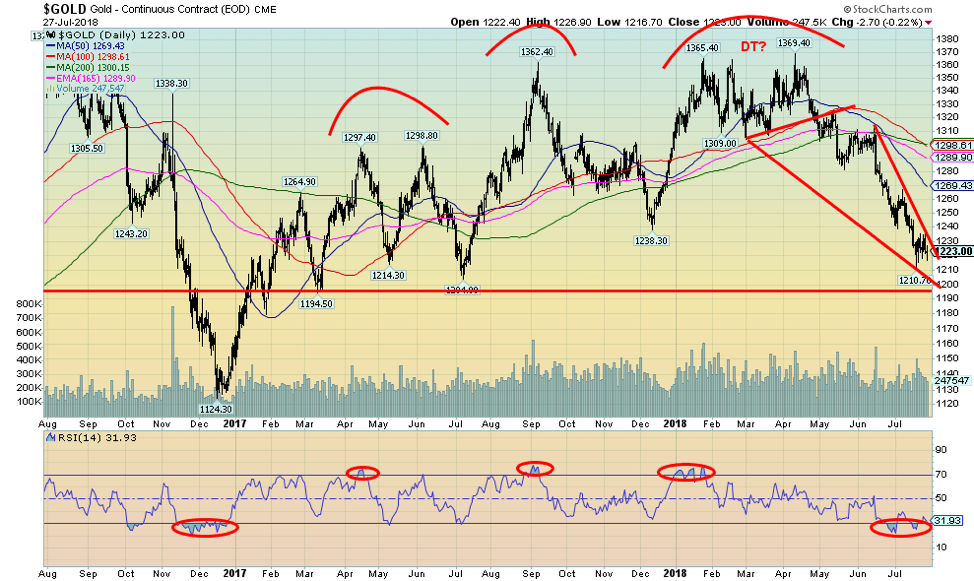
Gold just keeps on tumbling, this time falling 0.7 percent this past week and is now down 6.6 percent on the year. In Cdn$ terms, gold has fallen 2.5 percent in 2018. Gold prices remained pressured with the most recent low seen on July 19, 2018, at $1,210.
Seasonally, we should be positive or at least prepared to turn higher, but as we note below with a longer-term chart of gold we may still be poised to see lower prices into year-end as gold completes 34-month and 11.3-month cycles. Gold appears to be in a descending or falling wedge triangle. If we break out above resistance at $1,240/$1,250, we could at least get back to around $1,310. However, we would need to break over $1,320 to suggest a potential run to the earlier highs near $1,370. That level remains a longer-term ceiling.
As to floors, the longer-term floors are around $1,200 and $1,125. Gold may have made a double top back in January and April at $1,365 and $1,369. That potential double top had potential targets down to at least $1,255. The low so far is at $1,210, so we appear to have fulfilled that target. Technically, the next target could be down to $1,230 and that target was hit as well. The next target would have been down to $1,222 with the next one at $1,215. Given those levels have all been achieved, only a breakdown under $1,205 would suggest even lower prices. So far, we have held above that level.
The sentiment is as poor as we have seen since the major low in 2015 at $1,045. A potential rally could get underway at any time. The question is, how high will it carry us? Only above $1,370 can we really suggest $1,400 and higher. Until then, there appears to be a ceiling up around $1,310/$1,320.
© David Chapman
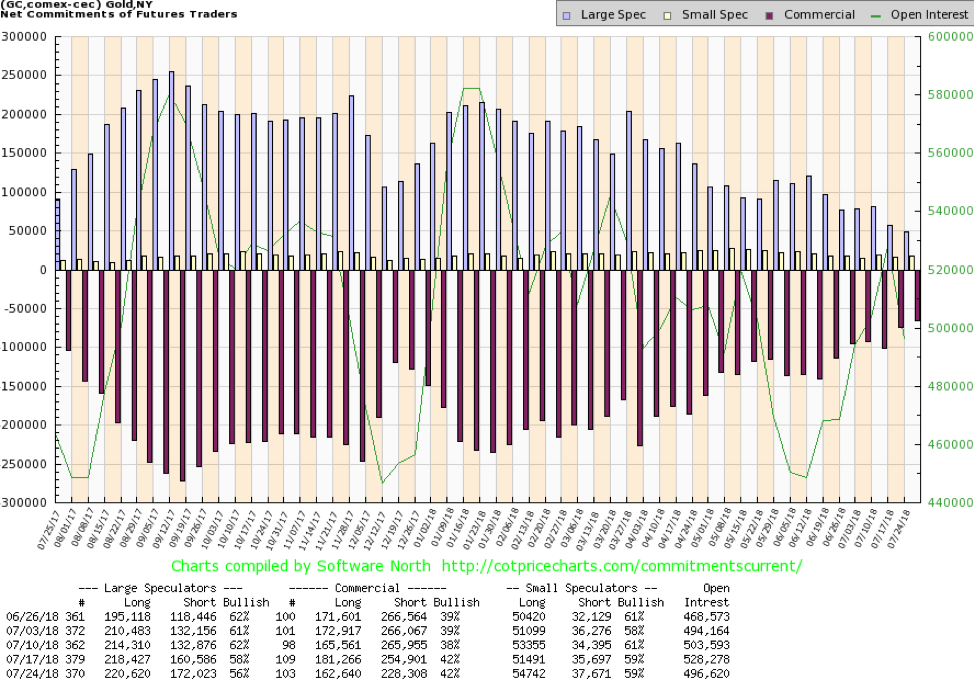
The gold commercial COT was steady this past week at 42 percent. Despite that, long open interest did fall roughly 19,000 contracts, but short open interest also fell down almost 27,000 contracts. The large speculators COT (hedge funds, managed futures, etc.) slipped to 56 percent from 58 percent even as they increased long open interest by about 2,000 contracts, but short open interest jumped just under 12,000 contracts. The gold commercial COT remains positive and bullish going forward.
© David Chapman
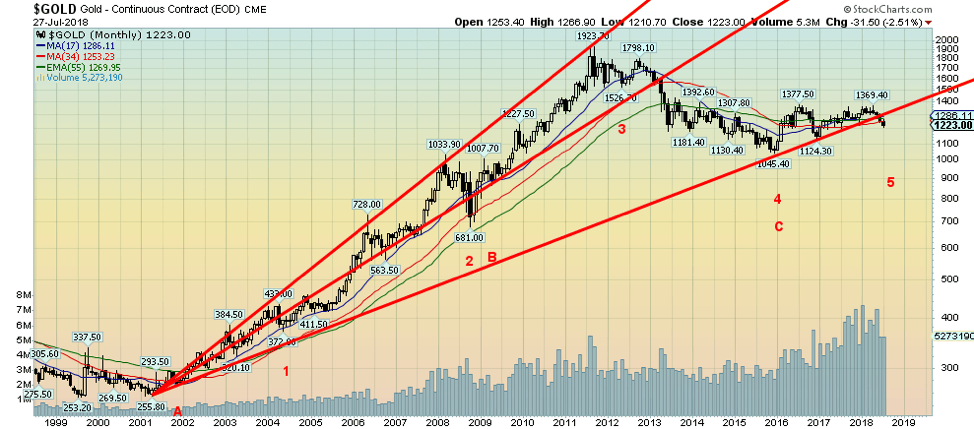
Here is a longer-term chart of gold since the beginning of this century. We put a fan line on gold from the major low in 2001. We appear to be breaking under the second fan line. When we broke under the first fan line in 2013 the market crashed over the next several months finally bottoming in December 2015. We have labeled some potential cycle lows starting with the major low in February 2001. Ray Merriman of M.M.A. Cycles has postulated that gold has a roughly 7.83-year cycle of major lows with a range of 7–9 years or 86–102 months. Starting from the major low in 1976 (free trading gold does not have a long history) we saw major lows in 1985, 1993, 2001, 2008, and again in 2015. The last three are labeled A, B, and C. The next 7.83 cycle low is not due until 2023–2024. A, B and C are examples of the 7.83 cycle low.
The 7.83 cycle usually breaks down into three cycles of 34 months. We have labeled those 1 through 5 above as we saw significant lows from the 2001 low in 2004, 2008, 2011, and 2015. The range on the 34-month cycle is roughly 28–40 months. The next 34-month cycle is due October 2018 +/- 6 months. We are now in that cycle window range as we are headed down. Merriman next postulated that the 34-month cycle breaks down into three cycles of 11.3 months. From the major December 2015 low, we saw lows in December 2016 and December 2017. The third and final 11.3 cycle low of the current 34-month cycle is, therefore, due anywhere from early September 2018 to as late as February 2019. So, we are not quite in that window.
That is why we have postulated that gold could have a seasonal rebound, and then fall once again to potential new lows to complete the 11.3-month cycle and the 34-month cycle. From there a new 34-month cycle would get underway.
© David Chapman
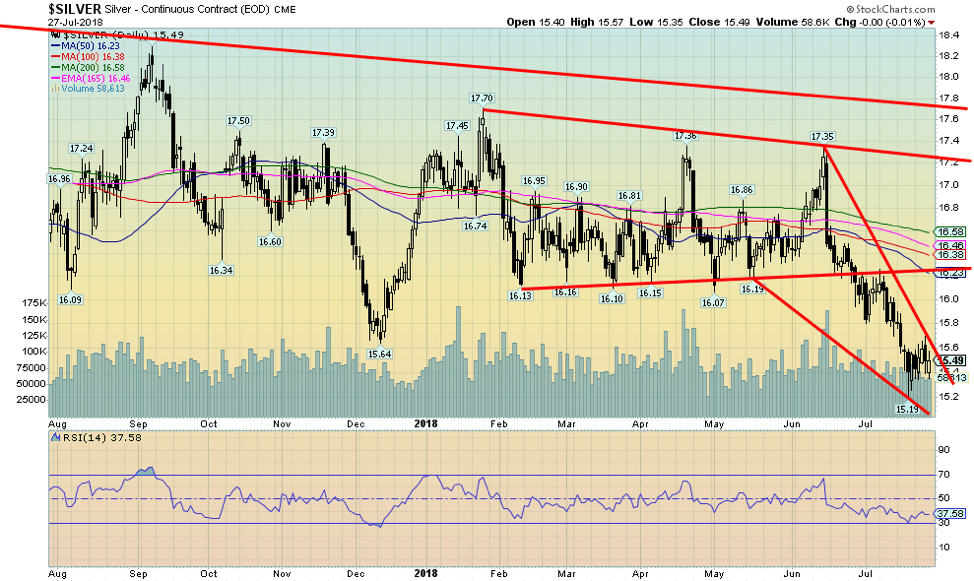
We can’t say we are pleased with the performance of silver as it fell this past week by 0.4 percent. Silver is now down 9.7 percent in 2018, as performance continues to be weak. Small consolation that silver is only down 5.7 percent in Cdn$ terms.
Silver may have formed a large triangle from January to June and has now broken down from that triangle. Potential targets are down to $14.50/$14.60. That would be just above the July 2017 low of $14.34. That low was a spike. Silver could, in theory, do that again.
Silver fell below the December 2017 low of $15.64 and that signaled that prices should fall further. They have and since it is now a year since the July 2017 low silver recently made new 52-week lows at $15.19. We could be optimistic that as long as silver remains above the recent low at $15.19 we could at least make a run to test the rolling over 50-, 100-, and 200-day MAs between $16.20 and $16.60. Only above $16.90 would we be confident that a new and potentially stronger upswing could be underway.
Volume has fallen off during this drop, reflecting the weakness in the market where effectively bids just step away. Oversold prices are just that—oversold—and they can get even more oversold. If it is a small consolation, both platinum, palladium, and copper all rose this past week with platinum gaining 0.3 percent, palladium up 3.3 percent, and copper up 1.5 percent. Could they be leading? First, we need regain above $16.20 to suggest some higher tests. But more important, we need to break over $16.60/$16.90. And hold the recent low at $15.19.
© David Chapman
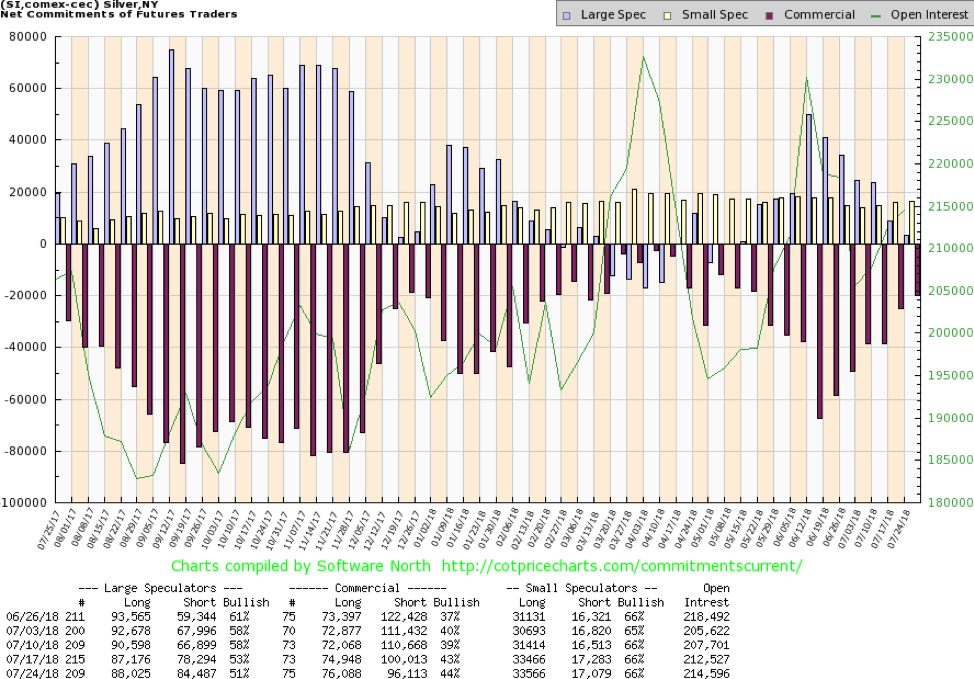
The silver commercial COT, like the gold commercial COT, remains potentially quite positive. The silver commercial COT improved this past week to 44 percent from 43 percent as long open interest rose just over 1,000 contracts while short open interest fell about 4,000 contracts. The large speculators COT fell to 51 percent from 53 percent as they continued to add to shorts with short open interest rising roughly 6,000 contracts. Long open interest was also up by a modest 1,000 contracts. We continue to note the silver commercial COT remains bullish for silver.
© David Chapman
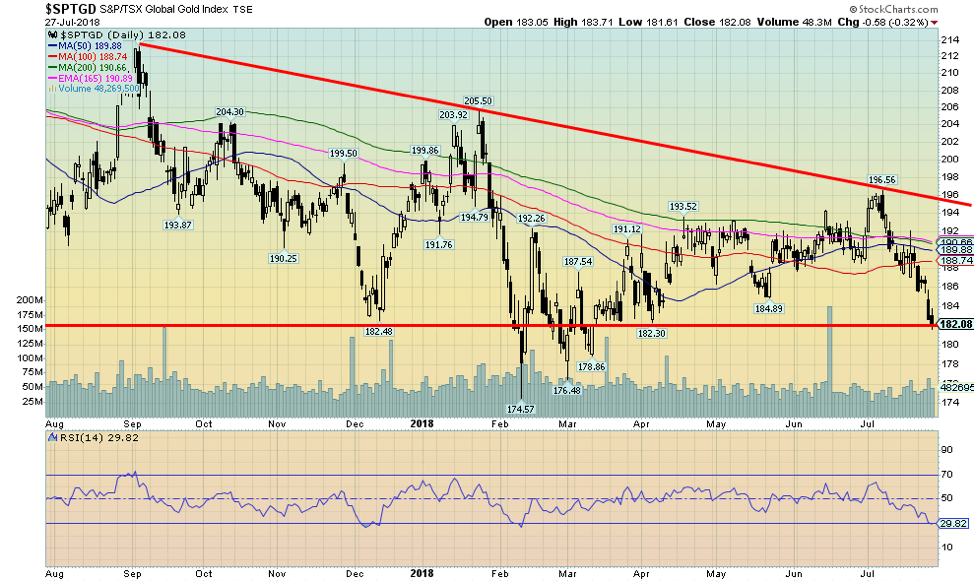
Misery thy name is the gold stocks. Okay, we are not back down to where they were in 2015. The TSX Gold Index (TGD) bottomed back then at 114.48. Since then, we are actually up almost 60 percent. Thank goodness, the gold stocks had done such a good job of outperforming both gold and silver. The TGD fell 3.6 percent this past week while the Gold Bugs Index (HUI) was down 3.7 percent. This has come against the backdrop of extreme negative sentiment with regard to the gold stocks. Gold and gold miner advisory services have seen an exodus of followers. A junior gold mining company can report excellent results and the stock goes down. Those who believe in gold as money can only fume that “the price is being manipulated.”
Technically, we can make an argument that the TGD could fall further to potential targets near 170. The February 2018 low was just under 175 and the December 2016 low was near 172. We could also argue the TGD has been forming a huge descending triangle over the past two years and a firm breakdown under 170 could target all the way back to the 2015 low near 114. Perish the thought. If that were correct, following at least a rebound that takes us back to the top of the current triangle, the next move down could be relentless into the end of the year. We noted earlier, the possibility of a major 34-month cycle low this year. A rebound rally would take us back up to around 190–194 but fail once again to break out. So, even if we get some positive seasonals, we will need to monitor the rebound carefully. A firm breakout above 200 would, however, be quite positive.
Chart of the week (1)

(Photo by Irvin calicut via Wikimedia Commons. CC BY-SA 4.0)
Okay. We know. This is a rather strange chart. Not really a chart at all, but a picture of what is known as a “Blood Moon.” On Friday, July 27, 2018, the moon moved into the shadow of the earth for the longest lunar eclipse of the 21st century.
As reported in Agora Financials’ “5 Minute Forecast,” a Cambridge Astronomy professor said, “it’s called a blood moon because the light from the sun goes through the Earth’s atmosphere on its way to the moon and the Earth’s atmosphere turns it red in the same way that when the sun goes down it goes red.”
The “5” then went on to explain there appears to be some connection between blood moons and market crashes. They even noted that for “some Christian ministers, the fourth and final eclipse in a tetrad—four consecutive total lunar eclipses, each separated by six lunar months—fulfills biblical prophecy of the Apocalypse.”
Yikes! Crashes and the Apocalypse. The “5” went on to note that a researcher by the name of Steve Puetz looked into a number of market crashes. He started with the Tulip Mania crash of the 1630s and ended with the Japanese financial crash of 1989–1990. It included the U.S. crashes of 1929 and 1987. What he discovered is they took place with a few days of a full lunar eclipse. And each lunar eclipse took place within six weeks of a solar eclipse. Well, guess what. The next solar eclipse is due August 11.
Making this even spookier was that Mars was the closest to earth it has been in 15 years and will shine very brightly. Mars is represented by the God of War. Then we read that Trump wants to attack Iran, the U.S-led NATO is tightening its circle around Russia, and U.S. and Chinese warships keep almost bumping into each other in the South China Sea.
All we could think of is that, well, we’ll still be alive following a market crash. But following an apocalypse?
Chart of the week (2)
© David Chapman
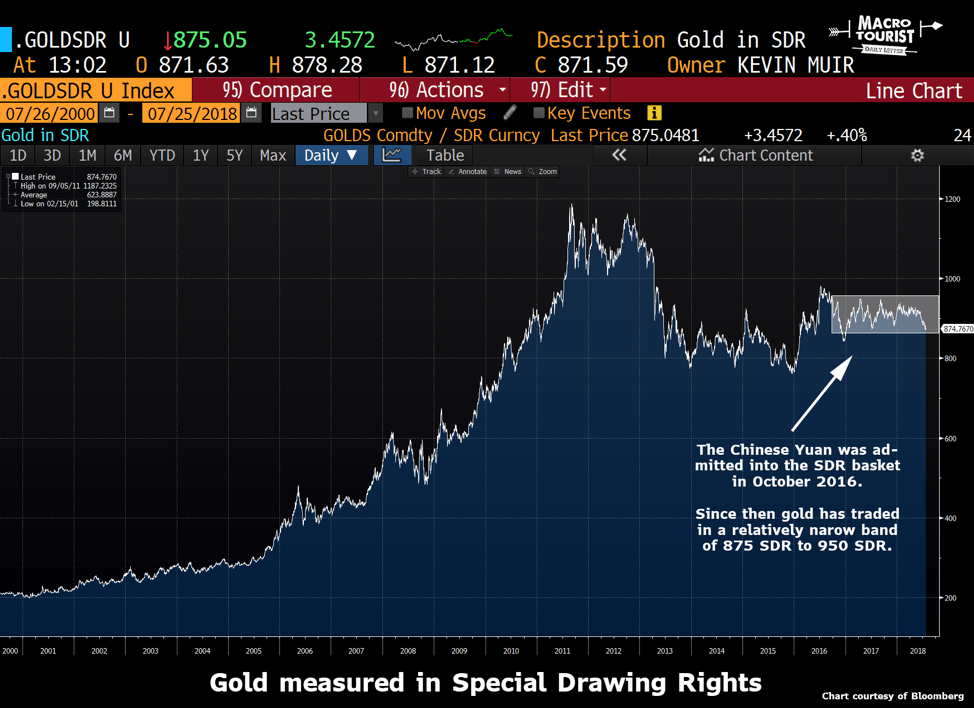
We have seen a few stories recently musing about whether the Chinese have pegged gold to SDRs. A few articles have circulated emanating from Jim Rickards, lawyer, speaker, gold speculator, and media commentator. Rickards has written a number of books including “Currency Wars” and “The Death of Money.” He is a long-time Wall Street veteran who was general counsel for Long-Term Capital Management (LTCM), the giant hedge fund at the center of the financial crisis of 1998 that almost collapsed the global financial system. Rickards has advised the U.S. Department of Defense, the U.S. intelligence community, and major hedge funds on global finance.
What are SDRs? SDRs or Special Drawing Rights were created by the IMF in 1969 to provide central bank liquidity for expanding trade that could not be met by US$ or gold. They are reserve assets based on five currencies: US$, Euros, Japanese Yen, British Pounds, and Chinese Yuan. SDRs can be exchanged for any of those five currencies. The weights of each currency are as follows: US$ – 41.7 percent, Euros – 30.9 percent, Yuan – 8.3 percent, Japanese Yen – 8.1 percent, and Pound Sterling – 10.9 percent. For more information, check out the International Monetary Fund Special Drawing Right (SDR) Factsheet.
Since the time the Yuan was added to SDRs back in October 2016, the price of gold expressed in SDRs has traded roughly between 850 and 950 SDRs. As a result, Rickards has opinioned the Chinese are controlling the price by pegging the price of gold to SDRs. Given gold’s recent sharp decline, it is interesting to note the price of gold in SDRs has been relatively stable in comparison.

© David Chapman
The second chart shows the price of gold in Yuan. It is interesting here to note the price of gold in Yuan has also remained relatively stable since the Yuan (or the renminbi) has been added to SDRs back in October 2016. Recently the Chinese pushed or devalued the Yuan lower as a move to counter the U.S.’s tariffs on Chinese goods. A lower Yuan would help China offset the negative impact of the tariffs. That, in turn, prompted Trump’s musings about the Fed pushing up interest rates thus pushing up the US$ and that the Chinese were currency manipulators. Shots in what could be a nasty currency war.
There are those that don’t agree, but we post this here as it is an interesting thought. As we do know the Chinese (and Russians) have been accumulating gold to shore up their currencies and help them in their move away from the global US$-based system. History has shown that reserve currencies come and go, and there are often extremities during those periods as the world transitions from one major reserve currency to another. The last one was the demise of the British Pound as the global reserve currency. During that period, the world went through two world wars and a Great Depression before the US$ emerged as the world’s reserve currency following Bretton Woods in 1945.
While there appears to be some circumstantial evidence that China is maneuvering a gold peg to SDRs it is, we admit, merely an opinion. We can’t actually verify that. Gold has been breaking down and the chart action, as we have noted, is decidedly bearish with an extreme negative sentiment. Until the price of gold turns around as we have noted, there is no reason it can’t actually go even lower and might even break down in SDRs. Unless the Chinese somehow intervene to maintain what some believe is a peg.
The latest from Rickards can be seen here: As the Reset Begins, Get Gold.
—
DISCLAIMER: David Chapman is not a registered advisory service and is not an exempt market dealer (EMD). We do not and cannot give individualized market advice. The information in this article is intended only for informational and educational purposes. It should not be considered a solicitation of an offer or sale of any security. The reader assumes all risk when trading in securities and David Chapman advises consulting a licensed professional financial advisor before proceeding with any trade or idea presented in this article. We share our ideas and opinions for informational and educational purposes only and expect the reader to perform due diligence before considering a position in any security. That includes consulting with your own licensed professional financial advisor.

-

 Biotech2 weeks ago
Twogee Biotech Advances Industrial Enzyme Solutions for Circular Production
-

 Crypto1 day ago
Uniswap and BlackRock Partner to Launch BUIDL in DeFi
-

 Cannabis1 week ago
Scientifically Verified F1 Hybrids Set New Benchmark for Indoor Cannabis Yield and Consistency
-

 Fintech4 days ago
Impacta VC Backs Quipu to Expand AI-Driven Credit Access in Latin America


You must be logged in to post a comment Login