Featured
NASDAQ hits new all-time highs while other big indices fall
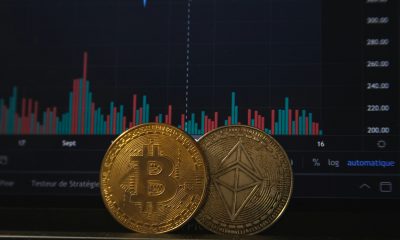
The NASDAQ, Russell 2000 and S&P 600 all rose to new heights while DJI and other big indices did not amid fears of trade wars.

U.S. President Donald Trump’s trade levies against Canada, Mexico, the EU, and his prime target China are being met with concern but certainly not any great panic even as to how all are threatening to retaliate. The NASDAQ has soared to new highs thanks primarily to the FAANGs (Facebook, Apple, Amazon, Netflix, Google), small-cap stocks as represented by the S&P 600, and the Russell 2000 which have also soared to new highs. And, surprise—here in Canada, the TSX Composite has joined the party and has eked out new all-time highs. Trump trade wars? Harrumph! Happy days and smileys seem to be the order of the day.
Not all major markets are making new all-time highs. Major markets in Europe remain well off their highs. In the U.S., the Dow Jones Industrials (DJI), the Dow Jones Transportations (DJT), and the S&P 500 remain back of their all-time highs seen in January 2018. Others including the NYSE, the S&P 100, and the Wilshire 5000—the broadest market of all—remain below their all-time highs. These divergences are not uncommon at potential major tops and bottoms. Until, however, all markets break down, there remains the possibility that these markets will confirm and make new all-time highs.
It helps as well that the U.S. economy continues to hum along, seemingly oblivious to all around it. Evidence suggests the U.S. economy could expand even faster in 2018. Retail sales, for example, in May were up 0.8 percent—double the forecast. Unemployment (U3) is at its lowest level in years at 3.8 percent. Forget that hidden unemployment brings it to 21.4 percent as reported by Shadow Stats. GDP growth is being forecasted by some economists to hit 3 percent in 2018, yet there is persistent evidence that underneath. the U.S. economy is rotting. The impact of Trump’s tax cuts has still not been fully seen and the $2.5 trillion of debt it will add is down the road, later.
Many believe that while the potential for trade wars is there, a lot of it is bluff to get a better deal. Eventually, sanity will prevail. Or will it? Even Canada’s Prime Minister believes that Trump would not impose new auto tariffs given the destruction it could cause, particularly to the Canadian and Ontario economy. It would also negatively impact the U.S. economy and U.S. workers. So much of what is being projected is just that—projections, as in yes, this could happen, or that could happen, but will it? Some believe it is a powerful show of strength for the midterms and a demonstration that Trump means business and he will get things done as he promised.
But there is always the risk of a major mistake and that the trade wars turn ugly and job losses start to mount. Already, the world is feeling a chill because of the threats being hurled back and forth over trade. Tit-for-tat trade measures do no one any good. China is not a country that is about to back down. Slagging your allies over trade is not a wise idea at any time. Trade wars hurt American workers as much as they hurt workers in other countries.
And the U.S. is not making it any easier with its increasing isolationism as it has backed out of the Paris Climate Accord, the Trans-Pacific Partnership (TPP), the Iran nuclear deal, and more recently, the U.N. Human Rights Council. The U.S. has also questioned NATO and the U.N. and other international bodies, even as NATO under the U.S. tightens its military chain around Russia and the U.S. challenges China militarily in the South China Sea. Finally, U.S. forces are engaged in Syria, and Syria wants them out. This could, in turn, result in clashes involving Syria, the U.S., and even Russia. The Syrian theater is a very dangerous place when one considers that not only are there Syrian, Russian, and U.S. forces in the area, but there are also Iranian, Iraqi, Hezbollah, Israeli, U.S.-backed rebels, and ISIS in the mix.
Other events, such as the major imbroglio over children being held in cages, is merely a distraction and doesn’t really impact markets. But it too could erupt in major protests in the U.S., and that, in turn, could roil markets. At the height of the Vietnam war protests, the DJI fell over 30 percent from 1968 to 1970. Jitters over the Vietnam War coupled with the protests and rising inflation resulting in the tightening of credit conditions by the Fed contributed considerably to the decline. The counter rally that followed 1970-1972 was on hope to the end of the Vietnam War. The reconciliation with Kim Jong Un could mean peace and lessen the chance of a major war. So that is good. Until it isn’t.
All of this is against a backdrop of a world in debt estimated at $237 trillion, up roughly $90 trillion since the financial crisis of 2008. The U.S., with over $70 trillion in debt (government, corporations, and consumers) is the world’s largest debtor. The Fed is continuing its rate hikes and has suggested that two more are coming in 2018 and possibly more in 2019. History suggests that the Fed invariably starts its rate hikes too late and then hikes at least two too many times, thus triggering the next recession.
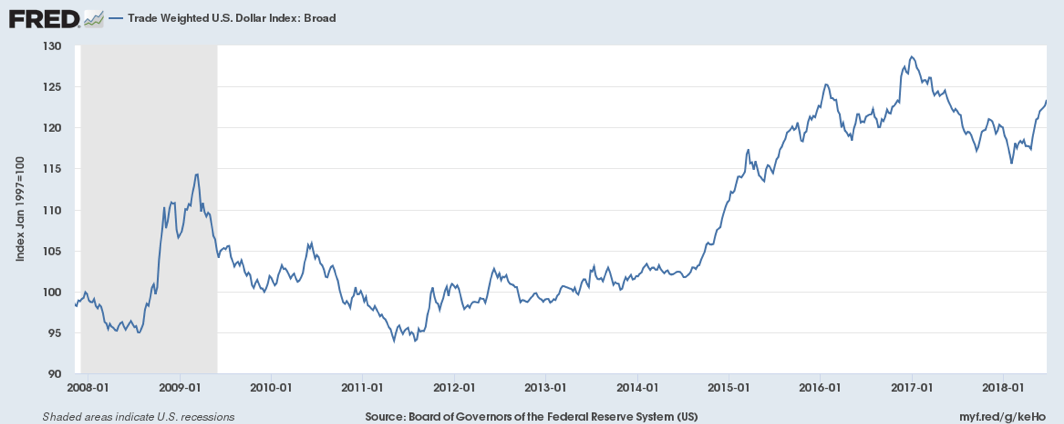
Rising interest rates have in turn put upward pressure on the US$. The US$ Index is up over 30 percent since 2011 and the low in 2008. Even since 2014, the US$ Index is up over 20 percent. When applied against a broad basket of currencies, the rise is the same as noted in the chart below of the Trade Weighted U.S. Dollar Index – Broad.
A huge amount of debt around the world is denominated in US$, particularly in emerging markets. Rising interest rates, coupled with a strong US$, is a double whammy to all this debt. Rising interest rates, coupled with the perception of a stronger economy in the U.S., pull capital out of other countries to the U.S. The fear is that the world could face an emerging market debt crisis. Argentina has already been to the IMF for a loan to prop up the peso. Behind Argentina, there are other emerging economies that could tip over. Recall it was the collapse of Russian debt in 1998 that almost brought down the global financial system back in 1998. In 1997, the Asian financial crisis sparked fears of a global economic meltdown.
An emerging market default could trigger a domino effect as others fall that in turn bring down banks and ultimately threaten the international banking system as a global liquidity crisis develops. Today, the world’s central banks led by the Fed, the ECB, the BOJ, and the BOE are ill-prepared and ill-equipped to deal with another financial crisis on the scale of 1998 or 2008, given they have never recovered from the 2008 financial collapse.
Trade Weighted U.S. Dollar Index: Broad
© David Chapman
The rising US$ has put downward pressure on gold, but that hasn’t stopped a number of countries, including China and Russia, from adding to their gold reserves. Nor has it quelled gold demand that remains strong. Russia, in particular, has not only added to its gold reserves but it has cut its holdings of U.S. Treasuries in half over the past year. Despite China being embroiled with the U.S. over trade and military disputes, China has not only added to their gold reserves but increased their U.S. Treasuries holdings by $100 billion in the past year. Some other countries, notably Turkey, have also added to their gold reserves and cut their holdings of U.S. Treasuries.
While the U.S. economic growth appears to be continuing, there are signs the rest of the world is slowing down. Purchasing managing indices globally has slowed for both manufacturing and services. Slowdowns are being seen in the EU and Asia, and there are signs that Canada too could slow down, considering the ongoing trade war with the U.S. There are persistent signs of banking troubles, particularly in Italy, and constant rumors about the state of Deutsche Bank, one of the world’s largest banks.
A reminder that debt collapse is the one constant in recessions and even more so in depressions. In many ways, the world has never fully recovered from the financial collapse of 2007–2009. GDP growth such as it has been in the U.S., the EU, and Japan has been predicated on a mountain of debt, endless quantitative easing (QE), and years of artificially low interest rates.
Against this backdrop, the leader of the world’s largest economy and supposedly of the free world persistently lies and presents alternative facts as the truth. He is under investigation and could be impeached, as related investigations of others have led to indictments, including some being jailed. He slags allies, cozies up to dictators that he admires, and his trade wars could bring down the global economy and global financial institutions. At some point, a point that is getting closer, the global economy does crack, global stock markets fall, a major debt default occurs, and the world plunges into another financial collapse and recession that could be far worse than 2008. And the world is ill-prepared for it.
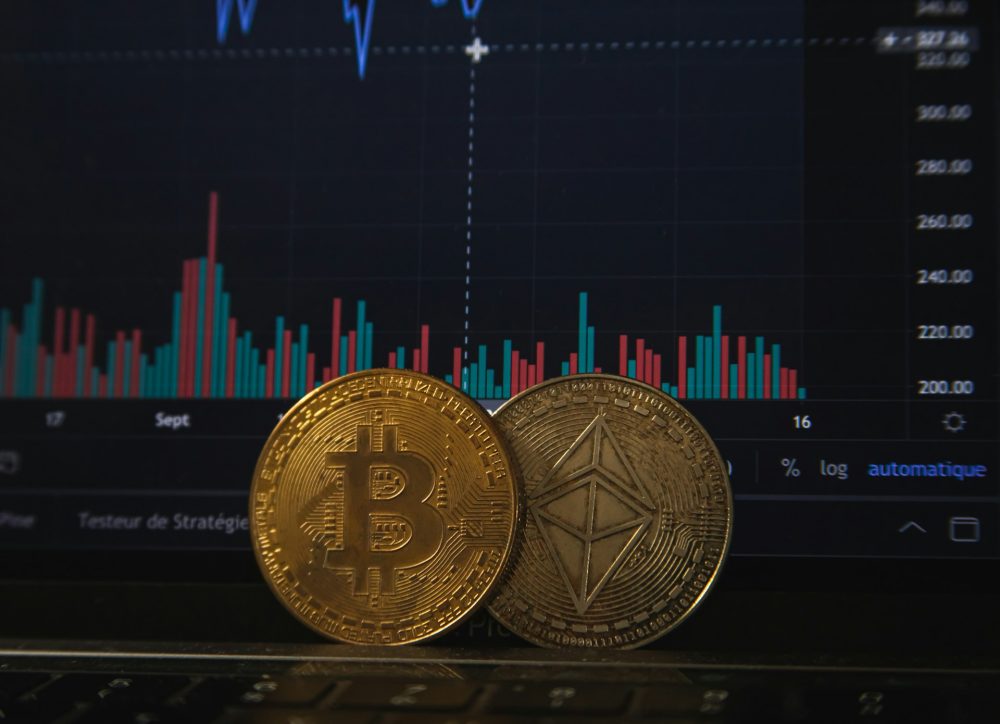
Bitcoin watch!
© David Chapman
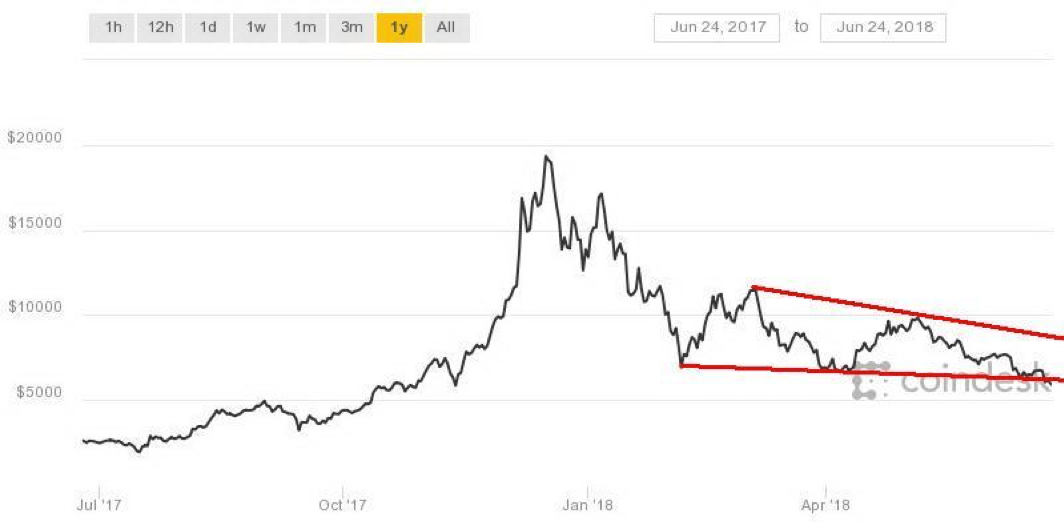
After spending most of the past week attempting to break back over $6,800, Bitcoin appears poised instead to fall through $6,000. As we write, Bitcoin has traded as low as $5,800. Bitcoin, it appears, cannot get out of the way of itself. As we have often thought, you can’t just create money out of thin air. And when there are upwards of 1,600 different cryptocurrencies, the universe is just too big to accommodate them all. It hasn’t stopped some from becoming multimillionaires.
It was especially fascinating reading about the crypto millionaire behind Ethereum (ETH) and his recent purchase of a condo in the St. Regis (formerly the Trump Hotel) for roughly $28 million (“This is the $28 million home that crypto bought,” The Globe and Mail, ROB, Friday, June 22, 2018). The condo on floors 56 through 58 has 17,000 square feet and a 100-foot-high ceiling with views of outdoor spires towering over Toronto’s skyscrapers. Apparently, no mortgage was listed and on top of the buying price, $3.2 million was paid in HST. Monthly condo fees are $17,000. Ethereum is the second-largest crypto behind Bitcoin with a market cap of roughly US$48 billion. The owner is listed in Forbes with a net worth between $750 million and $1 billion. Such is the life of a crypto millionaire.
We hope he can keep it. ETH peaked back in January 2018 with a market cap over US$134 billion. Since then, it has fallen roughly 67 percent. Given that cryptos are down on the week with Bitcoin falling 9.5 percent, it is not surprising that the market cap of all cryptos, according to Coin Market Cap, has fallen to US$242 billion, down $38 billion on the week. Bitcoin appears poised to fall under $100 billion market cap. At its peak, it had a market cap of $320 billion. The number of cryptos listed at Coin Market Cap has also fallen to 1,586 down from 1,629 the previous week. Attrition, it seems, is finally getting underway. According to Dead Coins, there are 817 listed cryptos as either failed, hacked, a scam, or a parody. Yet people still keep entering into the sphere. Fools and their money are soon parted.
It is no surprise to learn that many cryptos have been manipulated. After all, when you have a new market and a lot of new buyers in the sector, it should come as no surprise there are those who would take advantage of what remains a thin market. It is an ideal place for manipulation to favor a few over the uninitiated. The sphere has also invited what are effectively Ponzi schemes. Regulators, including those in Japan, China, Korea and the U.S., are also becoming aggressive in cracking down on cryptos. What has essentially been a cowboy world is being tamed, but it is not necessarily friendly for them, and there remains a lot of work to be done to clean them up.
This past week, another Korean crypto exchange, Bithumb, lost $30 million through a hack. This came just weeks after another crypto exchange, Conrail, lost upwards of $40 million. These hacks, failures and more are what give cryptos a bad name and lead to the current downward march.
Bitcoin and the cryptos have even been accused of creating an environmental disaster. A report from the Bank for International Settlements (BIS), the central bank of the central banks, has noted the huge amount of energy used to verify transactions. Bitcoin miners, it seems, are using as much electricity as Switzerland. And that is now. If cryptos expand further, it could get worse. Currently, the number of crypto transactions is small. If it became like VISA or MasterCard, the electricity grid would collapse. It also leaves the system open to disruption.
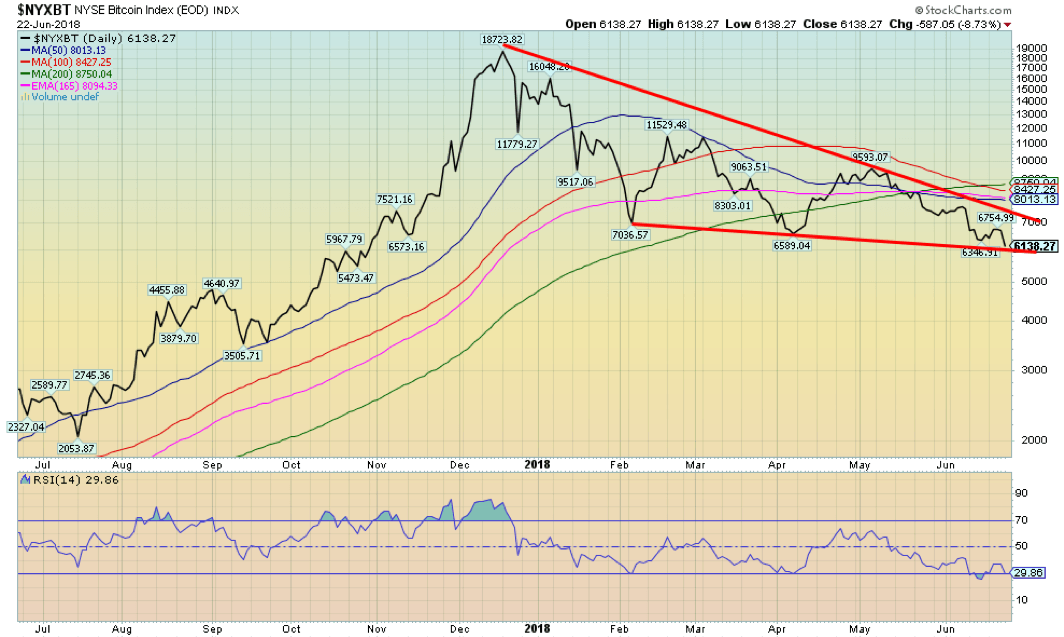
Bitcoin is appearing as a descending triangle (bearish). Potential targets could be down to $1,000 in a worst-case scenario. © David Chapman
Markets and trends
| % Gains (Losses) Trends | ||||||||
| Close Dec 31/17 | Close Jun 22/18 | Week | YTD | Daily (Short Term) | Weekly (Intermediate) | Monthly (Long Term) | ||
| Stock Market Indices | ||||||||
| S&P 500 | 2,673.63 | 2,754.88 | (0.9)% | 3.0% | up | up | up (topping) | |
| Dow Jones Industrials | 24,719.22 | 24,580.89 | (2.0)% | (0.6)% | down (weak) | up (weak) | up (topping) | |
| Dow Jones Transports | 10,612.29 | 10,773.20 | (2.7)% | 1.5% | up (weak) | up | up (topping) | |
| NASDAQ | 6,903.39 | 7,692.82 (new highs) | (0.7)% | 11.4% | up | up | up (topping) | |
| S&P/TSX Composite | 16,209.13 | 16,450.14 (new highs) | 0.8% | 1.5% | up | up | up (topping) | |
| S&P/TSX Venture (CDNX) | 850.72 | 756.24 | 0.2% | (11.1)% | down | down | up (weak) | |
| Russell 2000 | 1,535.51 | 1,685.58 (new highs) | 0.1% | 9.8% | up | up | up (topping) | |
| MSCI World Index | 2,046.47 | 1,974.29 | (0.9)% | (3.5)% | down | down | up (topping) | |
| NYSE Bitcoin Index | 14,492.18 | 6,138.27 | (6.2)% | (57.6)% | down | down | neutral | |
| Gold Mining Stock Indices | ||||||||
| Gold Bugs Index (HUI) | 192.31 | 176.93 | (0.5)% | (8.0)% | down | down | neutral | |
| TSX Gold Index (TGD) | 195.71 | 192.38 | 0.4% | (1.7)% | up | neutral | neutral | |
| Fixed Income Yields/Spreads | ||||||||
| U.S. 10-Year Treasury yield | 2.40 | 2.90 | (1.0)% | 20.8% | ||||
| Cdn. 10-Year Bond yield | 2.04 | 2.13 | (4.0)% | 4.4% | ||||
| Recession Watch Spreads | ||||||||
| U.S. 2-year 10-year Treasury spread | 0.51 | 0.34 | (10.5)% | (33.3)% | ||||
| Cdn 2-year 10-year CGB spread | 0.36 | 0.30 | 3.5% | (16.7)% | ||||
| Currencies | ||||||||
| US$ Index | 91.99 | 94.18 (new highs) | (0.6)% | 2.4% | up | up | down | |
| Canadian $ | 0.7990 | 0.7540 (new lows) | (0.8)% | (5.6)% | down | down | down (weak) | |
| Euro | 120.03 | 116.61 (new lows) | 0.4% | (2.9)% | down | down | up | |
| British Pound | 135.04 | 132.59 | (0.2)% | (1.8)% | down | down | down (weak) | |
| Japanese Yen | 88.76 | 90.93 | 0.6% | 2.4% | neutral | neutral | up (weak) | |
| Precious Metals | ||||||||
| Gold | 1,309.30 | 1,270.70 | (0.6)% | (3.0)% | down | down | up (weak) | |
| Silver | 17.15 | 16.46 | (0.1)% | (4.0)% | down | down | neutral | |
| Platinum | 938.30 | 873.30 | (1.6)% | (6.9)% | down | down | down | |
| Base Metals | ||||||||
| Palladium | 1,061.00 | 946.40 | (3.6)% | (10.8)% | down | down | up | |
| Copper | 3.30 | 3.03 | (3.5)% | (8.2)% | down | down | up | |
| Energy | ||||||||
| WTI Oil | 60.42 | 68.58 | 5.4% | 13.5% | neutral | up | up | |
| Natural Gas | 2.95 | 2.94 | (2.7)% | (0.3)% | up | up (weak) | up (weak) | |
New highs/lows refer to new 52-week highs/lows © David Chapman
© David Chapman
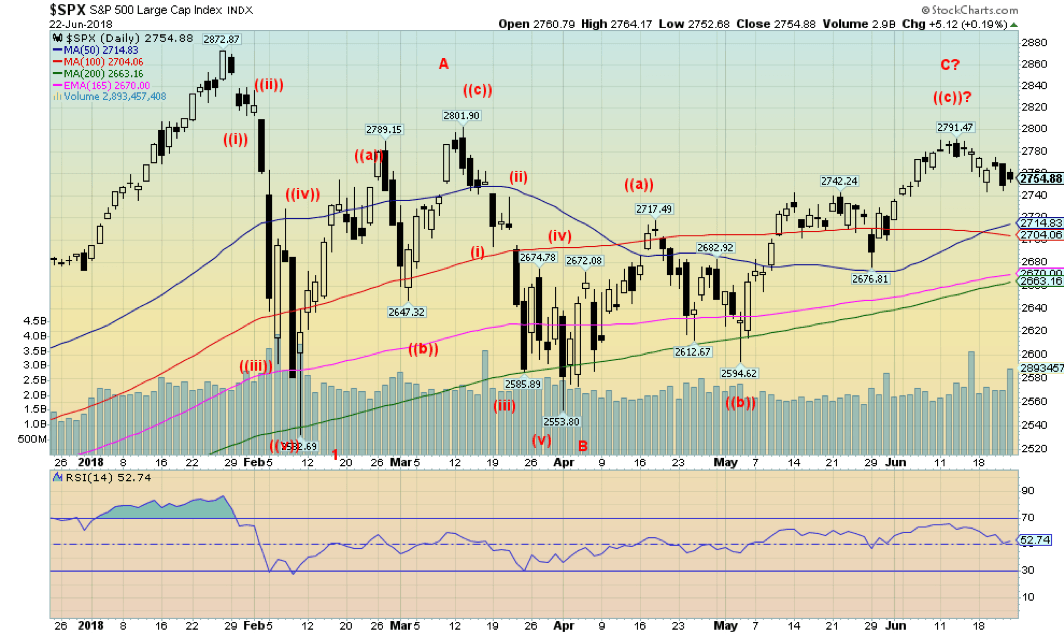
The S&P 500 struggled this past week, but the fear of trade wars took over and the S&P 500 lost 0.9 percent on the week. It was a poor week all around. Divergences continued as the NASDAQ, the Russell 2000, and the S&P 600 all made new all-time highs, but the large-cap indices of the S&P 500, the Dow Jones Industrials (DJI), and the Dow Jones Transportations (DJT) did not. The indices must confirm each other according to Dow Theory, and for the past several weeks, they have not. If this is correct, then this bodes poorly going forward. Other indices also fell this past week as the Shanghai Index (SSEC) lost 4.4 percent, the Paris CAC 40 dropped 2.1 percent, the German DAX fell 3.3 percent, and the Tokyo Nikkei Dow (TKN) fell 1.5 percent. Only the London FTSE 100 managed to eke out a gain of 0.4 percent.
As we note below, the TSX Composite rose 0.8 percent and the TSX Venture Exchange (CDNX) was up 0.2 percent. It is possible that the S&P 500 has completed an ABC correction following the first sharp decline that took place in February 2018. If that is correct, then it is possible that wave 2 or a B wave is complete and we could be starting the 3 wave or C wave down. Potential targets, once new lows are seen below 2,500, are down to 2,300. Other indices that did not make new all-time highs were the NYSE Index and the Wilshire 5000, the broadest index.
This is surprising, given the all-time highs were seen with the S&P 600 and the Russell 2000. Nonetheless, the background is turning negative with Trump threatening trade wars everywhere. Tariffs against the EU auto industry and sure to follow against the Canadian auto industry would, in turn, bring sharp retaliation. We have continually noted how auto tariffs would be quite negative for the Canadian economy and, in particular, the Ontario economy. Trump has also been going after China with tariffs which in turn is forcing China to place tariffs on U.S. goods. Nobody wins in trade wars. Falling stock markets would be the culmination of rising fears for the global economy.
© David Chapman
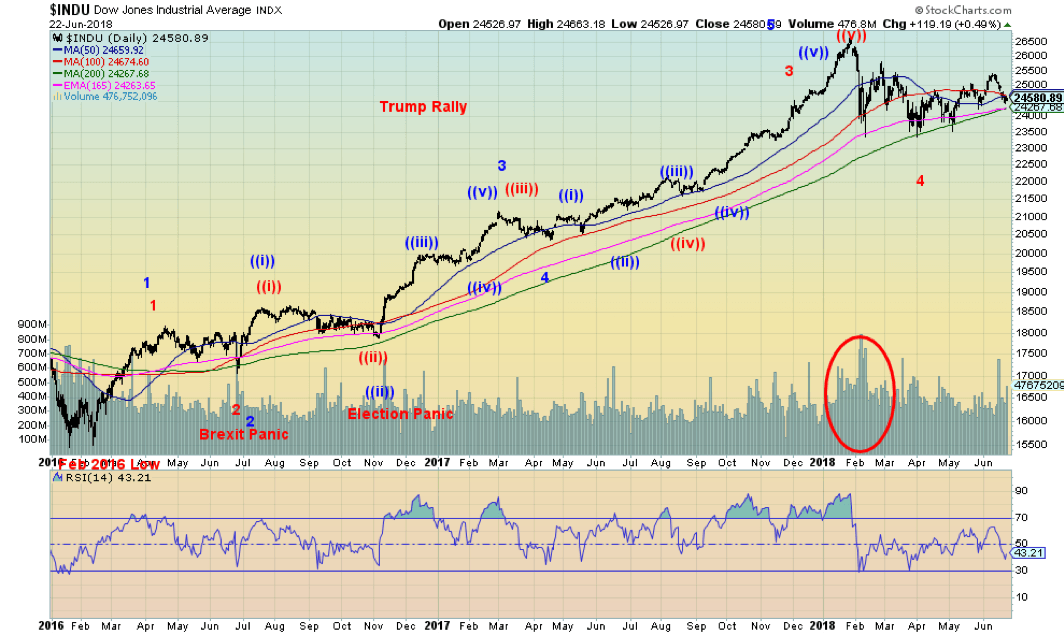
Our long-term picture of the Dow Jones Industrials (DJI) remains somewhat ambiguous. We put two Elliott wave counts on it. The one in blue is consistent with Elliott Wave International while the other, we offer as an alternative. Helping the Elliott Wave count is the high volume on that February decline with the first fears of trade wars. Now that trade wars are threatening to escalate, the stock markets globally could be poised for a fall of some proportion. That would eliminate the potential for the alternative count and a run to new highs for the DJI.
That the DJI has not made new highs while other indices have is a divergence we can’t ignore. The DJI lost 2 percent this past week thanks to dropping GE from the index and substituting with Walgreens (WBA). GE had been a part of the DJI since 1896, although it has had periods when it was out and then back in. The 200-day MA has acted as great support for the DJI so far, so a break of 24,200 could prove to be fateful. Under 24,000 could lead to a decline to 22,400 as a potential minimum target. Only new highs above 25,400 might change this potential scenario.
© David Chapman
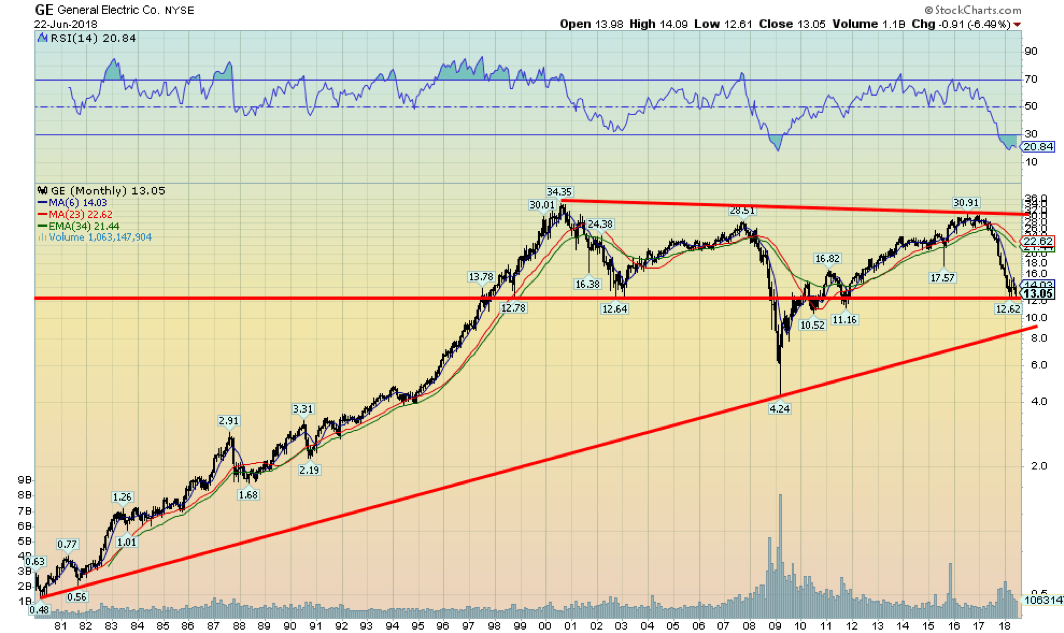
Here is a longer-term chart of General Electric (GE). GE appears poised to break down under the 2002 low. A breakdown under $9 would be fatal and could send GE down to the 2009 low of $4.24. The company is overburdened with debt and is in the process of shedding businesses in order to survive. Quite the comedown for one of the longest-serving companies in the DJI. At one time, GE was almost synonymous with America itself. Who didn’t have a GE product in their kitchen? And what money manager didn’t have GE in their portfolio? How the mighty have fallen.
© David Chapman
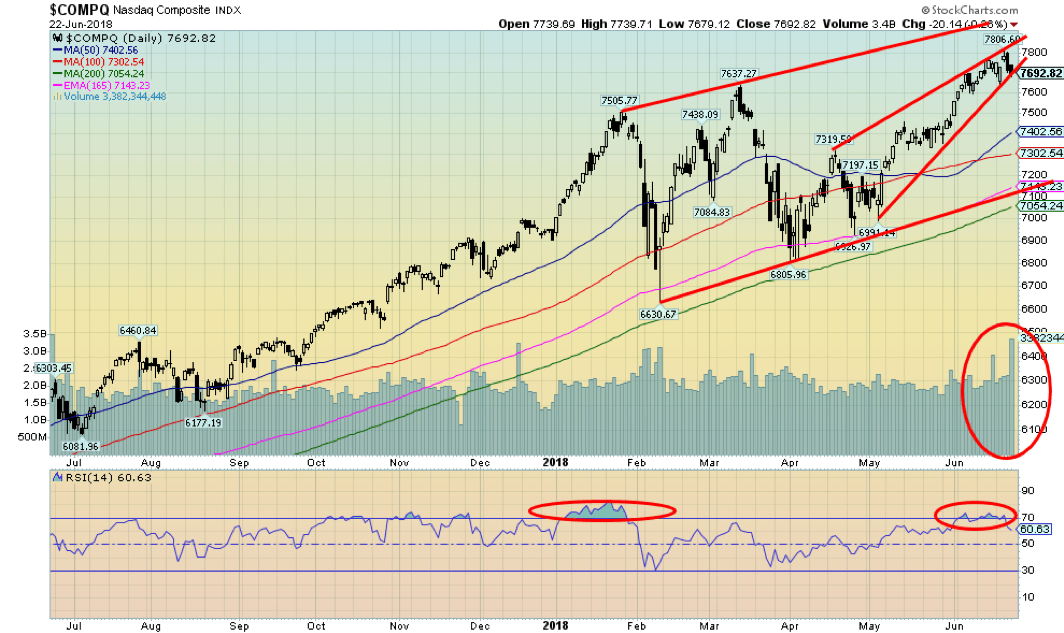
The NASDAQ continued its relatively lonely climb to new all-time highs again this past week. But after hitting a new high at 7,806, the NASDAQ reversed and closed lower on the week by 0.7 percent. As well, we appear to have hit what would signal to us that a decline is underway: the top of that ascending wedge (bearish) and a drop through 7,635 the June 19 low. The wedge triangle suggests a decline back toward 7,100 would be in the works. Note as well how the volume seemed to pick up with Friday’s decline. The FAANGs led the way up and they’ll lead the way down.
© David Chapman
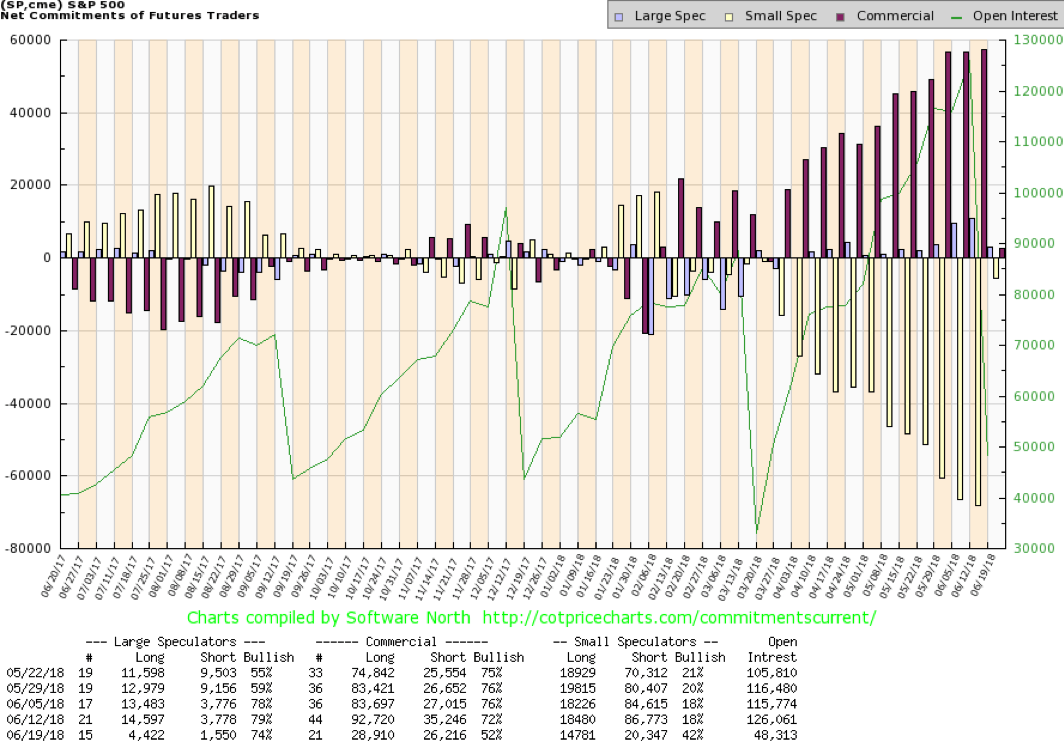
It is noteworthy that the commercial COT for the S&P 500 has taken quite a drop. This past week, it fell from 72 percent to 52 percent. Granted, options expiration took place last week, but nonetheless, the drop is noticeable. Long open interest collapsed by almost 64,000 contracts even as short open interest dropped by about 9,000 contracts. The large speculators’ COT (hedge funds, managed futures, etc.) also fell from 79 percent to 74 percent. Open interest took a big hit. Given the stock market was rising as the commercial COT stayed high, maybe we should pay heed to this drop that might be telling us that a decline of some proportion is about to hit.
© David Chapman
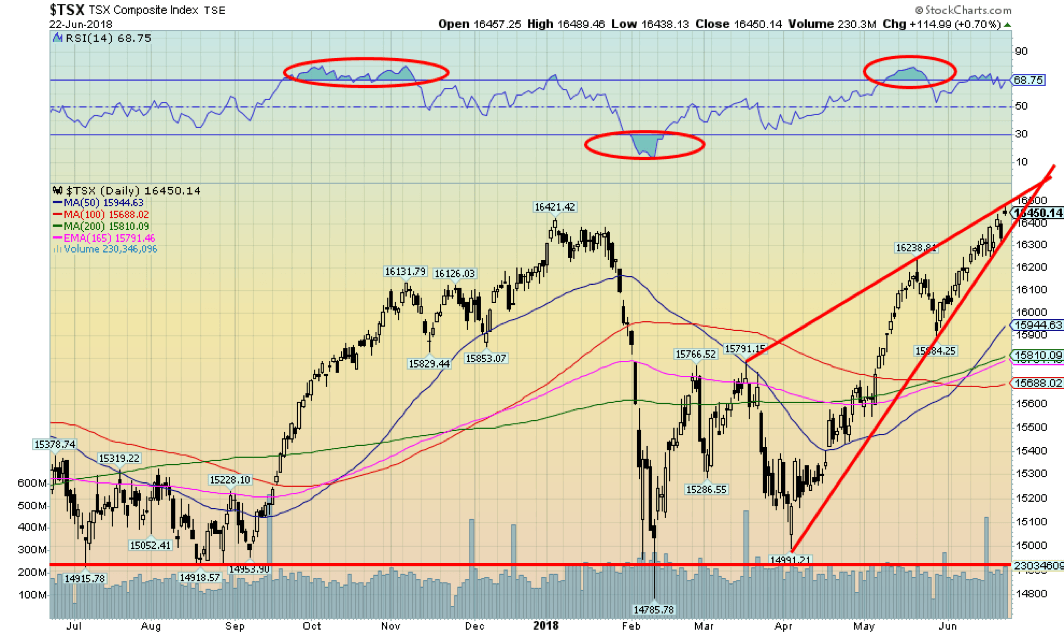
The TSX Composite made a new all-time high this past week at 16,489. Energy stocks helped lead the way. But that potential ascending wedge appears to be completed and, if correct, a decline could come this week which could be just as swift as the rise. Descending wedges tend to go back to where they started, and in this case that could take the TSX back to 14,990. The TSX is looking somewhat exhausted, so buyer beware. If those threatened trade tariffs on autos materialize, then look out below.
Given Trump’s erraticism, tariffs against autos would not be surprising. And that, in turn, could lead to the collapse of NAFTA. The Canadian economy would suffer accordingly. There is evidence the Canadian economy is already slowing. Ontario, one of Canada’s prime economic engines, would suffer the most if auto tariffs were applied by the U.S.
© David Chapman
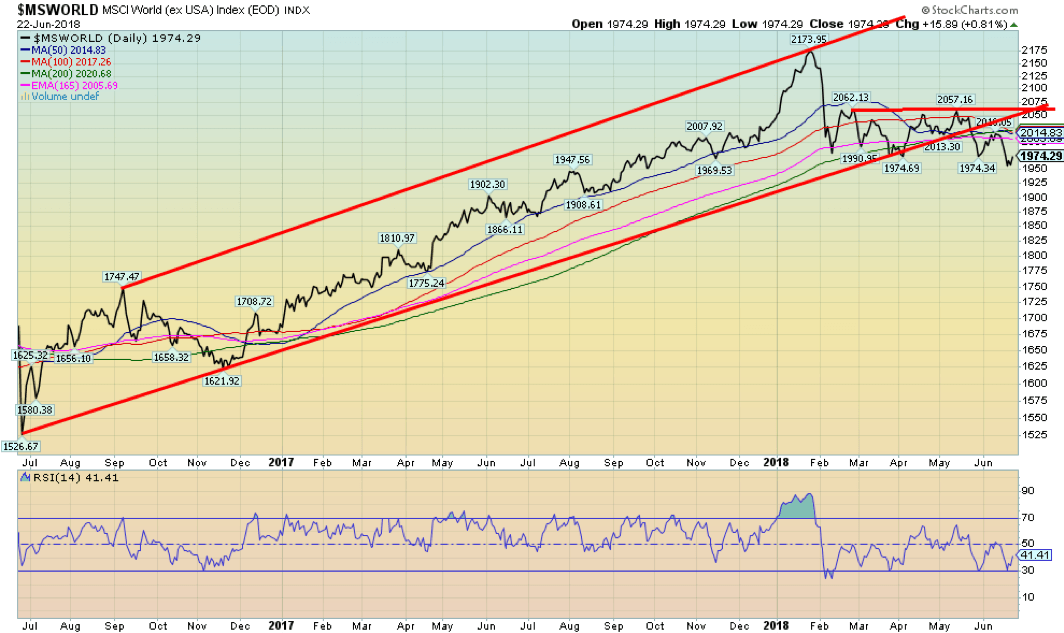
Is the global MSCI World Index leading the way? Unlike many other indices, the MSCI Index has fallen below its key daily MAs of 50, 100, and 200. This is a potential sign of weakness on a global scale, although the MSCI remains dominated by U.S. stocks. The MSCI has also broken down from the long-term trendline that had been in place, thus confirming the weakness. This is why we are wondering if the MSCI is the canary in the coal-mine for the rest of the indices. Time will tell.
© David Chapman
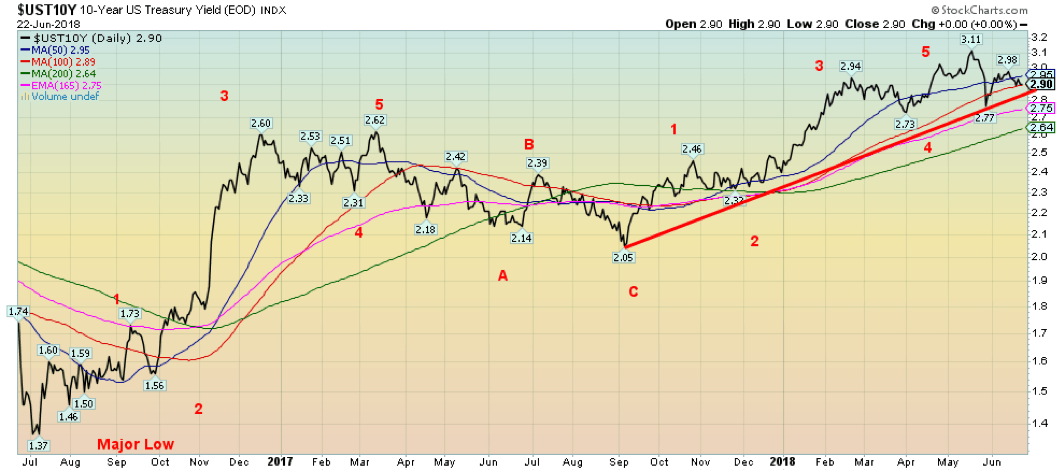
The 10-year U.S. Treasury note fell to 2.90 percent this past week from 2.93 percent the previous week. That the 10-year appears to be turning down now and not challenging the earlier high at 3.11 percent bodes positive for bond bulls. Bonds would be turning lower in yield (rising in price as prices move inversely to yields) because of safety concerns or because the bond market is smelling potential recession trouble down the road. The bond market often moves in advance of what is to happen next. Our long-held target for the 10-year was 3.20 percent, so reaching 3.11 percent is at least close. It is still possible this is merely a correction to the most recent rise. The decline to 2.77 percent a few weeks ago was triggered by bank failure fears in Italy and the EU.
Those fears are still lingering as rumors of Italian bank failures and trouble at Deutsche Bank persist. The problems at Deutsche Bank are well known and while they are experiencing considerable anguish, we don’t believe a collapse is going to happen. A collapse of Deutsche Bank would make the Lehman Brothers collapse of 2008 look like a Sunday school picnic.
As well, the Fed is committed to hiking interest rates further in 2018 against the backdrop of a stronger U.S. economy, and the ECB is holding off on interest rate hikes with the EU economy weakening: all this is helping to widen spreads between the two. Trouble in the EU would be reflected positively in the U.S. with a flight to safety. German Bunds have also benefited from this flight to safety. The 10-year German Bund yield has fallen to 0.34 percent from 0.49 percent in June. There is considerable nervousness about the state of Italian banks and even of Deutsche Bank.
Recession watch spread
© David Chapman
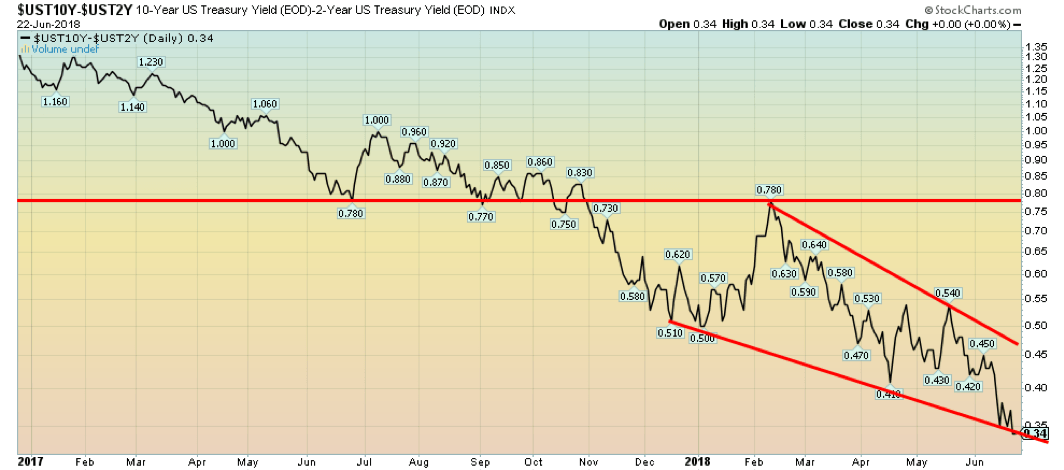
The recession watch 2–10 spread narrowed further this past week, falling to 0.34 percent from 0.38 percent the previous week. The spread could be at support here so a rebound this coming week would not be a surprise. If, however, the spread was to fall more this coming week, it would bust through what appeared to be a forming falling or descending wedge triangle. We have noted before that the spread could fall rapidly at this stage. Still, at 0.34 percent it is not negative. Recessions don’t usually follow until the spread turns negative and stays that way for at least a few months. Since the February high, the 2-10 spread has fallen 50 percent as the decline picks up speed. Nonetheless, we are predicting it could go negative sometime into 2019 and a recession could be underway before the end of the year if history holds.
© David Chapman
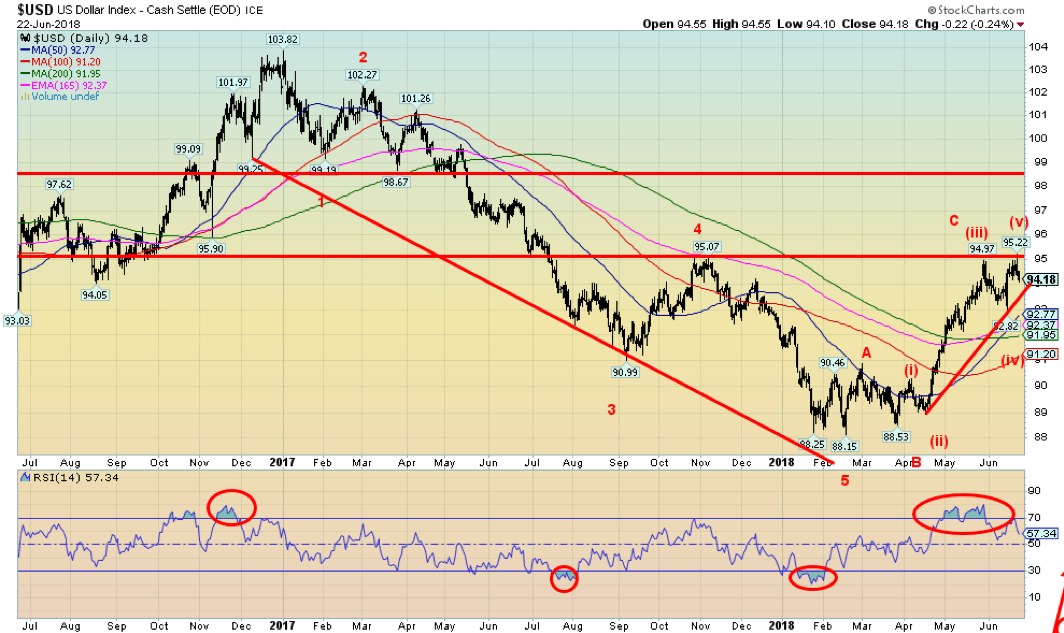
Has the US$ Index topped? We did achieve our long-held targets of just over 95 with a high of 95.22. It was right in our zone of 95-95.25. The US$ Index then reversed and managed to close lower on the week, back below 95. The US$ Index lost 0.3 percent on the week after making new 52-week highs. On the other side, the Euro gained 0.4 percent on the week after making new 52-week lows. Trade wars make people nervous. The Cdn$ lost 0.8 percent on the week and it too made new 52-week lows at 74.80.
Nervousness over trade wars with the U.S. did Canada no favors. The US$ Index’s retreat from new 52-week highs and closing lower is a negative going forward. Ditto for the Euro, only it made new lows and then reversed, closing higher. The Cdn$ had a positive day on Friday but failed to completely reverse the week. There is considerable support for the US$ Index down to 92.75 and further support down to 91.20. But below 91.20 a major breakdown would most likely get underway. Resistance is now seen up to 95/95.25. At the highs, sentiment had reached 90 percent, a level often associated with significant tops. If the US$ Index were to regain 95.25 and especially above 95.50, then odds favor a further rally to possibly 98/98.50. Until we firmly break back under 93.50, the US$ Index could recover, but we doubt it.
© David Chapman
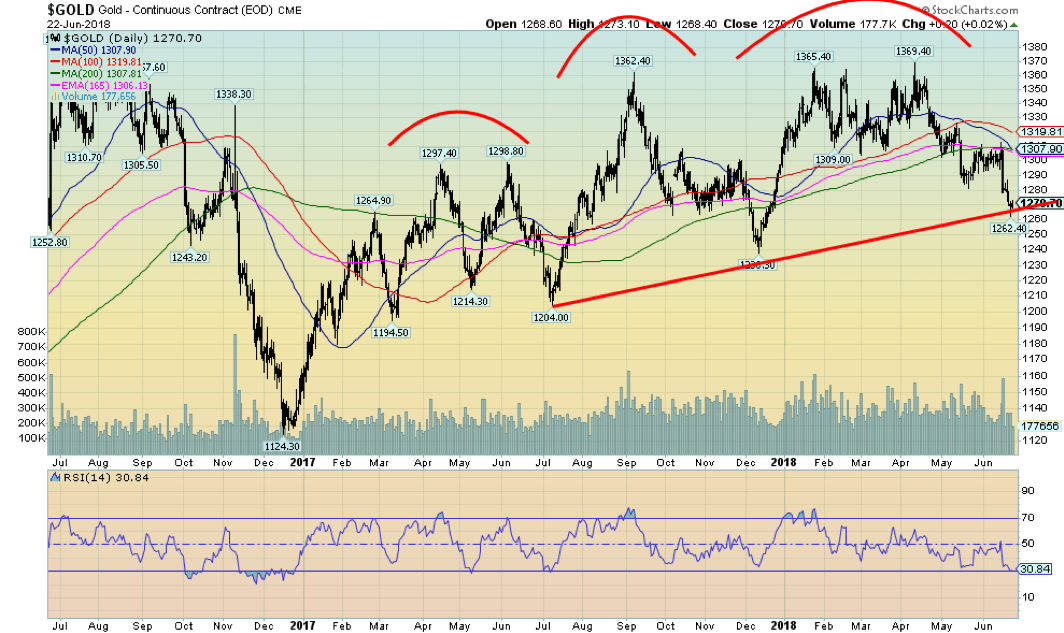
After falling to new lows this past week down to $1,262, gold rebounded by the week’s end, closing on a somewhat positive note. A turnaround in the US$ helped as gold tends to rise as the US$ falls. While this is encouraging, we should remember we were down on the week with gold, losing 0.6 percent. Silver was relatively flat, down 0.1 percent while palladium fell 3.6 percent and platinum (more an industrial metal rather than a precious metal) was off 1.6 percent. Copper exhibited weakness, falling 3.5 percent.
Could that point to economic problems down the road? Gold sentiment fell to 9 percent this past week. So, follow through to the upside this coming week would be important in view of Friday’s positive close. Until we take out $1,285 and the strong resistance for gold on the dailies up to $1,310 and $1,320, there remains the risk of new lows. Gold remains at risk to fall to major support at $1,240 until $1,285 is taken out. The RSI is down to 30 but really didn’t fall under it for any period of time. Seasonals are also poised to turn up, but the real positive seasonals don’t kick in until mid-July, so there remains downside risk. Longer term we remain positive and, as we note below with our longer-term view of gold, we remain quite positive that a major move could soon get underway.
© David Chapman
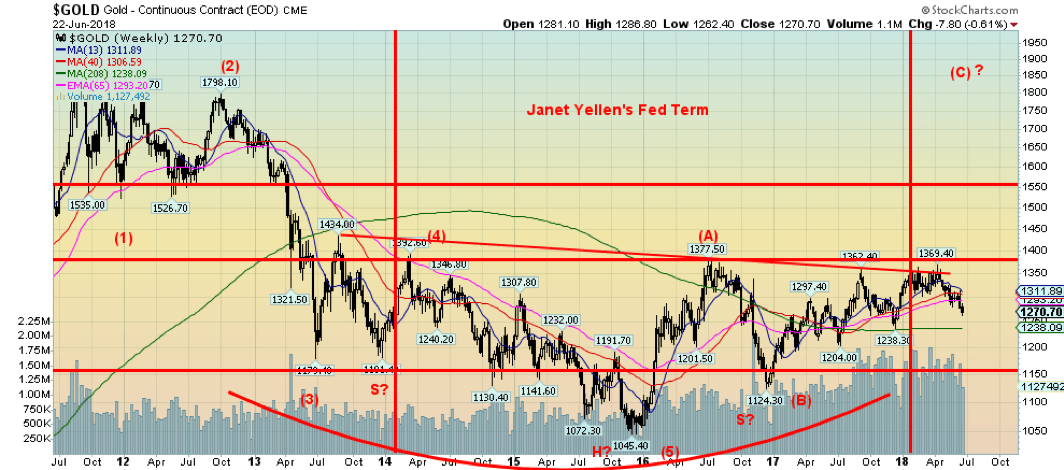
Our long-term view on gold hasn’t changed. After topping in September 2011, gold fell in what appears as a possible five wave decline, although some argue it was more like an ABC decline. Irrespective of this, the rally that got underway with the major low at $1,045 in December 2015 appears to be unfolding like a corrective wave to the long down wave 2011–2015. It is possible that the A wave and the B wave are complete and we continue to work on the C wave. It has been a complex one and it makes it difficult to read. But sentiment fell this past week to roughly 9 percent and low sentiment is often associated with bottoms.
Longer-term support for gold is visible at the 4-year MA currently at $1,238. That is a reason we highlight a test of $1,240 as a possibility. Weekly MAs show resistance up to $1300/$1,310, but above $1,310 the market looks better. Major resistance would remain at $1,370. Gold could also be forming a multi-year head and shoulders bottom with a neckline at $1,370. A firm breakout above that level could in theory project to $1,760. That would warm the gold-bugs. A C wave could, in theory, take us back to the all-time high near $1,920. And it could make new highs. That’s not unusual—witness the stock markets making a new high in 2007 above the 2000 top. What followed, however, was a devastating 55% drop. But first the rally, then the collapse.
© David Chapman
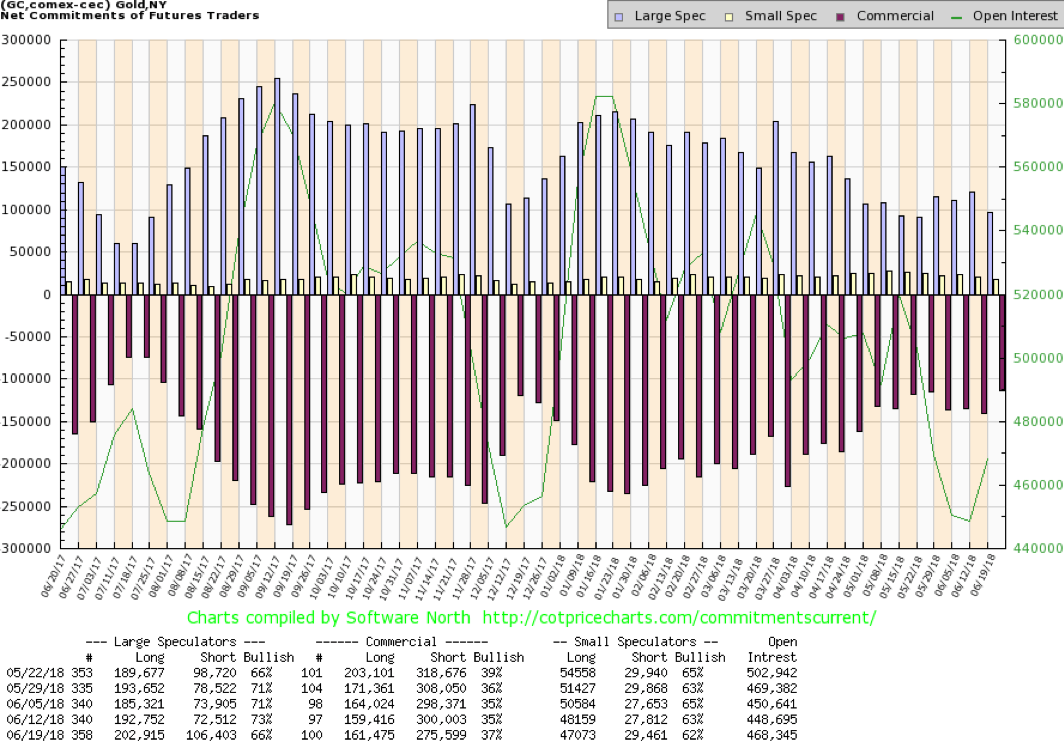
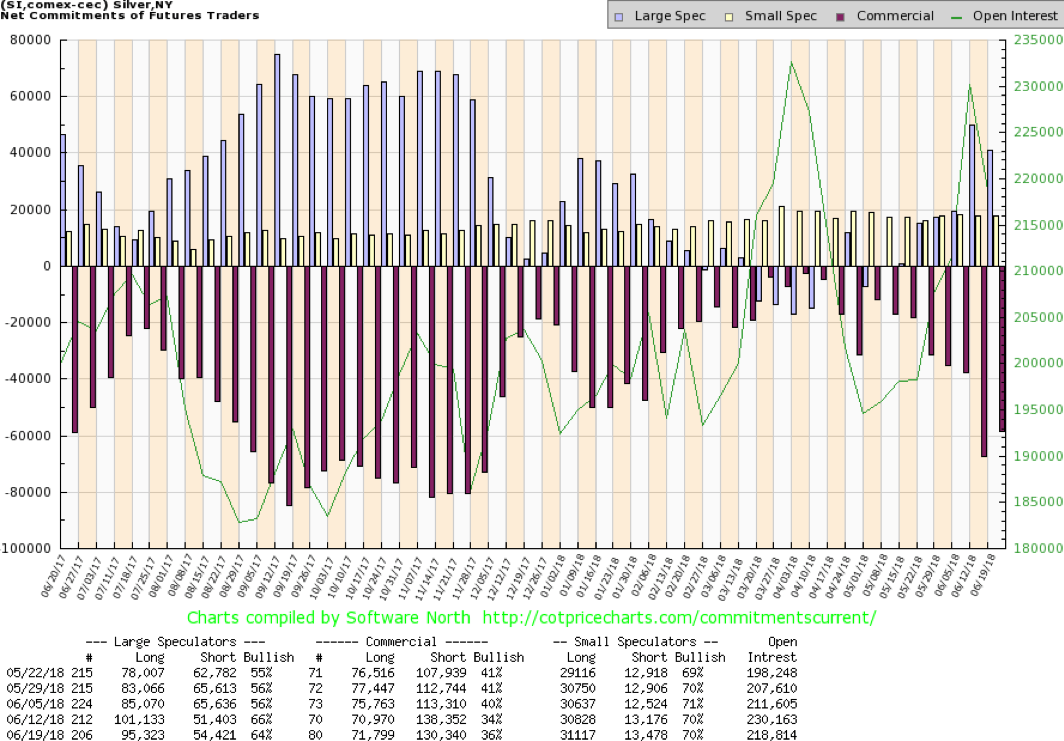
The gold commercial COT improved this past week to 37 percent from 35 percent. This was in line with our expectations, given the sharp sell-off the previous week. Long open interest rose roughly 2,000 contracts while short open interest fell almost 25,000 contracts. This tells us the improvement in the commercial COT was largely because of short covering. Given the sharp drop, some short covering would have been expected.
The large speculators’ COT (hedge funds, managed futures, etc.) fell to 66 percent from 73 percent a sharp drop. They clearly panicked a bit following the sharp drop last week. Short open interest leaped roughly 34,000 contracts while long open interest also rose but by only a little over 10,000 contracts. Combine this with gold’s weak sentiment and we believe we have the makings of a rebound in gold.

© David Chapman
Divergences between gold and silver continue as silver did not make new lows below its April low of $16.07 but gold did make new lows under its May low. Combine this divergence with weak sentiment towards both gold and silver and odds favor a rally. Moving into a period of positive seasonals helps as well. Still, silver has considerable work to do as there is resistance up to $16.75 and further resistance at $17 and final important resistance at $17.75.
Silver should work its way through these resistance zones with the caveat that, as long as there are no new lows below $16.07, the market appears to be good and silver should outperform gold going forward. Silver did try to drop below its uptrend line this past week but failed to break down. We view this as a positive going forward. Silver continues to form what might be a huge head and shoulders bottom over several months. The neckline is at $17.75 and a solid break above that level suggests a move to at least $22.40. Above $22.40 further gains are probable. Again, the caveat is that silver holds the recent lows at $16.07; otherwise, that could change the scenario.
© David Chapman
The silver commercial COT improved this past week to 36 percent from 34 percent. This was in line with our expectations and with the improvement in the gold commercial COT. Long open interest rose roughly 1,000 contracts while short open interest fell about 8,000 contracts. This suggests the improvement was largely short covering rather than any new buying. Not surprisingly, the large speculators became more bearish and their COT slipped to 64 percent from 66 percent as they mostly covered longs. We are encouraged by the silver commercial COT. It never really turned negative, but the drop last week was of concern. It would be good to see further improvement this coming week.
© David Chapman
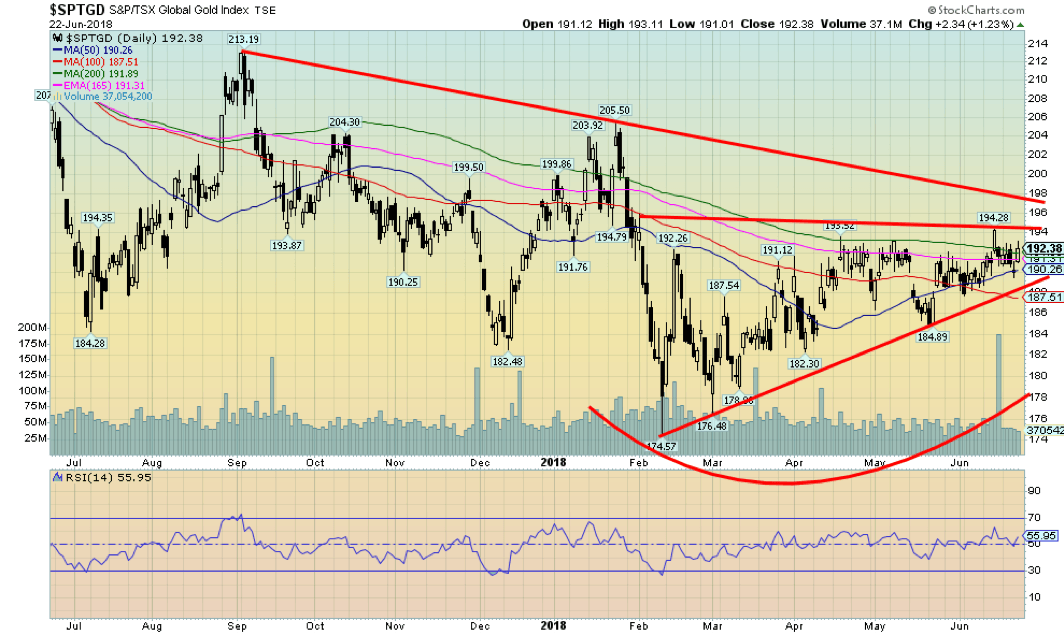
Gold stocks, as represented here by the TSX Gold Index (TGD), rose this week with a gain of 0.4 percent. This was against the background of weaker gold prices while silver was relatively flat. The Gold Bugs Index (HUI) on the other hand lost 0.5 percent. The components in the two are different; the HUI contains South Africa and metals producers that are not a part of the TGD. At one point this week the TGD leaped over our 193 resistance point but then immediately pulled back, causing the TGD to regroup before recovering. It would have helped if the TGD closed over 193 but it didn’t, so it continues to make 193/194 a resistance zone to be overhauled.
Above, as well, is further resistance at 198 so we need to break over that point. We appear to have support down to 190 and further support down to 187/188. Only below 187 does this rebound become suspect. A break above and then taking out the old high near 205 could suggest a move to 230/24
© David Chapman
Confusion reigns over oil prices as an OPEC meeting on Friday effectively ended with Iran leaving the meeting and OPEC adopting a smaller than expected production increase. That caused confusion, so oil prices jumped. With sanctions bearing down on Iran and Venezuela, two major oil producers, that is going to cut into supply. The two in the best position to increase production, Saudi Arabia, and Russia, both for their own reasons want to keep prices high or even higher.
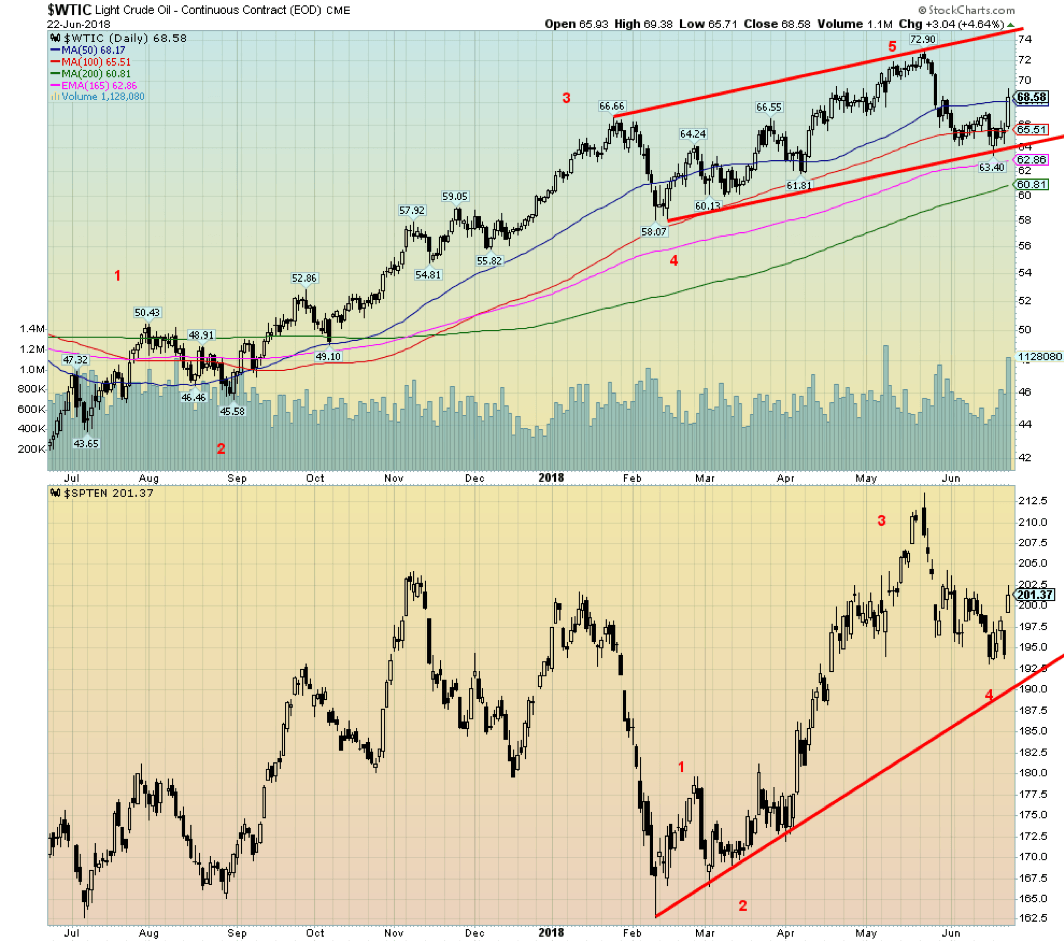
Naturally, that doesn’t sit right with President Trump who was tweeting about high oil prices. WTI oil leaped over $3 on Friday and managed to close back over the 50-day MA. A weaker US$ also helped oil prices on Friday. Add in continued geopolitical tensions between the U.S. and just about anybody, and conditions were ripe for a rebound after WTI oil falling for the past few weeks. That helped the energy stocks as the TSX Energy Index (TEN) jumped 3.6 percent on Friday and was up 3.8 percent on the week, and, in turn, the TSX Composite leaped to new all-time highs. Still, we would have to regain $71 to suggest that new highs were ahead for WTI oil.
Certainly, oil prices between $70 to $80 would be acceptable to OPEC members but probably not too acceptable to Trump. Interesting, as WTI oil found support at the 165-day EMA and above the 200-day MA currently at $60.81. There now appears to be solid support for WTI oil down to at least $60. There would be resistance at $70 and again at $71.
Chart of the week
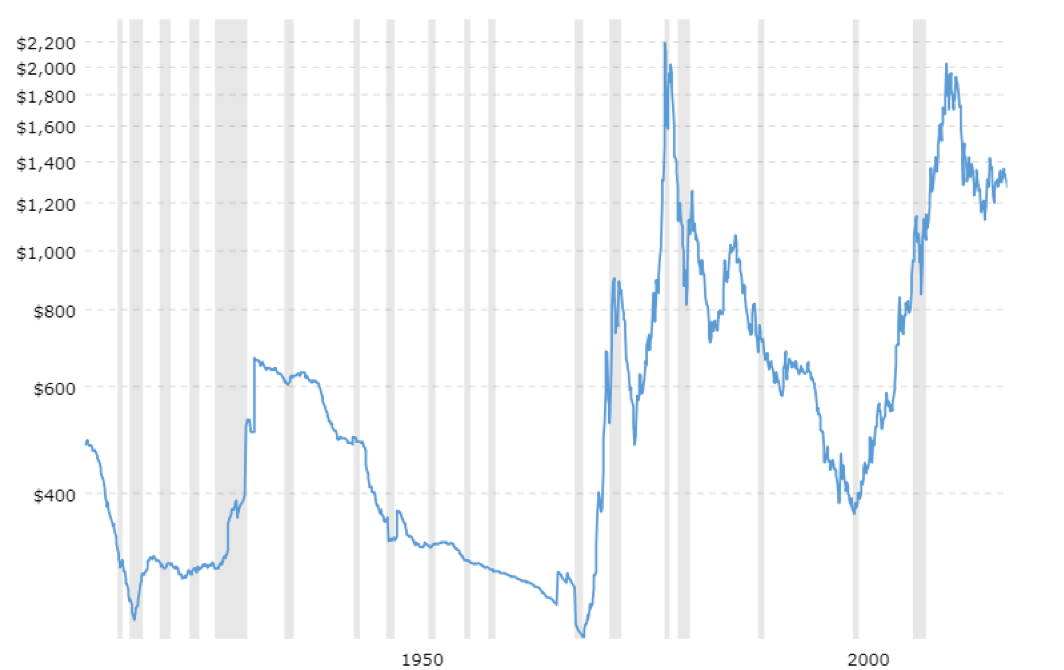
Here is a 100-year chart of gold prices adjusted for inflation. That first peak at $662 occurred in May 1934 when the U.S. revalued gold upward to $35 from $20.60. The low actually came in November 1970 before Richard Nixon took the world off the gold standard in August 1971. With the end of Bretton Woods, the world order that came out of the ashes of WW2 began to unravel, a process that continues today. Fiat currencies have dominated, debt has exploded, and the world has become more and more unstable.
Gold exploded and in January 1980, it hit its peak, just shy of $2,200 (inflation-adjusted – $850 nominal). The long decline that got underway afterward eventually took gold to a low in February 2001. The subsequent bull market took gold back to over $1,900 in 2011 as it fell just short of the 1980 inflation-adjusted peak. Following another decline, gold has been slowly trying to recover. The decline from 2011 to 2016 looks eerily like the decline that took place from 1974–1976 before a big move up once again. Could similar action take place?
Given the increasingly unstable world and threats of trade wars against the backdrop of a mountain of debt and global geopolitical instability, it would not, in our opinion, be surprising. Curiously, on an inflation-adjusted basis, gold was actually worth upwards of $2,400 way back in the 13th and 14th century. That level has proven to be elusive ever since. Gold, unlike fiat currencies and cryptos, has been around as a form of money since the 6th century BCE. Yes, it has had its ups and downs, but it has proven to be most durable and it is tangible and it is nobody else’s liability.
—
DISCLAIMER: David Chapman is not a registered advisory service and is not an exempt market dealer (EMD). We do not and cannot give individualized market advice. The information in this article is intended only for informational and educational purposes. It should not be considered a solicitation of an offer or sale of any security. The reader assumes all risk when trading in securities and David Chapman advises consulting a licensed professional financial advisor before proceeding with any trade or idea presented in this article. We share our ideas and opinions for informational and educational purposes only and expect the reader to perform due diligence before considering a position in any security. That includes consulting with your own licensed professional financial advisor.


SpaceX IPO Sparks Déjà Vu as Market Risks Loom and Gold Bulls Stay Hopeful
The author compares the 2000 AOL Time Warner merger to SpaceX’s planned IPO, warning it may signal a market top....


The TopRanked.io Guide to 2026’s Biggest and Best Affiliate Opportunities
Want to earn affiliate commissions on literal billions of dollars worth of revenue? Then this week, we've got something special...


Eni Advances Energy Transition with Major Investment and Emissions Cuts
Eni showcased its “Just Transition” report in Rome, highlighting stakeholder collaboration and progress toward decarbonization goals. The company invested over...


The German Fintech Market Shows Resilience and Strong Investment Growth in 2026
Germany’s fintech sector remained resilient in 2026 despite economic crisis and rising insolvencies. Investments reached €14.2 billion, showing strong investor...


Cannabis Legalization in Germany: A Mixed Interim Assessment
Germany’s cannabis legalization has reduced criminal cases and eased pressure on the justice system, while the black market is slowly...
 |
|
 |  |
 |
|
-
 Crypto1 week ago
Crypto Market Slumps as Bitcoin and Ethereum Fall, Sentiment Turns to Fear
-
 Markets2 weeks ago
Markets Surge Amid Rising Risks and Economic Strain
-

 Crypto6 days ago
Bitcoin and Ethereum Stabilize as Markets Watch ETF Flows and Institutional Moves
-

 Biotech2 weeks ago
Molecular Health Insolvency Leads to Restructuring Under New Company Name Lucera GmbH
You must be logged in to post a comment Login