Featured
Gold plunges while stock markets continue to go higher
Numbers to watch this coming week are the employment reports due out on Friday in both the U.S. and Canada.

Weren’t the markets riveting last week? Well, the markets not so much—as the focus was on testimonies, charges and more. Gold was spooked to the downside but it was Fed Chair Jerome Powell playing the Grinch. Nonetheless, gold conformed to our thoughts last week that we had reached a temporary top. As to the stock markets, the jury is out. The stock markets are at a crucial point. A burst above could trigger a buying panic. But even a pullback consolidation won’t eliminate thoughts of a major breakout above and a run to a new all-time high. No matter how one looks at this market is a dangerous one and one could be long but with caution.
The markets appeared focused on the potential for a U.S./China trade deal, a U.S. economy still humming along even if there are some weaknesses appearing, and following Fed Chairman’s Jerome Powell’s musings there is now talk of a Powell put. We all remember the Greenspan put, the Bernanke put and the Yellen put. In other words, hints that the Fed will not let the market collapse despite storm clouds gathering. Our recession watch spread, however, is going in the opposite direction signaling no recession soon. We found an interesting chart about stock buybacks and have presented it this week as our Chart of the Week.
The Cohen testimony
“I was a fool. But he was a cheat.” So exclaimed President Trump’s former lawyer and “fixer” Mickey Cohen in a dramatic public testimony into Trump’s personal and business affairs. In Canada, the words were different, but the effect was the same. The testimonies of Mickey Cohen and Judy Wilson-Raybould were riveting and dramatic, threatening a president and a prime minister. Then there was another summit between Trump and Korean leader Kim Jong-Un that ended abruptly. The love affair is over? India and Pakistan are threatening each other. Are they on the brink of nuclear war?
And, just when we thought things couldn’t get more interesting, Prime Minister Netanyahu of Israel was charged with bribery, fraud, and breach of trust. Oh, the drama. And, lest we forget, Fed Chairman Jerome Powell spoke and negotiations continued with the Chinese over trade. All in all, a dramatic and unforgettable week. Who cares about markets when the best shows are the ones being played out on C-Span.
But, alas, our focus is the markets and unless the drama in Congress, Ottawa, and Hanoi, on the Pakistani/India border, and in Tel-Aviv are impacting markets, then they are just a lot of sideline noise. The clash between Pakistan and India was cited as a reason the markets wobbled earlier in the week. And, don’t forget the drama going on in Venezuela. But it too has had little impact on markets. It may all be noise, but one can’t ignore it as many suggest because that noise can suddenly, with little warning, impact markets.
Trade negotiations with China can have an impact on markets. If they succeed, the markets will rally. But if they fail, the markets will fall. Trump had previously announced a March 1 deadline. But the reality is, working on a deal with China is complicated. Oh, a deal is being prepared, but if the U.S. pushes China too hard China will walk away. That is just what North Korean leader Kim Jong-Un did, although it was made out it was Trump that walked away. The two failed to agree on the lifting of sanctions so it was pointless to continue. North Korea wants an easing of sanctions as an incentive to denuclearize. The markets wobbled on the failure of the summit.
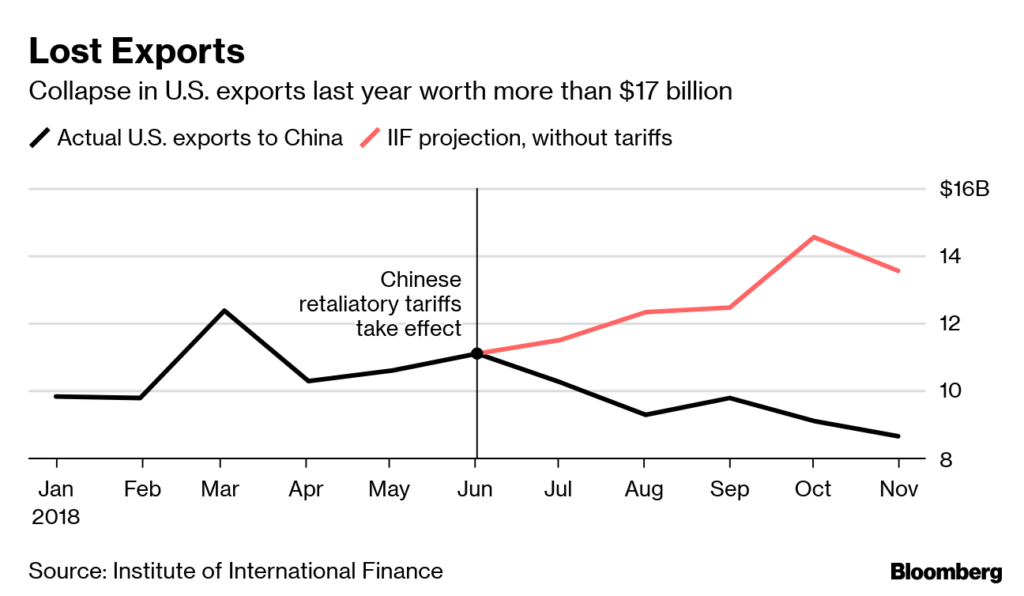
China/U.S. trade negotiations are far more important than the North Korea/U.S. dickering over sanctions and nuclear weapons. Everybody wants a resolution. The question is, is one forthcoming? Not immediately. The U.S. won a little battle at the WTO over China providing farm subsidies, but China’s retaliation for Trump’s tariffs is hitting U.S. exporters. It is estimated by some that U.S. exporters could lose upwards of $40 billion a year because of Chinese tariffs. Tariffs work both ways. Nobody wins.
U.S. Q4 GDP came in at +2.6%. That, in many respects, was higher than expected. It was thought that poor retail sales in December would drag the number down. For the year, the U.S. came in as a gain of 3.1%. That is the highest since a 3.5% gain in 2005. It will be crowed by Trump. It is higher than the euro area (+1.9%), Japan (+1.0%), U.K. (+1.3%), and Canada (+2.1%). German GDP is estimated to be +1.5% for 2018 and France is anticipated to also gain 1.5%. The U.S. GDP is exceeded only by China (+6.4%), but China is following a downward trajectory. We can’t help but note that China’s factory PMI for February came in at 49.2. It was the third consecutive month under 50. Readings under 50 are indicative of a possible recession.
But the GDP gain is coming at a cost of sharply increased debt. Consider that since Trump took office GDP has grown by roughly $3.1 trillion. But U.S. national debt is up $2.1 trillion. When Trump took office, the U.S. national debt stood at $19.9 trillion. Now it is almost $22.1 trillion. When one considers all debt securities in the U.S. that includes government, corporations, and the consumer, debt has grown by $6.2 trillion since Trump took office. We have consistently said that one cannot grow GDP by debt alone. At some point, debt hits its limits. Make America Great Again? How about Make America debt bigger again!
Take student loans in the U.S. as an example. Since 2010, student loans have more than doubled to almost $1.6 trillion. Apparently, that is divided up between roughly 44 million students or nearly $36 thousand per student. It is estimated that some 11.4% of the debt is delinquent. Automobile loans are lower with a total of around $1.2 trillion. The delinquency rate is around 4%, but a large proportion of that is in what one refers to as subprime auto loans. With subprime auto loans, the delinquency rate is around 16%. Subprime auto loans make up roughly 25% of all auto loans.
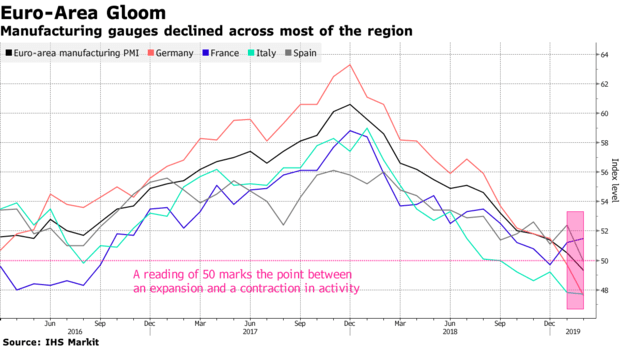
With China faltering, it is also no surprise that the eurozone is faltering as well. The U.K. appears headed for a train wreck because of a no-deal Brexit. There is a lot of maneuvering, but the reality is they are unable to secure a deal that will satisfy everybody. In the eurozone, factory orders are faltering because of the tariff stand-off with China and the U.S. and because of Brexit. The chart below shows the decline in eurozone PMI. A note that this can reverberate back on the U.S. and, by extension, Canada as well.
All of this brings us around to Fed Chair Jerome Powell and what the Fed is doing. Remember the Greenspan put, the Bernanke put, and the Yellen put? Well, now we may have the Powell put. Powell spoke in the Capital this week and he continued to preach patience. Markets had faltered on the Fed trying to reduce their balance sheet. Now Powell is preaching that the Fed will end its balance sheet reduction this year. That’s good news for the markets and that may yet help push the markets to new highs. Now, the hints are not quite the same on rate hikes, but it is becoming widely accepted that the Fed will not hike at its March 19–20 FOMC. But they could still hike later. The Fed is becoming concerned about slowing in China and the eurozone.
The Fed is becoming concerned about the global economy. Storm clouds are gathering, but the stock markets keep going higher. Fear of missing out? We are approaching a crossroads. And in the background a lot of drama.
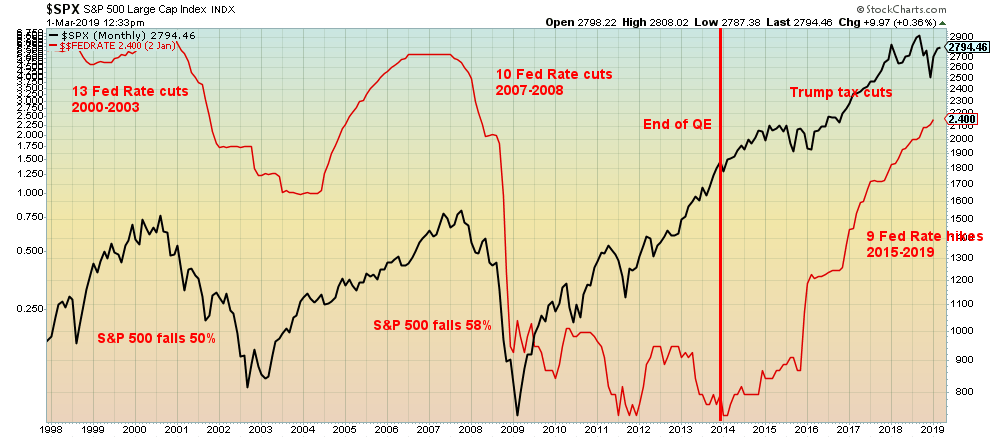
Don’t get too excited about the Fed cutting interest rates as some have mused. If cutting interest rates were a panacea, then you would think that the stock market would steady and rise. But no; as this chart shows, the Fed cut rates 13 times in 2000–2003 and yet the stock market still fell 50%. In 2007–2008, the Fed cut rates to effectively zero, but that didn’t stop the S&P 500 from falling 58%.
Only with huge injections of liquidity (quantitative easing QE) did the stock market react to the upside. As we have noted, it was also fueled by a huge debt binge. The Fed has hiked rates 9 times from 2015 to date but the market kept rising, thanks to a huge Trump tax cut. However, the effects of that should be falling off. A reminder that the Fed also cut rates several times in 1929 but it didn’t stop the market from falling 89% in 1929–1932.
The stock market is rebounding because of expectations of a positive outcome on the China-U.S. trade front and the Fed moving from a hawkish to a dovish tone. The economy reporting good numbers, as was seen in the recent GDP numbers, is also fueling the stock market. There is also a considerable amount of cash on the sidelines, thanks to the recent downside gyrations. Fear of missing out on a rally can be a big motivator in moving that cash into the stock markets. And a realization that there might now be a Powell put.
Markets and trends
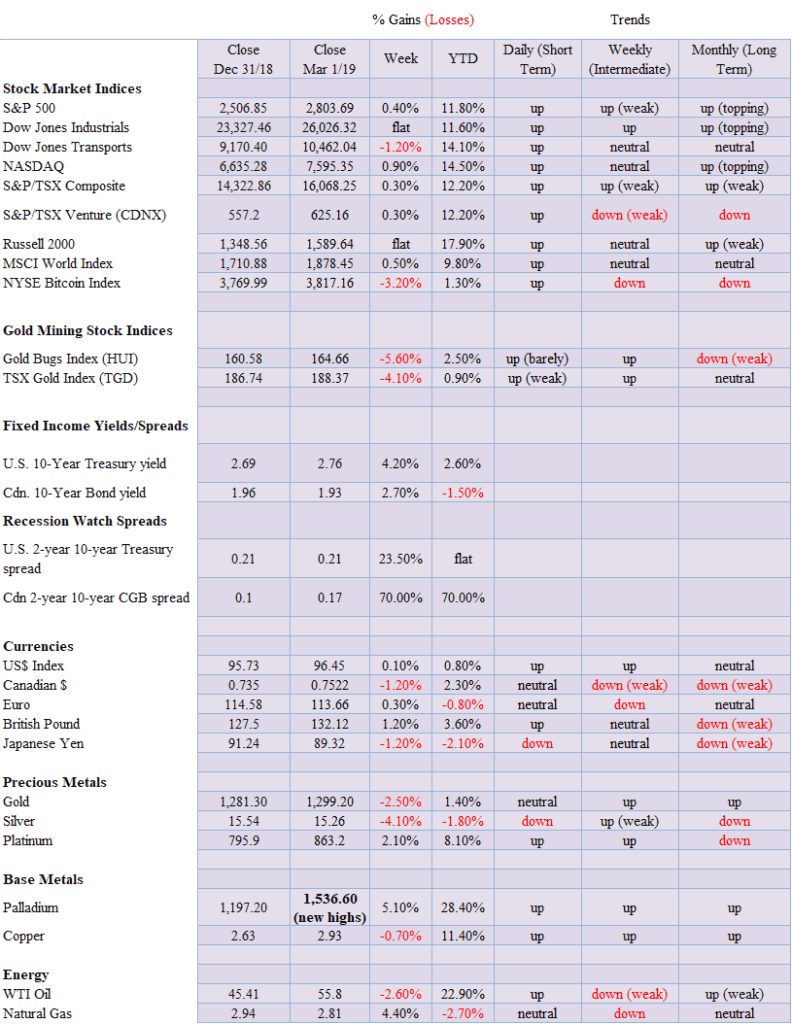
Stock markets continue to rise, but there are some signs that this rise is slowing. The first thing we note is the waning volume as the stock market moves higher, suggesting to us that there are fewer and fewer participants. This past week the Dow Jones Industrials (DJI) actually slipped 0.02%. So, it was essentially flat. The S&P 500 rose 0.4% while the NASDAQ jumped a solid 0.9%. But in a potentially negative divergence, the Dow Jones Transportations (DJT) fell 1.2%. The small-cap Russell 2000 was also pretty flat on the week as it rose a paltry 0.03%.
Elsewhere, the TSX Composite was up 0.3% as was the TSX Venture Exchange (CDNX). In overseas markets the MSCI World Index rose just under 0.5%, the London FTSE 100 faltered (Brexit woes?) falling 0.7%, but the Paris CAC 40 rose almost 1% and the German DAX was up 1.3%, seemingly shrugging off potential recession woes. In Asia, China’s Shanghai Index (SSEC) rose 4.9%, continuing its recent winning ways and the Tokyo Nikkei Dow (TKN) slipped 0.4%.
A rising DJI against the backdrop of signs that the U.S. economy could be slowing suggests that this rally could soon be running out of steam. Building permits have been falling now for the past year, housing starts are falling (thus weakening in construction), unemployment claims appear to have bottomed as they been rising for the past several weeks, and recent retail sales numbers were flat to negative. Consumer confidence has slipped from its highs. All in all, the numbers suggest a slowing economy. The latest GDP numbers also slowed from the previous quarter, but, overall, they remained robust for the year as the U.S. economy grew by 3.1%, the best in years.
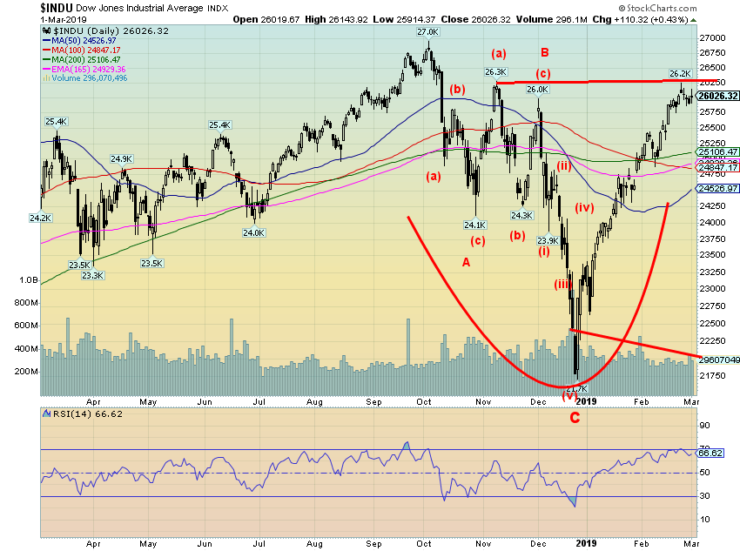
Despite this, the stock markets keep on rising. There was, as we noted, some divergences this past week as the NASDAQ actually made new highs for the move up, but the other indices did not confirm as they did not make new highs. We also noted the drop in the DJT. The stock markets are just under potential major breakout points that could spark a buying panic and a melt-up. 30,000 DJI here we come, but maybe not. The high so far for the DJI on this up move has been at 26,241. That was just shy of our major breakout level of 26,300. The S&P 500 also sits under its major breakout level of 2,825. The NASDAQ’s major breakout level is at 7,700. The NASDAQ also sits just under that level.
So, these markets are at important crossroads. Some indicators suggest that the markets will break those key levels and go on a melt-up. On the other hand, a pullback could occur but it might be shallow before they regroup and then burst through the melt-up levels. We could make an argument for a head and shoulders pattern if the DJI were to pull back and gyrate in a somewhat similar manner as it did in October/November 2018 before breaking down. A DJI break under 25,000 would be negative and suggest that this rally is over. Confirmation would come on a breakdown under 24,000. For the S&P 500, the points are at 2,700 and 2,600. The high for the S&P 500 so far is 2,813, just shy of our 2,825 major breakout level.
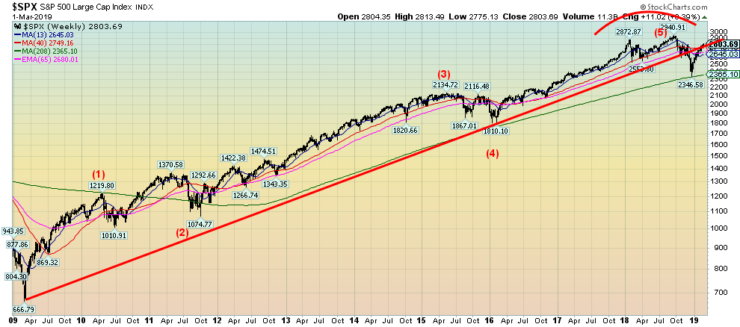
A reminder that our long-term chart of the S&P 500 suggests that we have most likely completed five waves up from the March 2009 low. Wave 2 was the EU Greek debt crisis of 2011 and wave 4 was the end of QE in 2015. Wave 5 got underway with the election of President Trump and expectations of tax cuts (fulfilled) and other very business-friendly legislation. Wave 5 was also, as we see in our Chart of the Week, fuelled by record corporate stock buybacks.
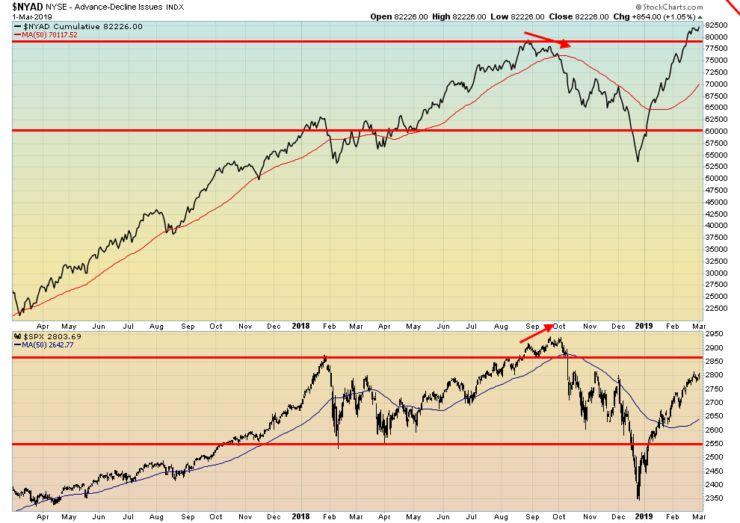
We continue to watch with some fascination the advance-decline line that continues to soar to record highs. We note that the S&P 500 continues to lag the advance in the advance-decline line. Trying to interpret it as the market continues to rise is difficult. It suggests that the stock market should also continue to rise. A top would be seen when the advance-decline makes a lower high while the stock market makes a higher high. This was seen at the top in August to September of 2018.
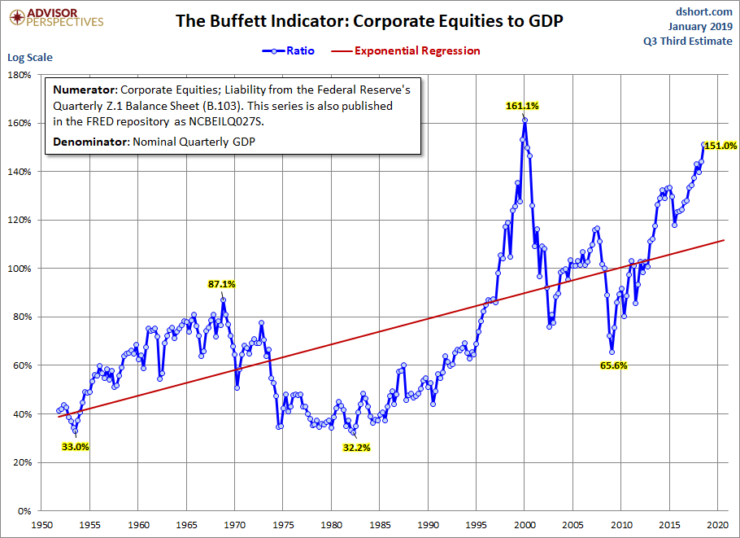
With the recent rise in the stock market, we thought we would look at what is known as the Buffett indicator that compares corporate equities to GDP. This indicator is often prescient of a market top. It hit an absolute high of 161.1% in 2000 before the high-tech/dot.com collapse of 2000–2002. Oddly, it came nowhere near that at the high in 2007 before the 2008 financial crisis.
Now the Buffett indicator has soared to 151%, the highest level seen since the 2000 top. The Buffett indicator is a great measure of stock market valuations. No, the current levels do not suggest that a top is in. But it is a powerful indicator that one should be extremely cautious about buying at these levels. Note how, back at the time of the 1987 stock market crash, the Buffett indicator was actually quite low, suggesting that the panic should be bought.
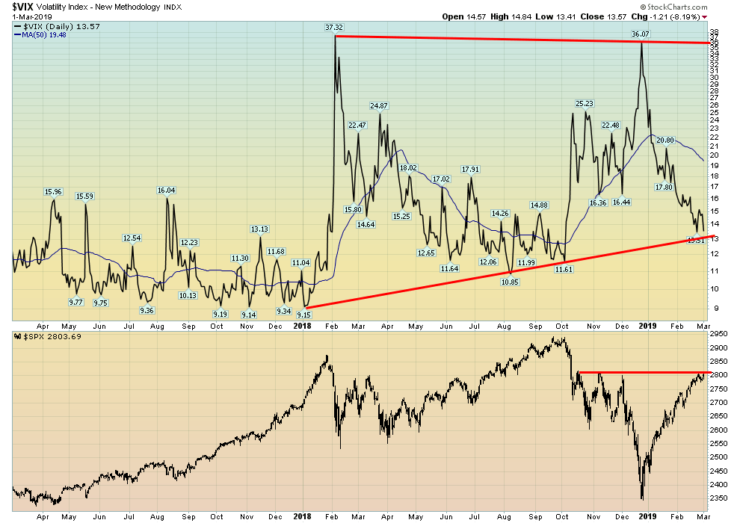
The VIX volatility indicator has been on a downward trajectory of late. A rising VIX suggests fear in the market while a falling VIX suggests that there is no fear and all is good. The VIX, however, remains well above its lows of 2017. The VIX’s all-time high was seen in 2008 at the height of the financial crisis hitting an unheard-of level of 80.86. The recent mini-panics in February 2019 and December 2019 saw the VIX only reach to half that level.
The December collapse saw a lower low for the S&P 500 but also a lower high for the VIX suggesting a divergence that might resolve itself with a strong rally in the stock market. Now the VIX is approaching that uptrend line from the record low seen in early 2018. An ideal divergence would be for the VIX to make a higher low while the S&P 500 soars to a new all-time high. That would set up a potential collapse.
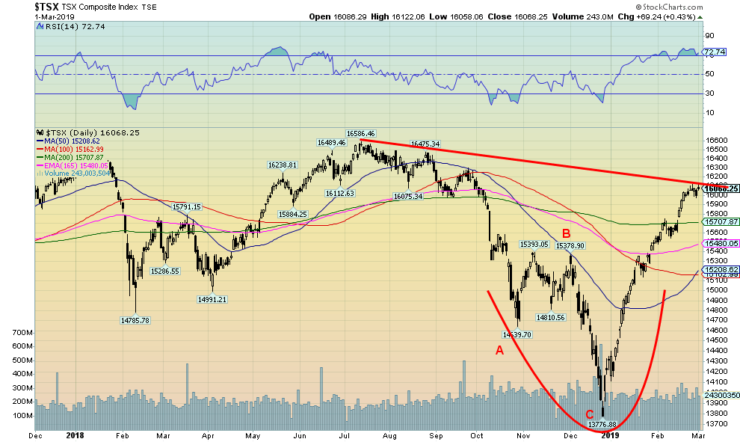
The TSX Composite appears to have hit a wall with the downtrend line from the July 2018 top. A firm break above 16,200 would, however, suggest that the TSX Composite could see new highs above the 16,586 seen in July 2018. The TSX Composite could test back to 15,700 without causing any ripples that a deeper drop was in store. Under 15,700 there is potential to fall to 15,200.
With an RSI that continues to hover above 70, the odds are that the TSX Composite is overdue for a pullback. However, if this really is a melt-up, the RSI over 70 won’t matter much as these overbought conditions can persist for some time as we have seen before. Shallow pullbacks are sufficient to at least ease some of the overbought conditions and even take the RSI back under 70. All this is occurring against the backdrop of a potentially slowing Canadian economy and the ongoing SNC-Lavalin affair.
Canada’s GDP
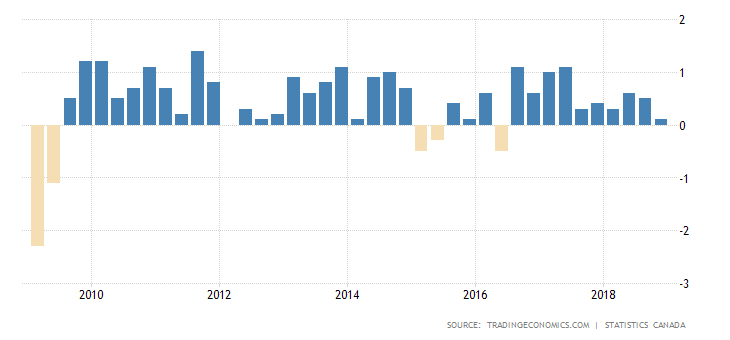
The Canadian economy grew at a paltry 0.1% quarter on quarter in Q4 of 2018. The previous period saw a growth of 0.5%. On the year, the Canadian economy only grew by 1.6%. Ongoing declines in construction and manufacturing are hurting Canadian GDP growth rates. It was the weakest growth since Q2 of 2016. Falling oil prices, lower oil exports, and final domestic demand all fell. Odds are pretty good that Canada will not see any further interest rate hikes for the time being. The Canadian dollar, however, did not fare as well and fell.
Canada’s unemployment rate
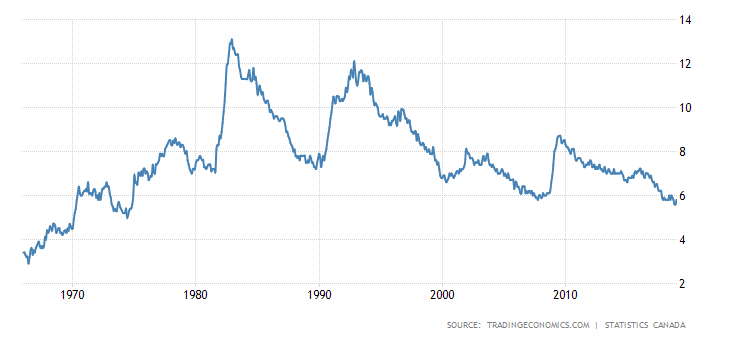
Despite the weak GDP numbers for Q4, Canada’s unemployment rate is at the lowest level in years, at levels seen back in the 1970s. At 5.8%, the unemployment rate is above its recent lows of 5.6%. One of the prime reasons the unemployment rate jumped recently was that more people entered the labor force looking for work. The labor force participation rate rose to 65.6% from 65.4%. It is noteworthy that the Canadian unemployment rate is higher than the U.S. unemployment rate.
One of the prime reasons is the labor force participation rate. In Canada, as noted, it is 65.6%, but in the U.S., it is only 63.2%. That lower participation rate helps to lower the overall unemployment rate. The Canadian economy added 66,800 jobs in January after adding 9,300 in December. The jobs in January were roughly evenly split between full-time and part-time. The February employment numbers are due next week. With signs that the Canadian economy could be slowing, the question is, will the unemployment rate hold up?
Canada’s disposable personal income
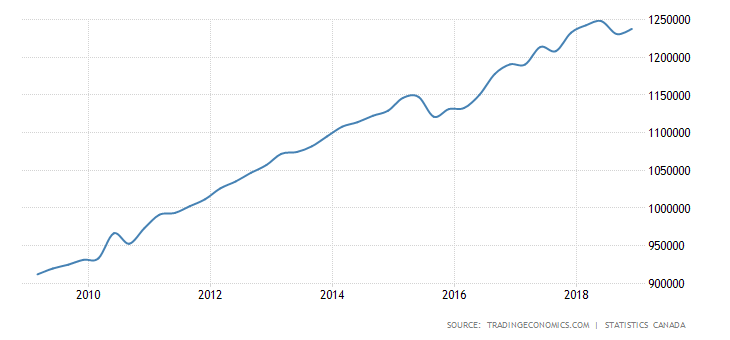
Canada’s disposable personal income rose in Q4 2018 to $1,237,732 million. Disposable personal income has been rising steadily since the dip during the 2007–2009 recession. There was a recent dip, but it appears to have picked up steam once again. In Q2 of 2018, it hit an all-time high of $1,248,172 million.
Canada’s household debt to disposable income
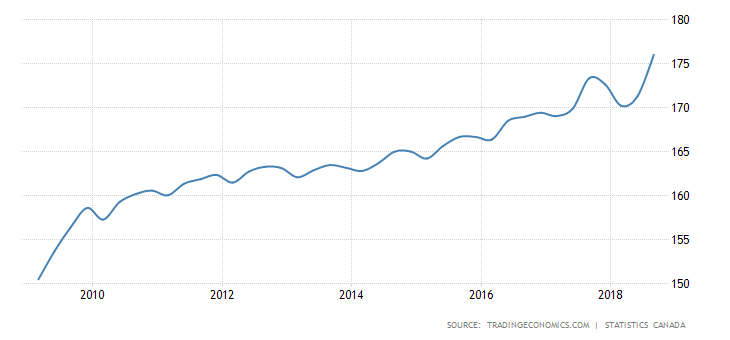
Canada’s household debt to disposable income remains in record territory at a possibly unsustainable 176.01%. Debt has been rising steadily for the past decade, much of it mortgage debt, although credit card debt remains quite high as well. This is not a good place to be as it has hit levels that are probably unsustainable. With signs that the economy could be slowing, the high debt levels could result in increased personal bankruptcies. To put this in perspective of the dangerous levels, Canadian household debt is well above the same rate in the U.S. The U.S. household debt to disposable income is at 86.5%. Canada’s current rate is well above the U.S. household debt to personal income hit at the peak in 2007 at 128%.
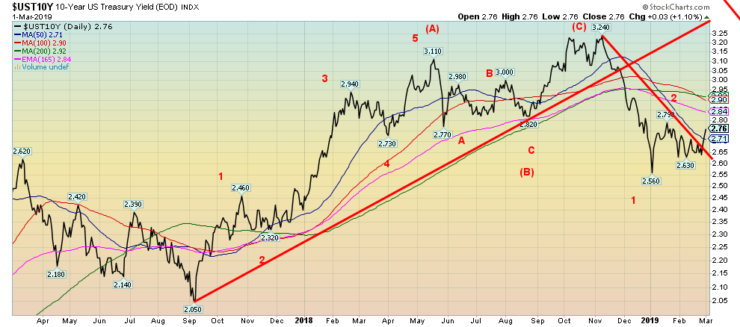
The U.S. 10-year Treasury note appears to have broken its downtrend this past week as it rose to 2.76% from 2.65% the previous week. We expect this is merely a part of the correction that began when yields hit a low of 2.56% in December as the stock market plunged. The 10-year would have to rise to over 3.00% to suggest that even higher yields are ahead. This correction has the potential to rise as high as 2.95%, even as we believe the real target could be around 2.84%. Higher bond yields of sovereigns in the eurozone helped push the U.S. 10-year higher.
Recession watch spread
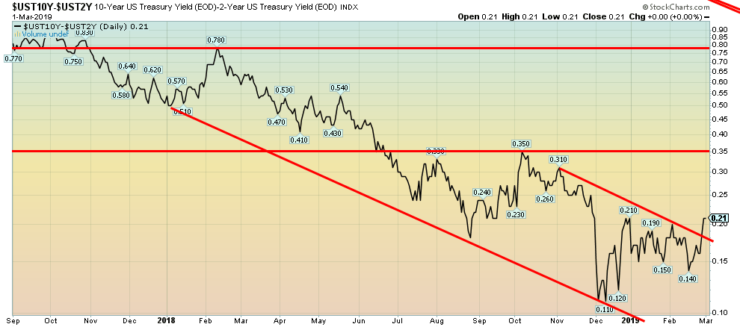
The recession watch spread, known as the 2-year U.S. Treasury note—10-year U.S. Treasury note spread or the 2–10 spread, broke out of the down channel this past week, rising to 21 bp, up from 17 bp the previous week. Clearly the 2–10 spread is not signaling a recession any time soon. A recession warning usually only occurs when the 2–10 spread turns negative for a period of about six months.
Technically, we could argue that the 2-10 spread is merely correcting the downward pattern that got under at 78 bp way back in February 2018. If correct, then the 2–10 spread could rise to at least 26 bp. Further potential lies up to 35–37 bp. A break back under 14 bp would signal that the 2–10 is poised to move lower. None of this suggests to us that the long-term decline in the 2–10 spread is over. With signs of a slowing U.S. economy, the 2–10 should resume its downward trek once this pop-up is over.
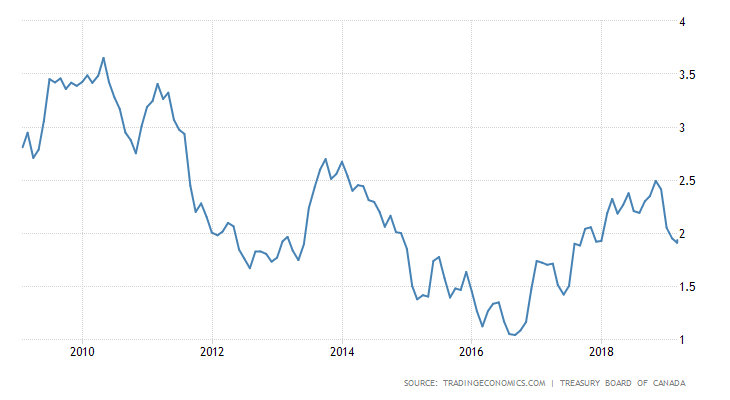
The Canadian 10-year Government of Canada bond (CGB) has fallen under 2%. This is in keeping with what appears to be a slowing Canadian economy. The CGB did rebound this past week as it rose to 1.93%, up from 1.88%. The CGB is at levels last seen in early 2018. The CGB is taking on the potential shape of a large head and shoulders bottom pattern. As long as the lows of 2012 are not taken out, then this pattern could develop further. If correct, then we could see higher interest rates into 2020. The breakout point would be around 2.50%.
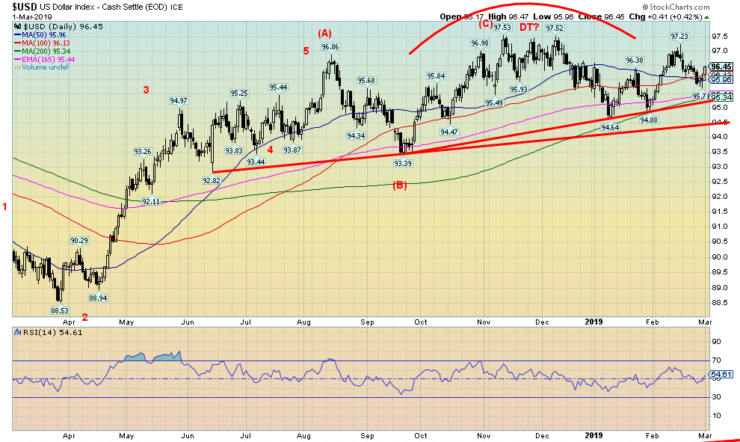
The US$ Index continues to trace out what appears to be a large topping pattern. The topping pattern is obviously quite complex. It also has the appearance of a potential large head and shoulders top. The breakdown point is around 95.25 with confirmation on a breakdown under 94.50. Minimum targets appear to be around 90.50, with potential down to 89.80. The US$ Index is being held up because the U.S. economy continues to outperform the eurozone and Japan. The euro and the Japanese yen are the major components of the US$ Index. The others are the pound sterling, the Canadian dollar, the Swiss franc, and the Swedish krona.
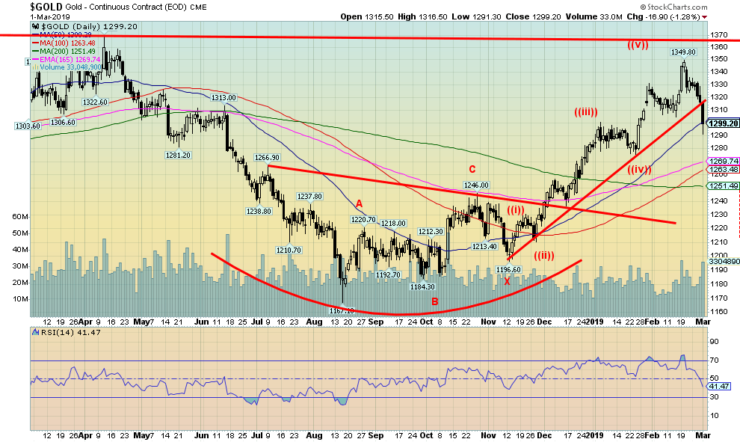
Gold broke trendline support this past week, plunging about $17 on Friday, March 1. Given that cash gold sold off further on Friday following the close of the futures, we anticipate that gold could open lower on Monday, possibly down around $1,290. While gold is pleased with the dovish tone coming out of the Fed, the Fed also gave little hint as to whether they were finished with rate hikes. Gold futures found support initially at the rising 50-day MA near $1,300.
A more likely target for gold is the 200-day MA, currently near $1,250. We note major support down to $1,220 so, in a worst-case scenario, we could test that level. Major resistance for gold remains from $1,350 to $1,370. Once above $1,370, gold could swiftly move to $1,400 and higher. It is probably not surprising that trader sentiment hit around 90% at the recent highs of $1,350. Even as of Friday’s close, trader sentiment remained around 65%. Typically, trader sentiment needs to get down to 10% or lower before a low is possible.
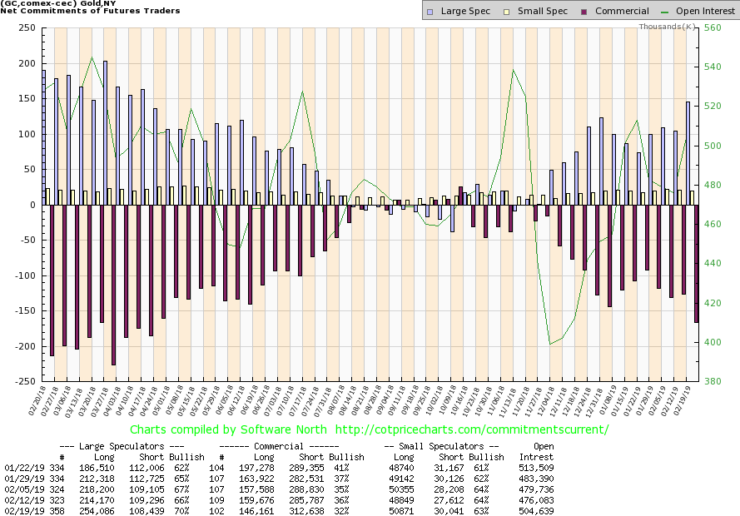
The commercial COT for gold slipped this past week to 32% from 36%. This suggests to us that gold has some more downside potential. Long open interest fell over 13,000 contracts while short open interest rose roughly 27,000 contracts. Not surprisingly the large speculators COT (hedge funds, managed futures, etc.) rose to 70% from 66%. That suggests they have been buying into this drop even as the commercials have been selling. The commercial COT remains bearish. We would like to see the commercial COT nicely above 40% to suggest that a low might be in.
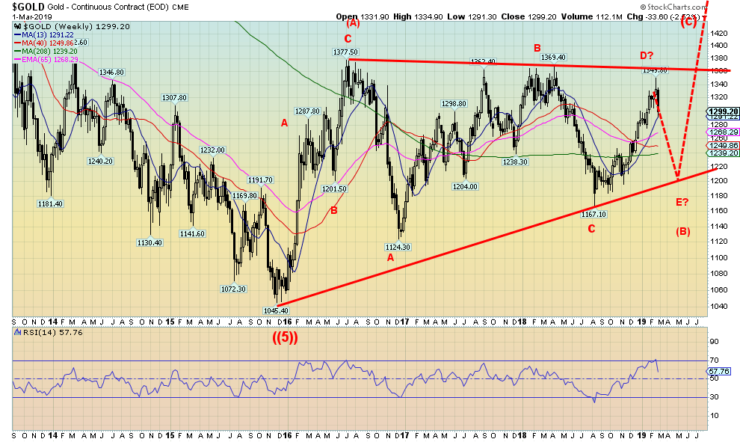
Gold began its bear market rally from the December 2015 low of $1,045. The first wave up topped in July 2016 at $1,377.50. We labeled that the (A) wave of a potential huge ABC type correction to the decline seen from 2011 to 2015 when gold prices fell from over $1,900 to the December 2015 low of $1,045. Following the July 2016 top, gold prices appear to be unfolding in a classic consolidation symmetrical triangle to be labeled ABCDE. The A wave bottomed in December 2016 at $1,124. Following that low gold rose irregularly to a final top in May 2018 at $1,369. The C wave down bottomed in August 2018 at $1,167.
We believe the D wave made its top on February 20, 2019, at $1,350. The E wave down is now in progress. The E wave tends to be the shortest of the ABCDE wave pattern. Target zones appear to range anywhere from a low of $1,220 to $1,280. The most likely target zone is probably somewhere between $1,240 to $1,280. We’d be concerned if gold fell under $1,220. New lows would be possible under $1,200. Once the E wave is complete, gold should embark on the (C) wave up. This wave should unfold in five waves and our target zones range from a minimum of $1,455 to as high as $1,725. Above $1,725 higher targets are possible, including new highs above $1,923 the 2011 all-time high.
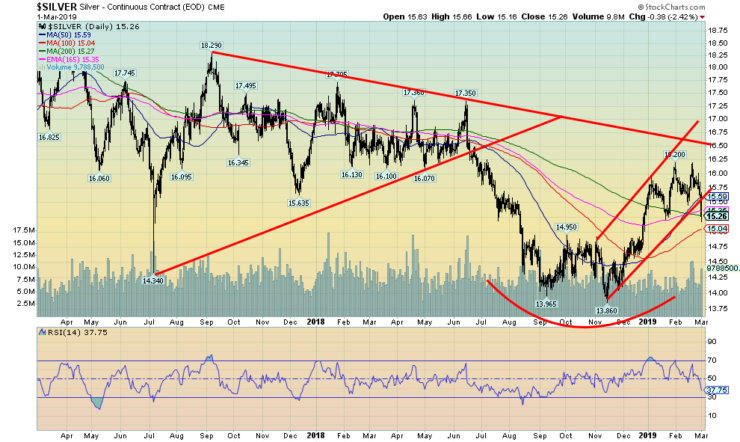
Silver prices fell 66 bp this past week, losing 4.1%. It was not a pleasant week for the junior precious metals. Note that silver prices took out the lows seen on February 14 at $15.45 and the low seen on January 20 at $15.20. The low on the week was Friday at $15.16. Our expectations are that, following a bounce, silver prices should work their way lower. We note considerable support down around $14.75 and that could be our target. Only below $14.40 could silver test the November low of $13.86. Resistance is seen at $15.45/$15.50 and again at $16. Above $16 new highs are probable.
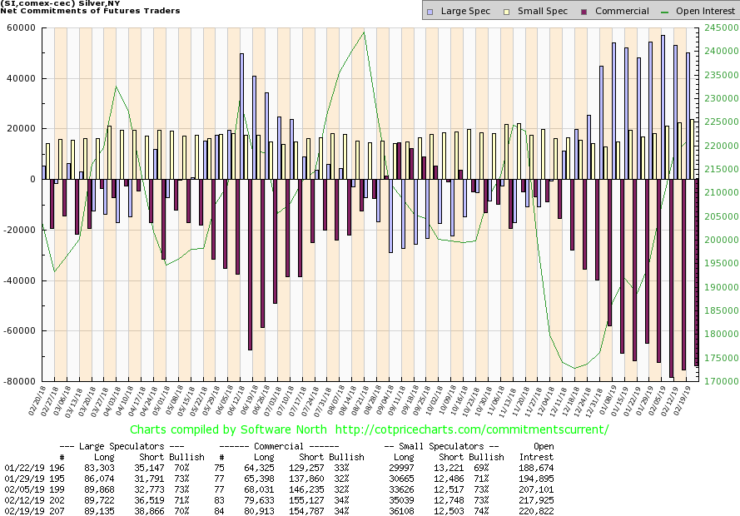
The silver commercial COT was unchanged this past week at 34%. We can interpret this as positive as the commercial COT for silver is off the recent lows of 32%. On the week, long open interest rose about 1,000 contracts while short open interest fell about 500 contracts. The large speculators COT slipped to 70% from 71%. There is nothing bullish seen yet in the commercial COT. Our expectations are that silver prices might consolidate at current levels or correct higher for a short period. To become bullish, we need to see the commercial COT rise towards 50% once again.
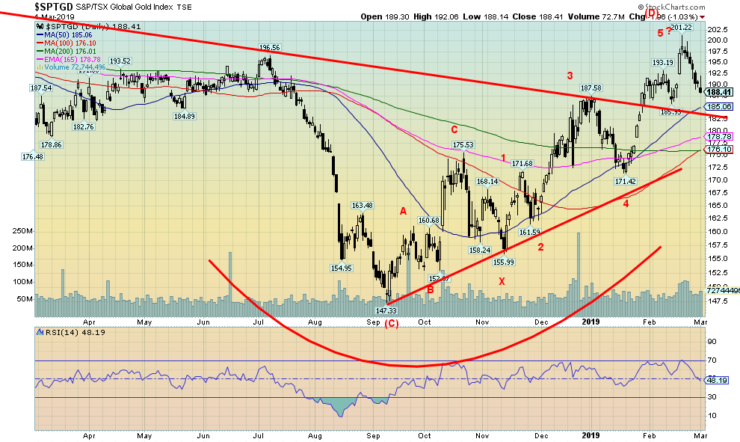
Gold stock prices followed gold and silver lower this past week. The TSX Gold Index (TGD) fell 4.1% while the Gold Bugs Index (HUI) dropped 5.6%. This should come as no surprise, especially with the $20 down day seen for gold on Friday, March 1. The TGD may have completed five waves up from the November 2018 low. If this is correct, then the TGD could correct the entire wave up from 147.33 seen in September 2018. The TGD achieved minimum objectives of 188.50 this past week. The next target could be down to around 180. Major support can be seen at 176.
A break under the January 2019 low of 171.42 would be more negative and the TGD could fall to 168. Under 160 would suggest a test of 147 the September 2018 low and possibly lower. Our best call here is that the TGD tests down to 176–180 for a low. That drop from December to January saw the TGD lose 8.6%. A similar drop now would see the TGD fall to 184. Based on that, a target zone of 176–180 seems quite reasonable. We note that the drop seen from October to November 2018 saw the TGD lose roughly 12%. A similar drop today again keeps the TGD in the 176–180 zone.
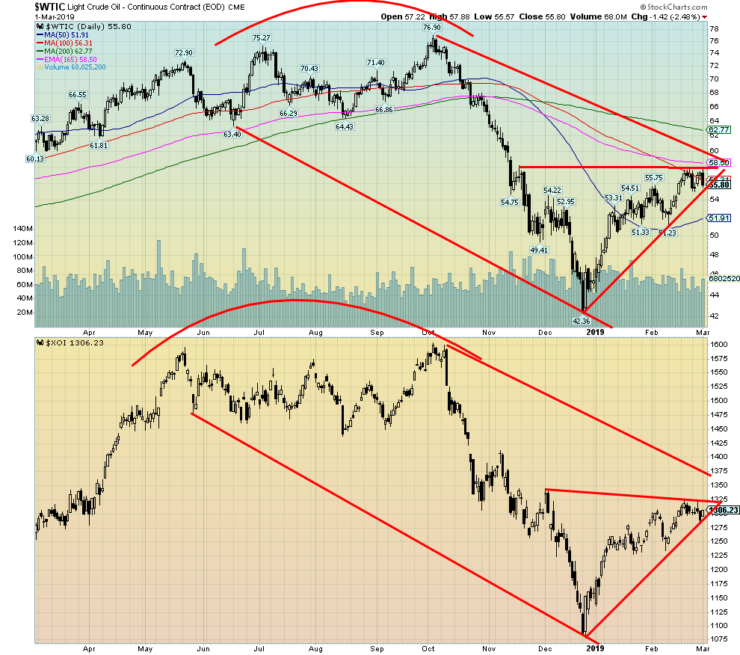
Have oil prices reached their limit? That’s the question we are asking as oil prices faltered this past week and WTI oil closed the week lower off 2.6%. Energy stock prices, however, bucked the downward trend of oil as the U.S. Oil & Gas Index (XOI) was up a small 0.1% on the week and the TSX Energy Index rose 1.7%. Despite the small gain for the XOI the index is wedged in a triangular box just the same as that seen for WTI oil.
If we create a bear channel for both WTI oil and the XOI by joining up the lows indicated above, then, by drawing a parallel line off the top, we can see that both oil and the XOI have some potential to move a little higher in the channel. Failure to do so would actually be bearish. WTI oil needs to break out over $60 to suggest that higher prices are possible while the XOI needs to breakout over 1375. A breakdown under $52 for WTI oil would be negative. Under $51 would suggest that WTI oil could go back down to test the lows at $42.35.
Chart of the week
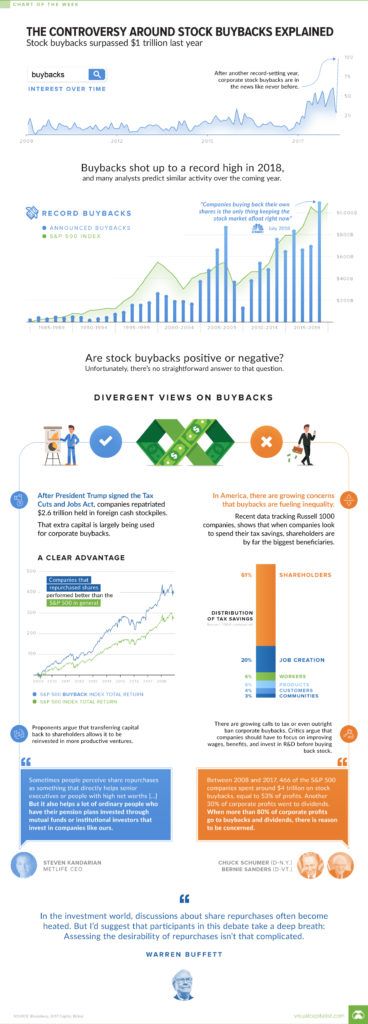
Visual Capitalist featured this rather interesting chart about stock buybacks this past week. We are afraid the quality of the chart does not translate well when we took it from them and pasted it into our article.
Highlights are as follows:
Stock buybacks shot to over $1 trillion in 2018.
- Stock buybacks have been rising over time. They were not a significant factor during the 1980s nor the 1990s. They rose sharply in the early 2000s, especially from 2005 to 2009, peaking in 2007 at over $800 billion. By 2009, stock buybacks had dwindled to less than $200 billion.
Given the record amount of stock buybacks that occurred in 2018, they were almost the only thing keeping the stock market afloat.
When President Trump signed the Tax Cuts and Jobs Act, companies repatriated some $2.6 trillion of cash that was being held in foreign countries outside the U.S. The funds were largely used to buy back stocks.
As a result of the corporate stock buybacks, the main beneficiaries were shareholders as few jobs were created as a result of the buybacks. Shareholders received over 60% of the benefits from stock buybacks while only 20% went to job creation. Workers received a paltry 6% of the distributions.
Companies that bought back their stocks outperformed the S&P 500.
The pros of stock buybacks are that if they are done rationally, buybacks (like dividends) are just another way to return cash to shareholders. Stock prices for companies that have bought back shares are also higher, in general than other companies on major indices like the S&P 500.
The cons of stock buybacks are that they increase inequality and that executives make short-term oriented decisions around buybacks that allow them to maximize personal gain. In other words, when a company probably should be investing in its people or its business, the company is, instead, giving money back to the wealthy owners—and only they benefit.
Companies not only used repatriated funds to buy back their stocks, but they also borrowed heavily to buy back shares. When the market tops and their stock begins to fall, they still have to pay back the debt. Many companies are now finding themselves in that situation. Having spent all the repatriated funds along with borrowed funds companies are now running out of the fuel needed to buy back their shares.
(Featured image by Rawpixel.com via Shutterstock)
—
DISCLAIMER: David Chapman is not a registered advisory service and is not an exempt market dealer (EMD). We do not and cannot give individualized market advice. The information in this article is intended only for informational and educational purposes. It should not be considered a solicitation of an offer or sale of any security. The reader assumes all risk when trading in securities and David Chapman advises consulting a licensed professional financial advisor before proceeding with any trade or idea presented in this article. We share our ideas and opinions for informational and educational purposes only and expect the reader to perform due diligence before considering a position in any security. That includes consulting with your own licensed professional financial advisor.


Bitcoin Stalls Near $60K as Strategy Moves, ETFs Outflow, and EU MiCA Rules Take Effect
Bitcoin hovers near $60,000 with ETF outflows, while Strategy boosts reserves, sells BTC, and raises dividends to reassure investors. Ethereum...


Cannabis Dominates Global Drug Use: Trends, Risks, and Shifting Markets
Cannabis remains the world’s most widely used illicit drug, with 256 million users in 2024, surpassing all others combined. Growth...


Italy Approves First Hydrogen-Powered Train for National Rail Network
ANSFISA has approved Italy’s first hydrogen-powered train, the Alstom HMU214, for use on the Brescia–Iseo–Edolo line. Capable of 140 km/h,...


Cotton Market Weakness Persists Despite Brief Rebound
Cotton prices fell to new lows last week before a modest rebound. USDA data shows crop conditions remain worse than...


Eli Lilly Hits $1 Trillion Valuation Amid Strong Bullish Momentum
Eli Lilly stock hit a record high, surpassing $1 trillion market value after strong product demand. Shares surged over 7%,...
 |
|
 |  |
 |
|
-

 Markets6 days ago
Commodity Markets Pause as Oil Falls, Metals Correct, and Grains Show Mixed Signals
-

 Africa2 weeks ago
Egypt’s Net Foreign Assets Rise as External Position Continues Gradual Strengthening
-

 Markets2 days ago
Oil Surges on U.S.–Iran Tensions as Global Markets Show Diverging Trends and Rising Risk Fears
-

 Markets1 week ago
Cocoa Market Faces Mixed Trends Amid Rising Supply and Weak Demand