Featured
Has gold reached its bottom in August?
It seems that the gold price posted on August 15, at $1,165.50, is the bottom of its current decline.

I’m going to take a three-week break. I usually do so at this time each year as in the late summer markets become tedious. I struggle finding something interesting to write about. All that and the need to spend some time with my files to get them back up to speed requires that I take some time off. I’ll be back September 22.
Closing the week only -3.10 percent from its last BEV Zero, the Dow Jones is progressing towards a new all-time high in its BEV chart below as it cleared the -3.43 percent from late February (Red Circle). Only 3.10 percent from a new all-time high and as much time as it needs to do it. But if it hasn’t closed within 1 percent from its January 26’s BEV Zero by the time I get back in late September, I’ll have to wonder why.
© Mark Lundeen
Here’s the Dow Jones in daily bars, heading toward its last all-time high of 26,616 seen on January 26; heading upwards in baby steps is fine with me. That’s a gap of only 826 points from January’s last all-time high to where the Dow Jones closed today. That’s a little less than the Dow Jones has traveled since July 12 when it closed at 24,924.
© Mark Lundeen
The stock market is advancing perversely again, rising on declining trading volume. The Dow Jones (Blue Plot below) bottomed on March 23 and has been rising ever since on declining trading volume (Red Plot). That’s unnatural.
If you believe in the law of supply and demand, you’d expect rising demand (rising trading volume) results in rising prices, and declining demand (declining trading volume) results in declining prices. From January 1900 to January 2000 (100 years) that was how the stock market worked. To be sure, there were days, weeks and the rare occasional month that saw valuations rise or fall contrary to fundamental trends in trading volume. However, over the months and years of any advance or decline in the stock market, complementary trends in market valuations and trading volume held.
Bull markets saw rising demand as they drew in the public with the promise of easy money. Bear markets saw declining demand as the public withdrew from the markets after losing most, if not all, of their life’s savings.
© Mark Lundeen
But all that changed after January 2000, where the stock market (using the Dow Jones as my proxy) typically advanced on declining trading volume, and declined on rising trading volume. This inversion of the law of supply and demand continued for 16 years, until just after Donald Trump won the November 2016 election.
Look at the post-March 2009 advance above. Trading volume saw an all-time high at its March 2009, -54 percent bear-market bottom, and then collapsed for five years as the Dow Jones recovered all of its sub-prime mortgage bear market losses, and then when on making one new all-time high after another. Except for the high-tech market bottom of October 2002, no other major market advance from a bear market bottom has operated like this.
Record trading volume at bear market bottoms tells me that these were very liquid bottoms. If you wanted to sell you may not have liked the price you were offered, but there was always someone offering you a price for what you were selling.
The bear markets of the 20th century bottomed on greatly reduced trading volume; that means those bear-market bottoms were illiquid markets. In July 1932, or April 1942, or November 1974, you may have wanted to sell and discovered that not only that you didn’t like the price, but the price was from a few days ago with no current bid for what you were selling! But all that changed after January 2000.
What this tells us is how heavily involved the “policy makers” have been in the financial markets since January 2000. And today, seeing the Dow Jones once again rising upward towards another new all-time high on declining trading volume says nothing has changed—market valuations are still being managed.
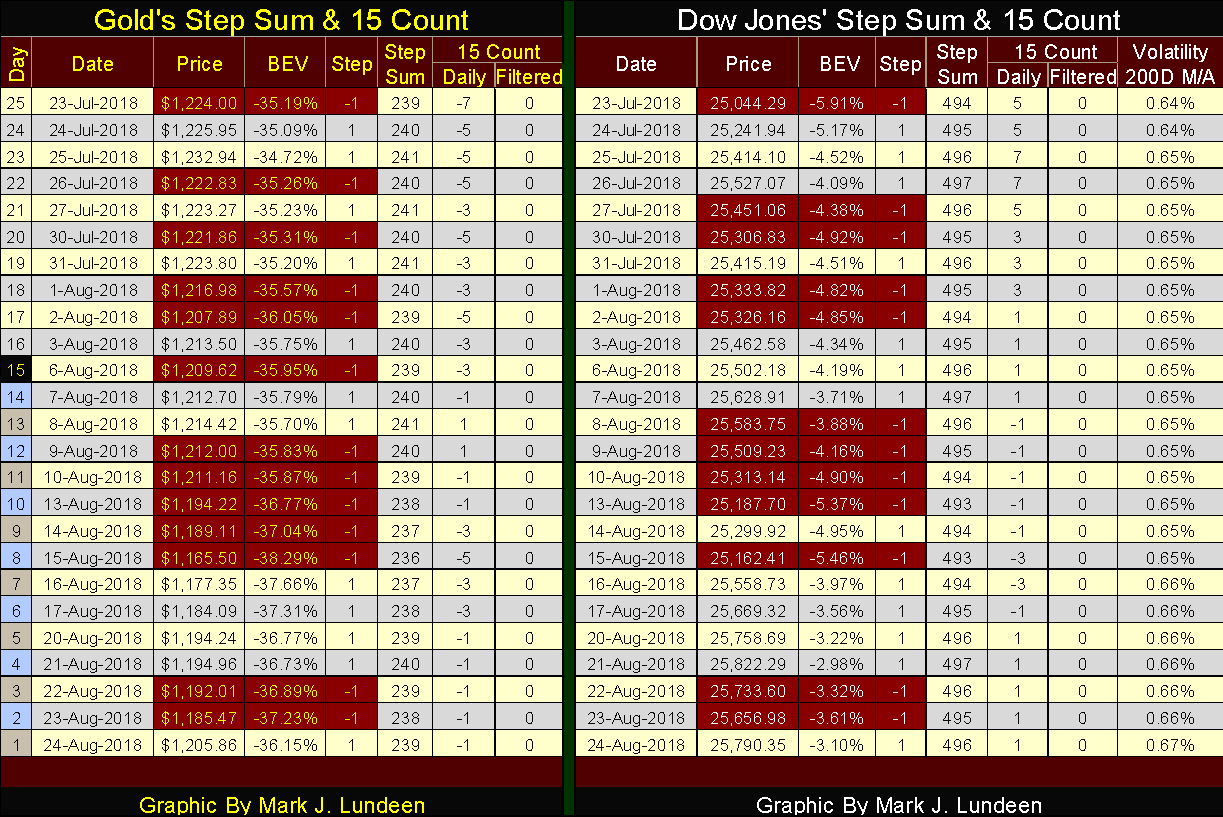
As for gold, after this week’s trading, it’s beginning to appear the $1,165.50 seen on August 15 (Day #8 table below) is the bottom of our current decline. On August 15, gold’s step sum bottomed at 236 as did its 15 count at -5.
© Mark Lundeen
When one looks at historical data quantitatively with metrics such as prices, a step sum, and the 15 count, data whose excitement has been washed away by the flow of time, one seeks turning points; bottoms and tops in the data. They’re always there to be found, extremes to the up or downside that was never again exceeded during any particular market advance or decline.
The same will be true for today’s market data. But unlike examining data from the Great Depression Crash, examining today’s statistics one has to deal with the emotional aspect of being a participant in market history. Looking at markets through our hopes and fears is no way to make money.
I’d rather look at gold’s 15 count’s frequency distribution in the table below, noting how in the 82 trading sessions since May 1, gold’s 15 count closed the day with positive values only 12 times (14.64 percent). For the other 85.36 percent of the past 82 days (70 days) the count was negative, with 28 percent (more than a quarter of the 82 days) seeing the count at a -5 or -7.
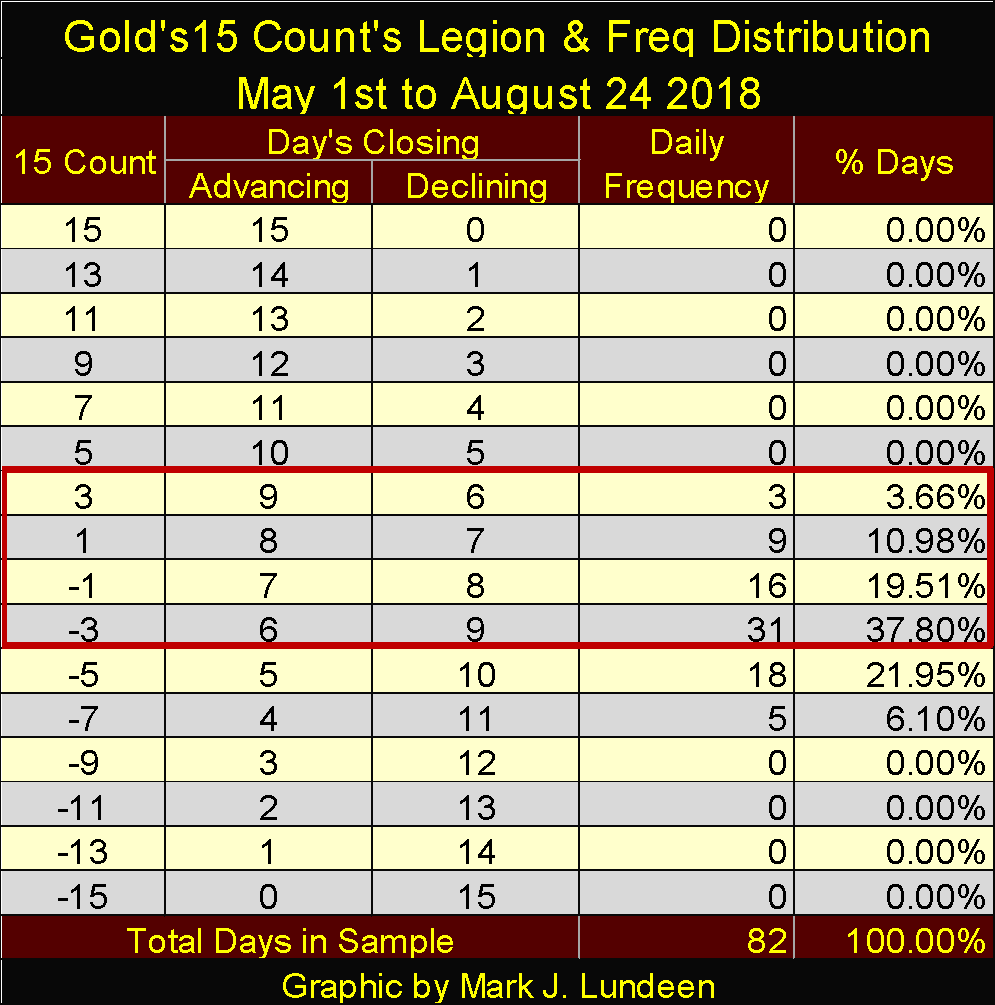
© Mark Lundeen
While these numbers aren’t historic, it’s obvious since May 1st gold has seen overwhelming selling pressure attempting to drive its valuation down. But gold closed at $1,309.83 on May 1, and closed today at $1,205.83. So, all that for only a $103.97 (7.94 percent) decline in the price of gold over a 15-week period?
Whether I’m right or wrong about the gold market seeing a bottom on August 15, the truth will be seen in the coming weeks and months. But even if I’m ultimately proven wrong, and the low August 15 doesn’t hold, I can’t imagine the bears being able to force gold to fall below $1,100.
Moving down to gold’s step sum chart below, the current decline in the step sum began on February 1 at 257, over six months ago and bottomed on August 15 at 236. That’s a net of 21 down days in the past six months, which as you can see is a considerable decline in gold’s step sum. But it wasn’t until after May 2 this selling program by the bears began having an impact on the price of gold. All this leads me to believe that gold (silver and the PM miners too) are markets that if left to their own fundamentals would have rather gone up than down since February 1.
© Mark Lundeen
I’ll be missing in action until September 22; don’t be surprised if we see a strong bounce in the old monetary metals and their miners before I return.
NBC News published a story of how many bolivars it takes to purchase a chicken in Venezuela.
NBC’s photo of how many bolivars it took to purchase a chicken was so impressive I inserted it in the chart below—so sad. But this is what happens when economics and “monetary policy” are controlled by politics. And politics is always about the needs of the people—the people at the top that is.
© Mark Lundeen
And Venezuela’s monetary woes isn’t a rare episode in the history of “monetary policy.” Since Evita told the Argentinian people not to cry for her, they’ve had many opportunities to cry for themselves with several episodes of complete currency collapse since 1945. Monetary inflations have stolen the wealth saved by the common people in many Latin American countries in the past four decades, some very similar to what we see in Venezuela’s bolivar above.
Zimbabwe’s bout of monetary inflation from 10 years ago was one to remember. As I recall, their central bank finally issued a 10 trillion Zim-dollar note. South Africa, now under the control of the African National Counsel, a Communist (Marxist-Leninist) Party, intends to follow in Zimbabwe’s path.
(Featured image by DepositPhotos)
—
DISCLAIMER: This article expresses my own ideas and opinions. Any information I have shared are from sources that I believe to be reliable and accurate. I did not receive any financial compensation in writing this post. I encourage any reader to do their own diligent research first before making any investment decisions.


PayPal’s Slowdown: From Fintech Leader to Low-Growth Dividend Stock
PayPal has shifted from fintech leader to low-growth, value-style stock, losing over 25% in market value and trading at a...


Tilray (TLRY) Falls as Bearish Momentum Persists Despite Marketing Push
Tilray (TLRY) fell 3.32% to $4.44, remaining below key moving averages and signaling continued bearish pressure. Despite a £1 million...


ESG Gap Persists as Firms Struggle to Link Sustainability to Financial Value
KPMG’s Global Survey shows a major gap between ESG awareness and financial integration. While 72% of managers understand sustainability strategies,...


Bitcoin and Ethereum Slide as Market Pressure Builds Amid Strategy Concerns and Layer 2 Disruptions
Bitcoin fell below $60,000 with heavy ETF outflows, pressured by concerns over Strategy’s finances and its STRC stock decline. Ethereum...


AI Venture Builder Launches €600K Crowdfunding Round to Scale Secure AI Solutions
AI Venture Builder, an Italian-British firm developing AI applications and vertical startups, returns to CrowdFundMe with a equity campaign. After...
 |
|
 |  |
 |
|
-

 Markets5 days ago
Cocoa Market Faces Mixed Trends Amid Rising Supply and Weak Demand
-

 Crypto2 weeks ago
Bitcoin Rises on Iran Deal as Crypto Markets React to AI and SpaceX News
-

 Africa3 days ago
Bank of Africa Expands Sino-African Trade Partnerships in Beijing
-

 Biotech1 week ago
Bavarian Biotech Sector Expands with Record Funding and Startup Growth in 2025
You must be logged in to post a comment Login