Markets
While the Gold Stocks Were Lower, They Were Not Trashed
Highlight of the week was the U.S. job numbers which came in higher than expected. However, there was another highlight and that was the potential key reversal seen with gold on December 4 when gold made a new all-time high overnight then reversed sharply and closed below the low of the previous day. The classic definition of a key reversal day. What it means going forward for gold we try to explain.

Did gold make a key reversal on December 4, 2023? What’s a key reversal? What’s the difference between a key reversal and a reversal day? After all, they look the same. Usually with a key reversal in an uptrend, we look for a strong uptrend and the market making new highs, or, in gold’s case, new all-time highs. The market opens sharply higher, only to fail, and then falls, taking out the low of the previous day and closing below the low of the previous day.
In gold’s case, on December 4 gold opened in overseas trading at $2,094 which was above the previous day’s close of about $2,090. Gold then shot up on the news that U.S. commercial ships had been hit in the Red Sea by the Houthis of Yemen. A new all-time high was made at $2,152.30. The market then reversed and, by the opening in New York, gold had traded back to around the opening level. Gold then plunged further, taking out the low of the previous day at $2,052.60. The definition of key reversal. By the time gold closed Friday following release of the better-than-expected job numbers gold fell a dramatic $138 from the all-time high on Monday. Gold closed the week at $2,014.50 after making a low of $2,010.60.
On the week, gold fell 3.6%, while silver fell a dramatic 10.0%, not only going back under $26 but also under $25 and $24. Platinum lost 1.7%, palladium fell 5.8%, and copper dropped 2.5%. The gold stocks were hit, as would be expected, but the loss wasn’t as dramatic as one might have expected. The Gold Bugs Index (HUI) lost 6.4% while the TSX Gold Index (TGD) dropped 5.4%.
It was a bad week overall for the precious metals market. The first weekly loss in a month. Besides the key reversal day on December 4 the U.S. job numbers which were higher than expected raised fears once again of higher interest rates. Gold fell sharply again on December 8. Topping it off was a headline we saw on Barron’s/MarketWatch on December 8 that “Gold Prices Are Near Record Highs. They May Keep Climbing for the Next 10 Years”. That’s not the headline you want to see. Those are the type of headline one sees at tops.
What is the difference between a reversal day and a key reversal day? A reversal day may look the same as a key reversal day, but no new high is being made. Reversal days are not unusual. Key reversal days, on the other hand, are rare. A potential key reversal day could mark an important turning point, but it can’t be correctly identified as such until after the fact, meaning until prices continue to move in the direction of the reversal significantly and for a prolonged period (Technical Analysis of the Futures Markets, by John J. Murphy, New York Institute of Finance). One can also get a weekly and monthly key reversal although they, like a key reversal day, are very rare.
Nonetheless, one would be wise to not ignore the signal. Note, as well, the uptick in volume on the reversal day. At best, the reversal might just be signaling a temporary top as well as signaling the battle at a key resistance zone $2,100. Interestingly enough, on October 6, 2023 gold put in a reversal day to the upside after making a new low to the downside. That proved to be a low and from there gold rallied some $196 or 10.7% before entering a period of consolidation below $2,000, a key resistance zone at the time.
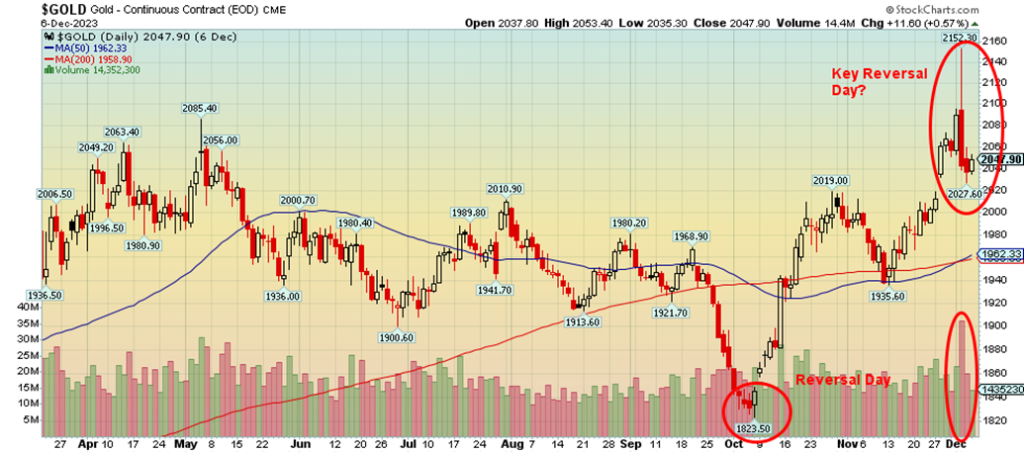
Gold’s key support zone now becomes $1,960 and the 200-day MA. That’s about a 10% decline from the all-time high. During the 2008-2011 gold bull market gold made 6 corrections of anywhere from 9% to 15% on its march to new all-time highs in September 2011. Note how the 200-day MA held in November. The 200-day MA can be penetrated, but a close below that level could signal further declines. $2,090/$2,100 now becomes resistance. If we want the bull to stay alive, it would be important for gold to close above $2,090 by year end.
Silver does follow gold and tends to lead both in uptrends and downtrends. Silver also put in an outside day reversal on December, but it was not a key reversal. However, like gold, it signals at least a temporary top. Volume was also heavy for silver. Key support is down at $23 and it is important that zone holds. The gold stocks, represented by the TSX Gold Index (TGD), made their high on December 1 and fell December 4, but it wasn’t a washout. The result is, with the gold stocks holding in, it gives some hope that this reversal is temporary. The TGD has good support, down 270, but below that level the market becomes more dangerous.
Golds seasonals remain positive, but important lows in December are not unusual. The most important low of the past decade was made in December 2015 when gold hit a low of $1,045. There was also an important low in December 2016. In both cases, strong rallies followed. The reasons to hold gold remain strong, given geopolitical concerns (war, great power confrontation), a Fed pause and even cuts, as well as the potential for the 2024 election to be controversial, given the deep polarization in the U.S. Gold, unlike equities and bonds, is no one’s liability. It has also been around for over 3,000 years as money and currency. It also is real, not a derivative or digital like Bitcoin.
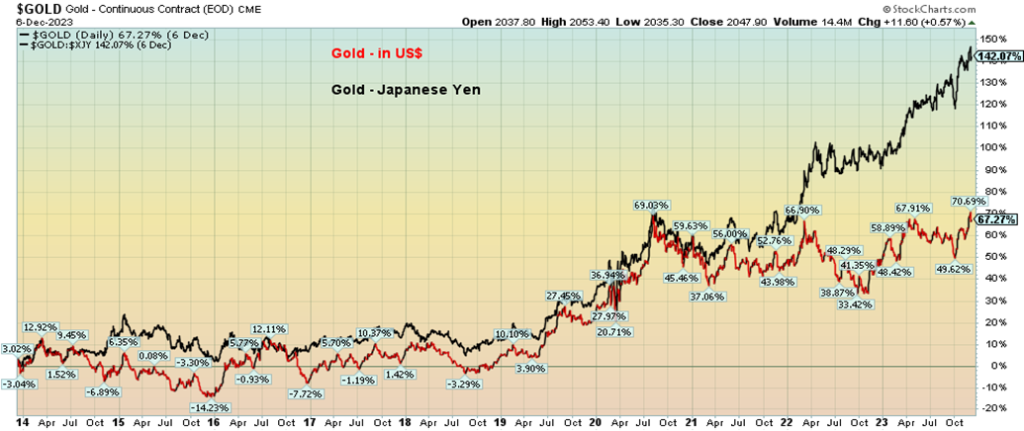
Gold has been making all-time highs in a number of currencies in 2023. With the all-time high for gold in U.S. dollars now at $2,152, we should also note that gold made all-time highs in 2023 in Canadian dollars, euros, pound sterling, Swiss franc, Australian dollars, and Japanese yen. Gold has made all-time highs as well in numerous other currencies. However, one thing we noticed is that the performance of gold in other currencies has outperformed that of gold in U.S. dollars. The most dramatic has been gold in Japanese yen, which is up 142.9% over the past decade vs. gold in U.S. dollars, which is up only 62.3%. Only gold in Swiss francs has tracked gold in US$ closely. Gold in Japanese yen tracked the performance of gold in U.S. dollars until early 2022 when gold in Japanese yen broke away and soared, primarily due to a big drop in the value of the yen. Gold helps maintain value and purchasing power, even as the fiat currency is sinking.
A classic example of this is that Canada’s currency, the Canadian dollar, has fallen in value about 0.4% thus far in 2023. Canada’s inflation was last reported at up 3.1% and weekly earnings up 4%. But gold in Cdn$ is up 10.7% thus far in 2023. A distinct advantage over holding Cdn$ and a loss of purchasing power due to inflation. Gold in Cdn$ outpaced even wage gains.
The big reversal day on December 4 can’t be ignored. The question is, is it temporary or is it signaling a more important top? The suggestion is that this is temporary, but until we take out the new all-time high, we could continue to correct. If we take out $1,960, then we’d have to consider whether gold made an important top.
Stocks
The stock market continues to try and move higher. While it remains possible for the stock market to make new highs and even new all-time highs (we are seeing numerous forecasts that it will), numerous divergences are emerging, suggesting that this market’s life may not last too much longer.
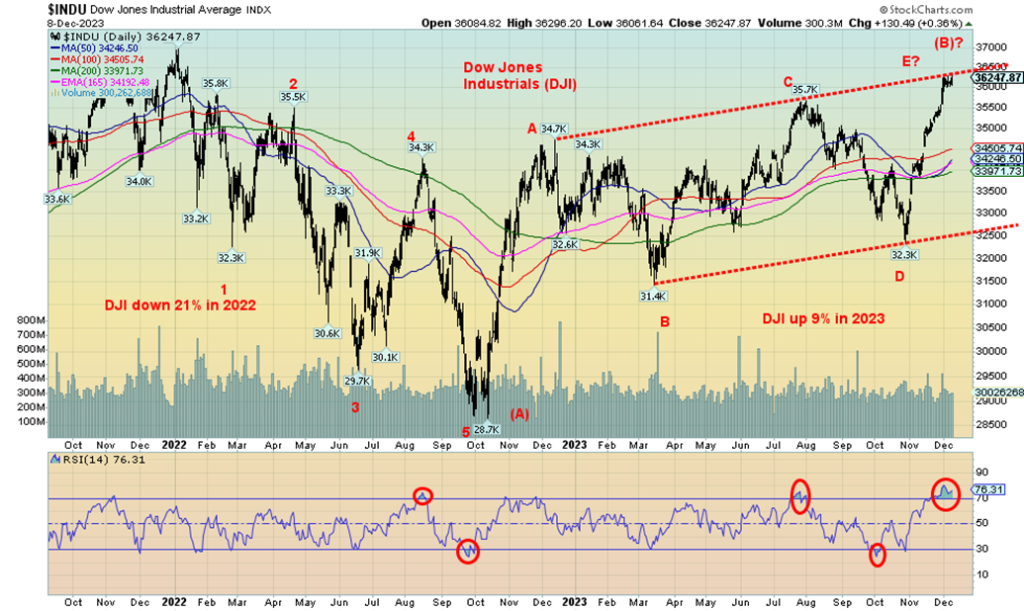
As we and many others have noted, the Magnificent Seven (Apple, Amazon, Microsoft, Alphabet (Google), Meta (Facebook), Nvidia, and Tesla) have been the prime drivers of the stock market rally. The seven make up some 30% of the S&P 500 and have been the prime drivers of the S&P 500, rising 19.9% in 2023. On the other hand, the S&P 500 Equal Weight Index is up only 6.2% and the Dow Jones Industrials (DJI) is up 9.4%. The NASDAQ, which also includes the Magnificent Seven, is up 36.7%.
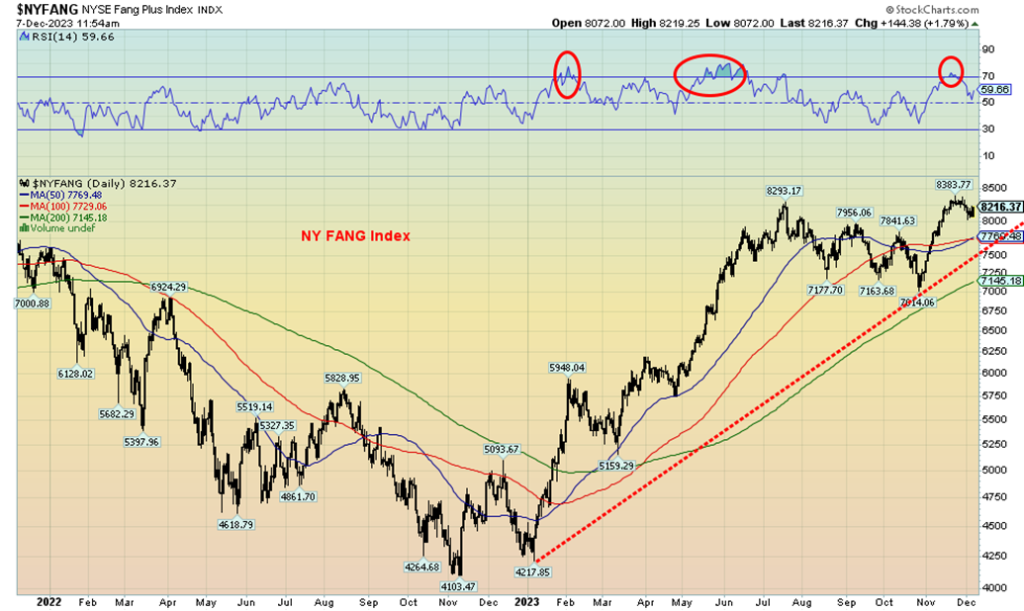
The Magnificent Seven also dominate the NY FANG Index, which has returned 86.8% so far in 2023. Thus, the importance of the Magnificent Seven and without them in the portfolio, returns for many were more than likely low or even negative. The question is, can it continue?
The market has been on a greed reading for some time. RSIs have been over 70, suggesting overbought. The DJI’s RSI hit over 80, a mostly unheard-of level. The rise since the October 2023 low has almost been straight up with little or no pause. Moves like that are usually not sustainable. Numerous divergences with other indices exist. The best example this week is that the Dow Jones Industrials (DJI) was higher, making new highs above its August 2023 high, but the Dow Jones Transportations (DJT) actually fell on the week and is nowhere
near its August high. The DJI is 1.4% above the August 2023 high while the DJT is 9% under its August 2023 high. The DJI is within 2% of its all-time high set in January 2022 while the DJT is 17% below its all-time high set in November 2021.
Our Elliott Wave count for the DJI since that October 2022 low appears to us as a potential ABCDE-type of correction. The decline from the January 2022 top appeared to fall in five waves, suggesting the beginning of a primary wave to the downside. If so, the A wave bottomed in October 2022 while the B wave may be completing now, even as we can’t deny we may see further gains before this is over. We will soon be entering the period of the so-called Santa Claus rally, and we note that the so-called January effect often now starts in mid-December.
We won’t know the market has topped until we confirm a breakdown. For the NY FANG Index, that could be a breakdown under 7,100 with potential interim support at 7,500/7,600. For the DJI, a breakdown under 34,000 could suggest that the party is over. Under 32,500, it truly is over and we are in the throes of the C wave to the downside.
For the record on the week, the S&P 500 (SPX) gained 0.2% this past week, thanks to a good day on Friday following the job numbers. The SPX is now within three points of taking out the July high. The DJI was flat on the week, despite making a new 52-week high. The DJT diverged, losing 1.6%, while the NASDAQ was up 0.7%.
The S&P 400 (Mid) gained 0.3% while the S&P 600 (Small) was up 1.3%. That the Small is gaining could be a sign that the market is broadening out, but it could also mean they are rushing into small caps near the top. The S&P 500 Equal Weight Index was flat, while the NY FANG Index was up 1.2%, showing how it dominates the market.
In Canada, the TSX Composite lost 0.6% while the TSX Venture Exchange (CDNX) fell 1.6%. The TSX Energy Index (TEN) led the way down, falling 6.3%, while Golds (TGD) lost 5.4%. The big winner was Consumer Staples (TCS), up 1.5%. The sub-indices were split, 7 up and 7 down.
In the EU, the London FTSE gained 0.3%, the Paris CAC 40 equaled its previous 52-week high, up 2.5%, while the German DAX did make 52-week highs, up 2.2%. In Asia, China’s Shanghai Index (SSEC) continued its losing ways as the Chinese economy shrinks, off 2.1%, the Tokyo Nikkei Dow (TKN) also fell, down 2.6%, while Hong Kong’s Hang Seng (HSI) fell 3.0%. The EU and North America up, Asia down.
Markets are betting that the Fed will pause, but thoughts of rate cuts in 2024 have lessened thanks to the better-than-expected job numbers. Inflation numbers are out this coming week (Tuesday) and are expected to come in at 3.1% year over year (y-o-y) vs. 3.2% in October. That should keep thoughts of a pause in place.
Bitcoin
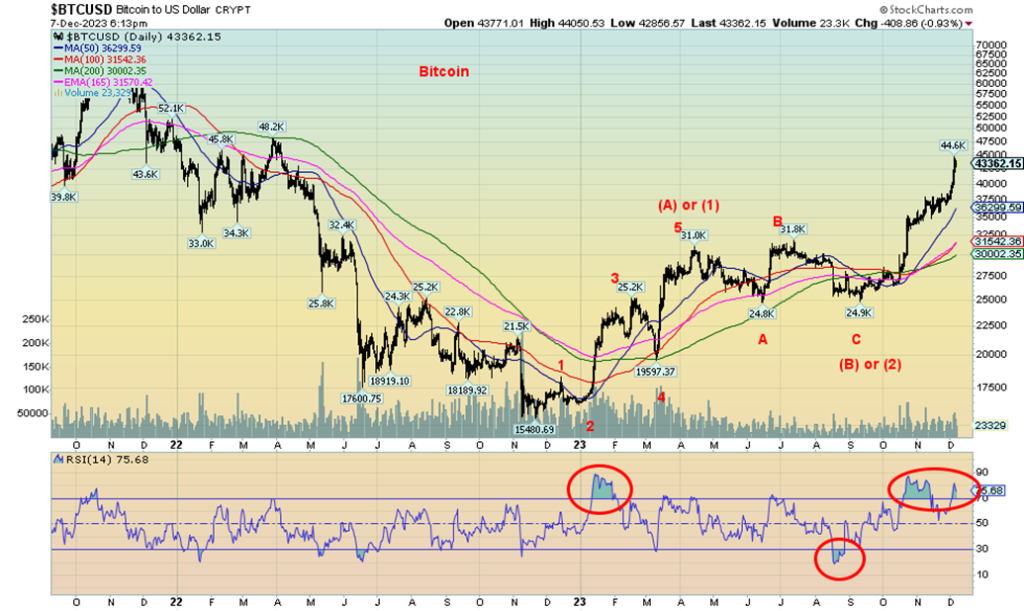
Bitcoin doesn’t seem to get the same attention today that it did in 2017 and 2021 when it was soaring to record highs. But then the crypto currency market is just not the same as it was then, given years of scams, collapses, thefts, disappearances, arrests, mysterious deaths and regulators crawling all over it trying to figure out how to control it. Oh yes, and the constant rumours that cryptos are used for money laundering.
In 2017, Bitcoin soared over 2,000%. In 2021, Bitcoin soared 250%, but then it started at a much higher level. The crypto market soared to a market cap over $3 trillion. Today, the entire market sits at about $1.6 trillion and Bitcoin has seen its market cap that was well over $1 trillion in 2021 today sitting at just over $800 billion. But that’s up from a low of just over $300 billion.
The crypto market just doesn’t get the same attention it used to. Many cryptos have folded or just never were. Coin Market Cap (www.coinmarketcap.com) still lists over 2,000 cryptos on some 680 exchanges. Most are small and the market remains highly speculative. Bitcoin makes up over half the market and remains the best known. What has been baffling for many is that Bitcoin has been soaring up recently, hitting $44,000. There are still 60 cryptos listed with market caps over $1 billion.
We’re not sure what to make of the recent rise. Is this a correction to the big drop from the record high of $69,000 to $17,000, or is this the start of new significant bull market to new all-time highs? There may be some reasons for the rise, given talk of an ETF, but the market is one for speculators only. Cryptos still do not have any wide use as a currency.
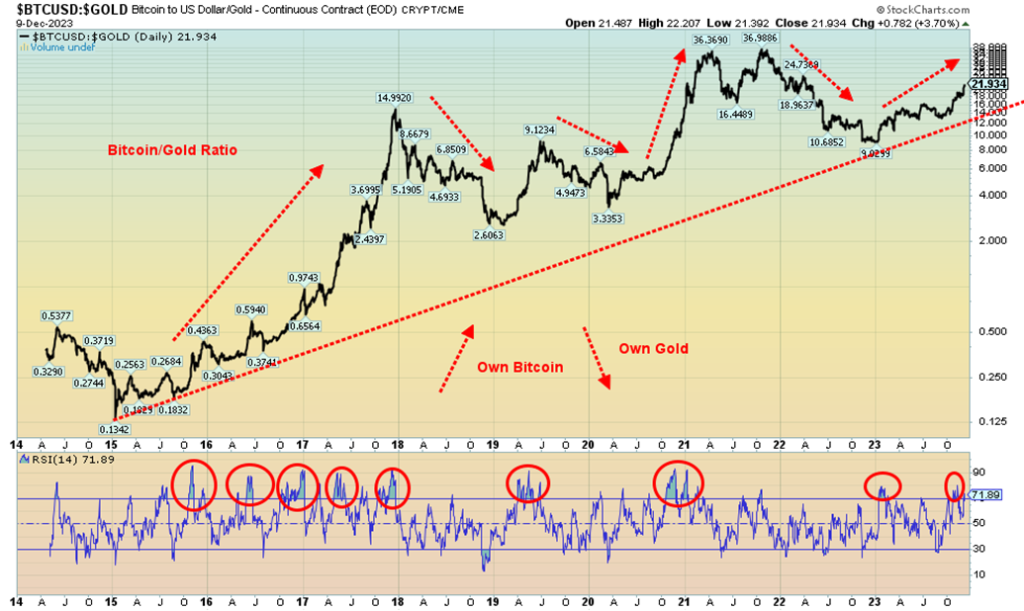
What has been baffling for the gold bugs, however, is that Bitcoin has been rising sharply and gold (which is real, not virtual) has not kept pace. The Bitcoin/Gold ratio has gone from 8.89 in 2022 to 21.37 today in favor of Bitcoin. Interesting, however, is that the ratio is nowhere near highs seen in April 2021 and October 2021, despite the strong showing from Bitcoin. A divergence that could favor gold going forward.
Oil
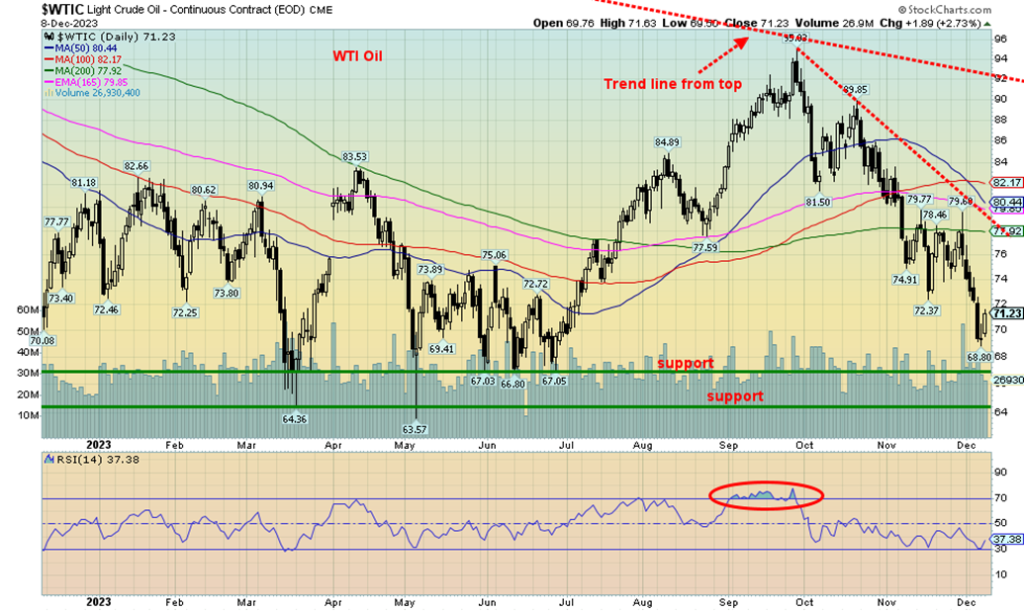
WTI oil was hit this past week on slowing demand, despite OPEC production cuts, while non-OPEC, led by the U.S., increased production to compensate and oil supply was gushing from Guyana. This leaves us thinking that one of two things could happen. OPEC could reverse and pump out supply like crazy to spark a price war, sending prices plummeting and making North American oil, particularly Canada’s, non-profitable.
This is what happened in both the 1980s and 1990s as the Saudis turned on the spigots to send prices plummeting. That in turn would spark shutdowns. Or, prices could soar if a supply disruption hit because of an outbreak of war, particularly vs. Iran where the U.S. is under pressure from attacks from alleged Iranian-backed militias in Iraq and Syria and from the Houthis in Yemen. Iranian-backed Hezbollah is also attacking Israel on the Israel/Lebanon border. As well, the U.S. embassy in Baghdad (Iraq) has come under constant fire.
WTI oil plunged under $70 this past week, suggesting to us that the May low of $63.57 could fall. The odds are now high. However, on Friday following the U.S. job numbers, WTI oil rebounded and then managed to close the week over $71, but still losing 3.8%. Brent crude lost 3.9%. Natural gas (NG) also fell off 8.2% while NG at the EU Dutch Hub fell 11.3%. The energy stocks as a result were whacked as the ARCA Oil & Gas Index (XOI) fell 3.6%, while the TSX Energy Index (TEN) fell 6.3%. Not a good week.
Falling Chinese demand because of economic weakness there is not helping. Also, a potential conflict is stirring in Venezuela, which has long claimed that the Essequibo region of Guyana is actually Venezuelan territory. Venezuela, in a referendum to annex the Essequibo region, ordered the Venezuelan state-owned companies to explore the region. In response, the U.S. started military drills with Guyana.
Could a conflict break out in South America involving the U.S and Venezuela? The U.S. is already burdened with supporting/funding Ukraine in the Russia/Ukraine war, Israel in the Israeli/Hamas war, attacks against the U.S. in Syria, Iraq, and from Yemen, and don’t forget the ongoing support/funding of Taiwan in its conflict with China. Could they fund yet another conflict?
The U.S. already runs deficits equal to 6.8% of GDP levels, deficits that are as if the U.S. is at war. It is the highest since World War II, although still above (below?) the level hit in 2020 when the deficit was 14.7% of GDP. In World War II, the deficit hit a low (high?) of 26.9% of GDP. Over the past 94 years, the U.S. has only run a surplus in the late 1940s just after the war was over, and again in the late 1990s.
The cumulative U.S. federal debt is now $33.8 trillion, with a debt/GDP ratio of 124.5%. Japan at 264% and Italy at 142% are the only two G7 countries with a higher debt to GDP. Russia is at 17.2% and China at 77.1%. Canada is at 68.6%, although with the provinces the debt to GDP ratio is 107%. The latter number is usually referred to in discussing Canada’s debt/GDP ratio.
Oil prices could go either way here, although the odds favour new lows unless we are able to take out $78 first. With potential positive seasonals coming, we may hit a low here for oil (and natural gas well).
U.S. Job Numbers
U.S. Employed Persons vs. Unemployed Persons 2013–2023
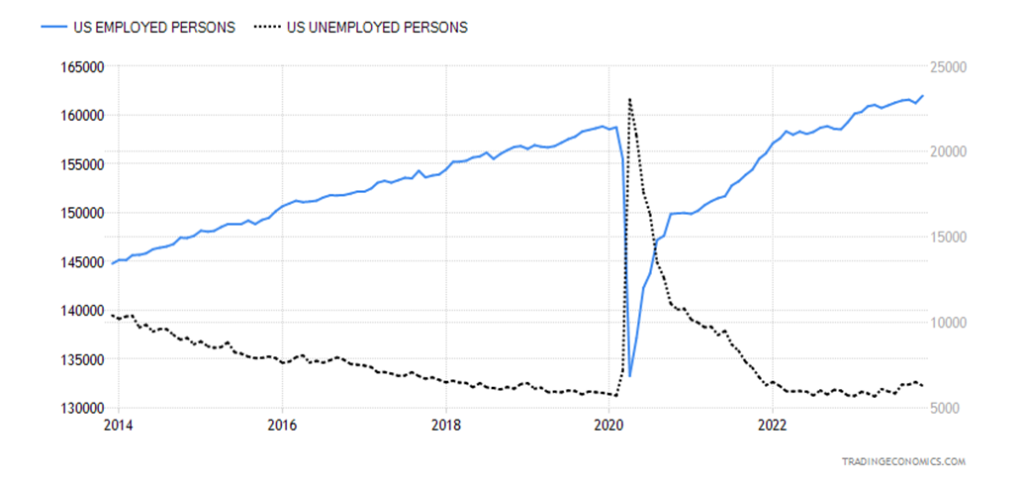
The U.S. labor market continues to be stronger and more resilient than many believe it should be. Nonfarm payrolls for November came in up 199,000 when the market had expected only around 180,000. However, they did revise the two previous months’ numbers lower by 35,000.
The unemployment rate (U3) actually fell to 3.7% from 3.9% while the U6 unemployment, the highest reported by the Bureau of Labor Statistics (BLS) (U6 = all persons marginally attached to the labour force, plus total employed part-time for economic reasons, as a percent of the civilian labour force, plus all persons marginally attached to the labor force) was 7.0% vs. 7.2% the previous month.
The market had expected U3 to come in at 3.9%. The Shadow Stats (SGS) (www.shadowstats.com) unemployment number that is U6 plus estimated long-term discouraged workers, who were defined out of official existence in 1994, was reported by SGS as 25.4% unchanged from October.
The total population level of those 15 and older rose 180,000 while the civilian labour force jumped by 336,000. The employment level was up a big 747,000; however, that is from the household survey which differs from the establishment survey that reports the nonfarm payrolls. The previous month it had fallen by 338,000.
Full-time employment was up 347,000 while part-time employment fell 331,000. The number of unemployed fell 215,000, while the number for those reported as not in the labour force was down 23,000. Many numbers we can’t reconcile, nor it seems can other economists we’ve noted. The labour force participation rate was 62.8% vs. 62.7%, while the employment population ratio rose to 60.5% from 60.2%.
All of this seems quite rosy. We can only guess that’s the good news. The bad news is that the odds of rate cuts in 2024 have diminished and bond yields that had been falling rose on Friday following the numbers.
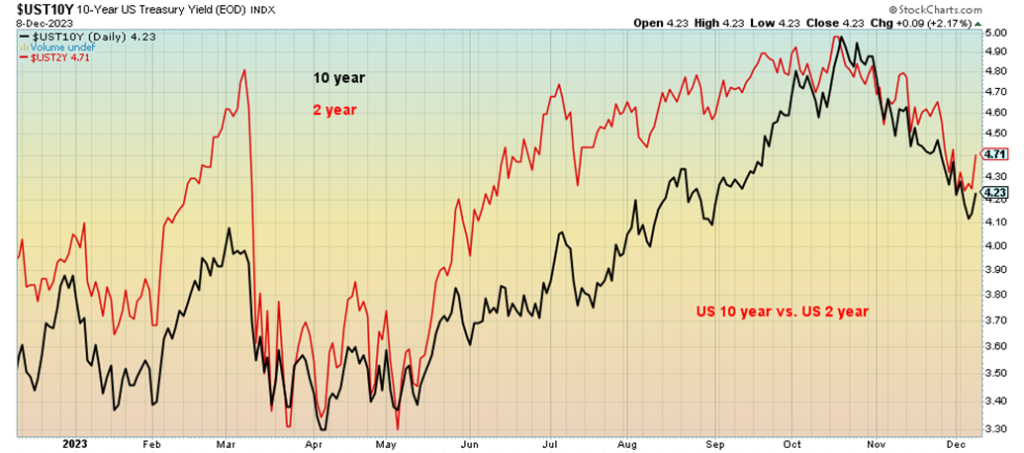
On the week, the U.S. 10-year treasury note rose to 4.23% from 4.21%. It had been lower earlier. In Canada, the 10-year Government of Canada bond (CGB) fell to 3.38% from 3.43% the previous week. The short-term yields jumped on the news and as a result the 2–10 spread in the U.S. rose to 49 bp from 34 bp and in Canada to 77 bp from 64 bp.
The inverted yield curve continues high, pointing to a recession, but admittedly it is taking its time in falling. The closer it gets to zero, it indicates that the recession could be getting underway. As we and others have noted we have never seen the inverted get as high as it did and stay that way for a prolonged period of time. This suggests to us that the coming recession may be a hard landing and not the soft landing that many are expecting.
Surprisingly we learn that 70% of the market is not only expecting a soft landing but have loaded up on bonds expecting rates to fall further. As one pundit suggested are they counting their profits before the market has even fallen? The inversion continues as we watched short rates back up more this past week then long rates.
A potential record number of bond issues are coming out in 2024. Fed Chair Jerome Powell has called the U.S. fiscal path unsustainable (Wall Street Journal December 1, 2023). Yet issuing more debt is what the U.S. has to do to fund everything. But with growing wars and the ongoing rift with China it is actually surprising they believe that further rate declines are coming.
The work week rose to 34.4 hours vs. 34.3 hours, while hourly earnings were up 0.4% on the month and up 4.0% y-o-y. Both were as expected.
Meanwhile, things continue to contract. The latest money supply numbers show M1 down $90.5 billion while M2 fell $29.5 billion from highs. The Fed’s balance sheet also continues to contract, down $4.9 billion in the latest numbers. A contracting money supply and Fed balance sheet is more indicative of a coming recession then it is of growth.
We know things are slowing. Retail is cutting some 40,000+ jobs as the expectation is the Christmas season will be slow. But consumer confidence has jumped as the Michigan Consumer Sentiment Index unexpectedly jumped to 69.4% when they expected only 62.0% vs. last month’s 61.3%. Inflation expectations also fell. Continuing claims are the highest in two years, job openings are the lowest since March 2021, and job listings are falling. So, the rosy was offset by the not so rosy.
This coming week is the Fed meeting December 13–14. The expectation is the Fed does nothing, but listen carefully to Powell to hint whether they are still hawkish or are becoming dovish. We lean towards hawkish. The Fed is usually behind the curve and starts hiking too late, then starts cutting too late as well. So, the expectation that the Fed would cut rates into the first half of 2024 always seemed misplaced.
U.S. 10-year vs. U.S. 2-year
Markets & Trends
| % Gains (Losses) Trends | ||||||||
| Close Dec 31/22 | Close Dec 8, 2023 | Week | YTD | Daily (Short Term) | Weekly (Intermediate) | Monthly (Long Term) | ||
| Stock Market Indices | ||||||||
| S&P 500 | 3,839.50 | 4,604.37 | 0.2% | 19.9% | up | up | up | |
| Dow Jones Industrials | 33,147.25 | 36,247.87 (new highs) | flat | 9.4% | up | up | up | |
| Dow Jones Transport | 13,391.91 | 15,211.06 | (1.6)% | 13.6% | up | up (weak) | up | |
| NASDAQ | 10,466.48 | 14,403.97 | 0.7% | 37.6% | up | up | up | |
| S&P/TSX Composite | 19,384.92 | 20,331.54 | (0.6)% | 4.9% | up | up | up (weak) | |
| S&P/TSX Venture (CDNX) | 570.27 | 537.50 | (1.6)% | (5.8)% | up | down | down | |
| S&P 600 (small) | 1,157.53 | 1,220.21 | 1.3% | 5.4% | up | up | neutral | |
| MSCI World | 1,977.74 | 2,153.19 | 0.5% | 8.9% | up | up | neutral | |
| Bitcoin | 16,531.31 | 44,001.69 (new highs) | 13.2% | 166.2% | up | up | up | |
| Gold Mining Stock Indices | ||||||||
| Gold Bugs Index (HUI) | 229.75 | 229.47 | (6.4)% | (0.1)% | up (weak) | neutral | down (weak) | |
| TSX Gold Index (TGD) | 277.68 | 276.84 | (5.4)% | (0.3)% | neutral | neutral | neutral | |
| % | ||||||||
| U.S. 10-Year Treasury Bond yield | 3.88% | 4.23% | 0.5% | 9.1% | ||||
| Cdn. 10-Year Bond CGB yield | 3.29% | 3.38% | (1.5)% | 2.7% | ||||
| Recession Watch Spreads | ||||||||
| U.S. 2-year 10-year Treasury spread | (0.55)% | (0.49)% | (44.1)% | 10.9% | ||||
| Cdn 2-year 10-year CGB spread | (0.76)% | (0.77)% | (20.3)% | (1.3)% | ||||
| Currencies | ||||||||
| US$ Index | 103.27 | 103.98 | 0.8% | 0.7% | down | neutral | up (weak) | |
| Canadian $ | 73.92 | 73.60 | (0.7)% | (0.4)% | neutral | neutral | down | |
| Euro | 107.04 | 107.64 | (1.1)% | 0.6% | up | up (weak) | down (weak) | |
| Swiss Franc | 108.15 | 113.64 | (1.2)% | 5.1% | neutral | neutral | up (weak) | |
| British Pound | 120.96 | 126.50 | (0.5)% | 4.6% | up | up (weak) | down (weak) | |
| Japanese Yen | 76.27 | 69.07 | 1.4% | (9.4)% | up | down (weak) | down | |
| Precious Metals | ||||||||
| Gold | 1,826.20 | 2,014.50 (new highs) | (3.6)% | 10.3% | up | up | up | |
| Silver | 24.04 | 23.28 | (10.0)% | (3.2)% | neutral | up (weak) | up (weak) | |
| Platinum | 1,082.90 | 919.80 | (1.7)% | (15.1)% | up (weak) | down | down | |
| Base Metals | ||||||||
| Palladium | 1,798.00 | 951.60 | (5.8)% | (47.1)% | down | down | down | |
| Copper | 3.81 | 3.83 | (2.5)% | 0.5% | up | neutral | neutral | |
| Energy | ||||||||
| WTI Oil | 80.26 | 71.23 | (3.8)% | (11.3)% | down | down | neutral | |
| Nat Gas | 4.48 | 2.58 | (8.2)% | (42.4)% | down | neutral | down | |
New highs/lows refer to new 52-week highs/lows and, in some cases, all-time highs.
__
(Featured image by PublicDomainPictures via Pixabay)
DISCLAIMER: This article was written by a third party contributor and does not reflect the opinion of Born2Invest, its management, staff or its associates. Please review our disclaimer for more information.
This article may include forward-looking statements. These forward-looking statements generally are identified by the words “believe,” “project,” “estimate,” “become,” “plan,” “will,” and similar expressions. These forward-looking statements involve known and unknown risks as well as uncertainties, including those discussed in the following cautionary statements and elsewhere in this article and on this site. Although the Company may believe that its expectations are based on reasonable assumptions, the actual results that the Company may achieve may differ materially from any forward-looking statements, which reflect the opinions of the management of the Company only as of the date hereof. Additionally, please make sure to read these important disclosures.
Copyright David Chapman
David Chapman is not a registered advisory service and is not an exempt market dealer (EMD) nor a licensed financial advisor. He does not and cannot give individualised market advice. David Chapman has worked in the financial industry for over 40 years including large financial corporations, banks, and investment dealers. The information in this newsletter is intended only for informational and educational purposes. It should not be construed as an offer, a solicitation of an offer or sale of any security. Every effort is made to provide accurate and complete information. However, we cannot guarantee that there will be no errors. We make no claims, promises or guarantees about the accuracy, completeness, or adequacy of the contents of this commentary and expressly disclaim liability for errors and omissions in the contents of this commentary. David Chapman will always use his best efforts to ensure the accuracy and timeliness of all information. The reader assumes all risk when trading in securities and David Chapman advises consulting a licensed professional financial advisor or portfolio manager such as Enriched Investing Incorporated before proceeding with any trade or idea presented in this newsletter. David Chapman may own shares in companies mentioned in this newsletter. Before making an investment, prospective investors should review each security’s offering documents which summarize the objectives, fees, expenses and associated risks. David Chapman shares his ideas and opinions for informational and educational purposes only and expects the reader to perform due diligence before considering a position in any security. That includes consulting with your own licensed professional financial advisor such as Enriched Investing Incorporated. Performance is not guaranteed, values change frequently, and past performance may not be repeated.


Ecobnb Turns Sustainable Tourism Into Measurable Impact
Ecobnb’s sustainable tourism platform generated significant environmental and social impact in 2025, avoiding 58,207 kg of CO₂ and adding 583...


Sugar Markets Balance Biofuel Demand and Global Supply
Sugar markets in New York and London were mostly unchanged as the Iran conflict renewed interest in biofuels. Drought concerns...


The $40 Trillion Trap: Disinflation Is Not Deliverance
U.S. debt has reached $40 trillion, with $24 billion weekly interest, while deficits accelerate. Despite disinflation in CPI, from cooling...


FinTech Matures as AI and Infrastructure Drive the Next Growth Phase
Fintech markets are entering a mature phase, shifting from rapid growth to consolidation, specialization, and sustainable business models. Zurich and...


Bitcoin, and Ethereum Rise, While Cardano Enters Transition
Bitcoin and Ethereum posted modest weekend gains, supported by ETF inflows. A new proposal may protect Bitcoin from quantum threats....
 |
|
 |  |
 |
|
-
 Crypto2 weeks ago
Crypto Markets Shaken by Geopolitics and Industry Tensions
-
 Crypto1 day ago
Bitcoin, and Ethereum Rise, While Cardano Enters Transition
-

 Markets1 week ago
Dow Jones Pauses Near Record Highs as Precious Metals Lead
-

 Fintech5 days ago
Advanced Blockchain Under Pressure Amid Crypto Market Shifts