Featured
Has the market become too bullish too soon?
Our “Chart of Week” looks at the big picture of the U.S. stock market. It can be revealing as to where we are in the long term trend. For the bulls it still looks positive. Gold and the precious metals had a good up week and could be poised to move higher. Setting aside Bitcoin that has been on a tear gold remains the best performing asset in 2020. The U.S. dollar took a hit given the uncertainty in the U.S.
Markets hate uncertainty. But they do like gridlocked politics. Joe Biden has been declared the winner of the 2020 U.S. election after Pennsylvania was awarded to him. This gives Biden a lead of at least 273 to 214 in the Electoral College (EC). If other votes still being tabulated fall into place, then Biden could win the EC 306 to 232. In the popular vote Biden currently holds a lead of over 4 million. The big remaining question is, will President Donald Trump concede or are we to be witness to a long, drag-them-out court fight that could last weeks, even months? A court fight appears to be in the cards. And confirmation from the EC is not until December 14, 2020. Considerable uncertainty remains.
There remains the potential for some turmoil over the presidency and, also with the potential for a gridlocked legislature, the odds of any major changes or stimulus packages are probably off the table, or at least the route to a stimulus is difficult. It could now be left to the Fed to provide the stimulus and the Fed’s stimulus is bond-buying or quantitative easing (QE). Or, as we might say—QE to infinity.
QE to infinity means the stock market should go up and gold should soar. Gridlocked politics is also good for stock markets, based on a study by Yardeni Research that showed divided periods were the best for stock markets. Looking at early results, that is exactly what is happening. The U.S. dollar may not fare too well but bond prices may rise (yields that move inversely to prices would fall). However, the election still has considerable uncertainty on an economic landscape that is already teetering because of the pandemic, even as the jobs report gives rise to some optimism. Globally, the world needs a cooperative approach and reduced confrontation on a wide range of issues including the pandemic, wealth inequality, energy, technology, infrastructure, and the environment. That is probably not going to happen.
While a winner has been declared, there are still court challenges in Arizona, Pennsylvania, Michigan, Georgia, and calls for a recount in Wisconsin along with a probable recount in Georgia. One could come in Pennsylvania as well, given the closeness of the election in that state, despite Pennsylvania being awarded to Biden. The Democrats appear to have a reduced majority in Congress. The Senate is currently deadlocked at 48 each, but if one includes leading and elected, the tally becomes 48 for the Democrats (including two independents) and 50 for the Republicans.
Two seats in Georgia will have to await a runoff vote in early January as nobody has 50%+. If just one of those seats goes to the Republicans, then they would have a Senate majority. But if both seats went to the Democrats, we could have a hung Senate with the decisive vote being the vice president who could be Kamala Harris, Joe Biden’s Democrat running mate. Disputes, recounts, and more will most likely delay any final decision that Biden has won. As well, keep in mind that Trump remains president until the current election is fully decided and the inauguration on January 20, 2021. Trump is not likely to concede even if he loses in court.
Disputed U.S. elections are not new. Lawyers are lined up on both sides. President Trump believes the election will ultimately be decided by the Supreme Court. But vote counting is, in a U.S. election, a state matter whose rights are protected by the U.S. constitution. U.S. states could have until the end of the year if needed. If there are cases of voter fraud, they are decided by the respective state’s Supreme Court. To get to the U.S. Supreme Court is a longer route that could even take us into 2021. There is potentially no easy route in the courts. Already courts in Michigan and Georgia have turned down requests to stop the ballot count. However, disruption and chaos on the street is another matter. There was already considerable disruption and clashes on the street before the election. That is there where things may get out of hand.
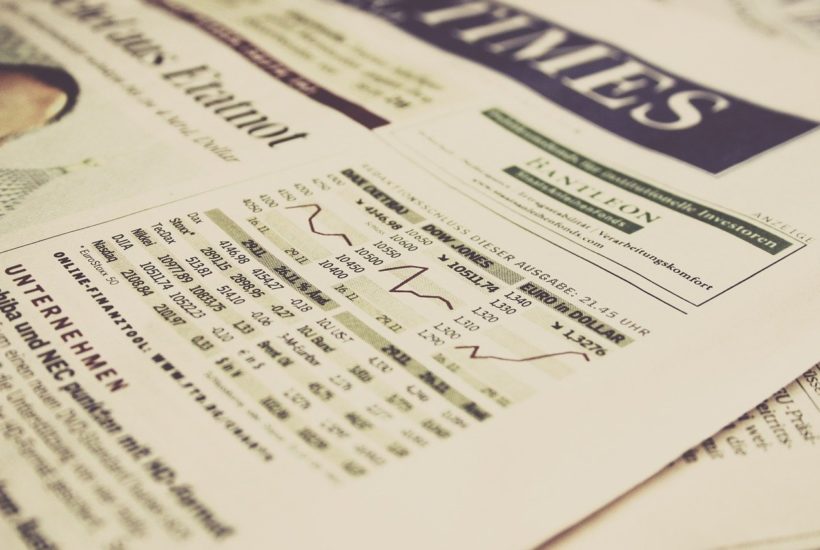
There is a history of disputed U.S. elections. The elections of 1876 (Rutherford Hayes vs. Samuel Tilden), 1888 (Grover Cleveland vs. Benjamin Harrison), 1960 (Richard Nixon vs. John F. Kennedy,) and 2000 (George W. Bush vs. Al Gore) were amongst the most contentious. The most recent was the Bush/Gore election with the controversy over the hanging chads in Florida. It went initially to the Florida Supreme Court that ruled in favour of Gore. But Bush took it to the Supreme Court and, because Congress had set a deadline of December 12, 2000 to choose electors, the Supreme Court ordered a halt to counting, awarding Florida to Bush who won by one electoral college vote even though he had lost the popular by over 500,000 votes. Gore did not pursue it any longer, thus avoiding what could have become a constitutional crisis. But will a constitutional crisis be avoided this time?
Losing the popular vote but still being elected president doesn’t happen often, but has happened on at least five occasions. The ultimate decision-maker in the U.S. election is the Electoral College (EC). The EC is a winner take all (mostly) type of election, so effectively there are really 51 separate elections in the U.S., state by state. Winning a state by even 537 votes as Bush did in 2000 results in 100% of the EC votes being accorded the winner. The five occasions were 1828 (Andrew Jackson vs. John Quincy Adams et al), 1876 (Rutherford Hayes vs. Samuel Tilden), 1888 (Grover Cleveland vs. Benjamin Harrison), 2000 (George W. Bush vs. Al Gore), and 2016 (Donald Trump vs. Hillary Clinton). Note that on three of the occasions—1876, 1888, and 2000—they were also disputed elections.
The only election that we have good data on for the stock market and gold is the disputed 2000 election. The election was on November 7, 2000 and the Supreme Court ended the process on December 12, 2000. The uncertainty caused by the dispute did see the stock market (S&P 500) fall by 4.3% between November 7 and December 12 while gold rose 2.9%. Given early returns, we note that gold is up 1.9% so far, while the S&P 500 has gained 3.9%. More QE, it seems, “trumps” election uncertainty. But will the thought that QE is sufficient to propel markets higher be enough? Will the Fed accommodate the market?
The Fed is clearly concerned as they can only do so much. The Fed doesn’t send out stimulus cheques. The Fed has already cut rates to zero. And more QE may only have a marginal impact even if it does “goose” the stock market. The Fed has warned about the negative consequences of a failure to come up with a stimulus plan to the economy. But with the potential for a dragged-out, disputed election and a split Congress and Senate, the odds of a stimulus plan have fallen sharply. And then thoughts of tax hikes and ambitious spending plans may also be on hold. No stimulus, or at least a delayed stimulus potentially translates into more bankruptcies, more layoffs, more homelessness, and more social unrest.
Despite signs that Joe Biden has won the presidency, disputes threaten to drag the drama out for days, weeks, and even months before we have a final decision. The Fed will have to step into the breach, given a deadlocked U.S. legislature. Put that all together and gold and even the stock market could both move higher into year end. That’s good for Wall Street, but it spells uncertainty for Main Street.
S&P 500 and Gold June 2000 to June 2001
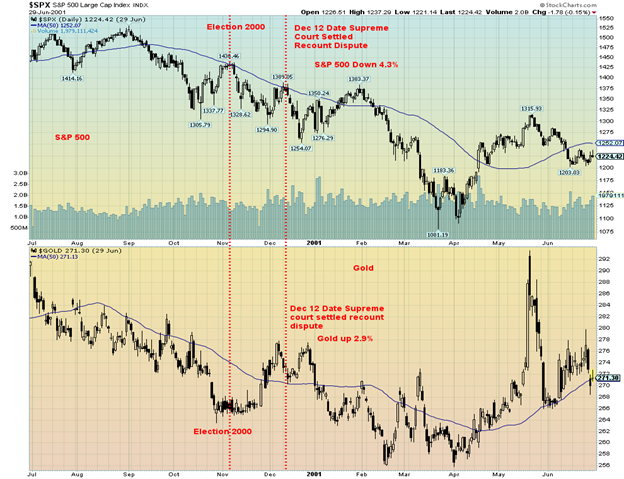
Chart of the Week
This is the best picture that shows that stocks really do go up forever. Okay, there are also periods where they don’t go up. We started the big up wave that is still underway from the 1949 low. Many start it from the 1932 low, but we believe that a corrective ABCDE-type pattern unfolded during the Great Depression and war years. That has been labeled as Wave IV, dating back to the beginning of the stock markets in the late 18th century. We show the really long-term chart below.
The first wave (1) up from the 1949 low lasted 17 years and saw the DJI gain 816 points or 489%. The second wave (2) lasted 16 years and saw the DJI correct 38% from the high in 1966 to the lowest low in 1974. Altogether, the DJI lost 375 points. Wave 3 up lasted from 1982 to 2000 or 18 years, as the DJI gained 10,688 points or 1,322%. Third waves up are usually the most powerful in a long-term 5-wave advance. Wave 4 lasted from 2000 to 2009 or nine years and saw the DJI lose 4,434 points into the 2009 low or about 39%. Wave 5 is currently underway and has thus far lasted 11 years and seen the DJI gain 21,475 points or 304%. If wave 5 is to equal the time of waves 1 and 3, it suggests we could have about six more years of a bull market. If Wave 5 is to equal Wave 1 in terms of return, then this current wave up still has further to rise. Wave 1 and Wave 5 are often equal.
Wave 3 was just over 13 times Wave 1 and Wave 5 so far is just over double Wave 3. So, a fifth wave that ends up being three times Wave 3 (points, not percentage return) would not be unusual. That would put a final high up around 40,000 DJI. However, at the moment the DJI has overthrown once again the 75% prediction band. So, a corrective period is not out of the question at this time. However, to keep the long-term bull alive, the DJI should not fall any further than that central line which could be around 15,000. The final reality may see the DJI not fall even that far. More likely is no more than 8,200 points or double the decline during the 2000–2009 bear which would put a bear market low down around 20,000. That level would be just below the low we saw in March 2020. That gives rise to what we call an ABC flat correction.

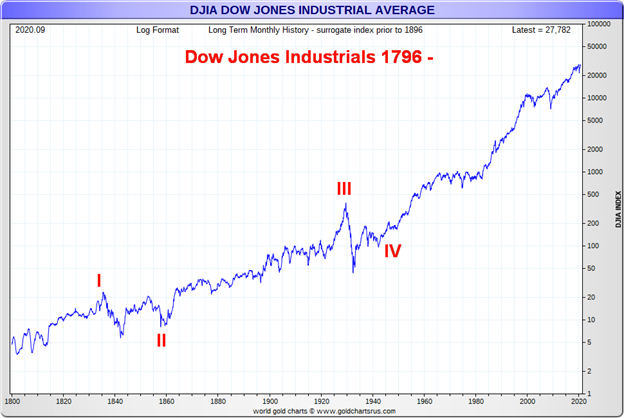
The really long-term chart from the late 18th century shows five very distinct waves to the upside. The first wave topped out in 1835 with the final low coming in 1857. This was the period that saw both the Panic of 1837 and the Panic of 1857. Both resulted in steep declines in the stock markets along with a depression in the 1840s known as the “Hungry Forties” and a very steep recession in 1857–1858 that was one of the causes of the U.S. Civil War.
Out of the U.S. Civil War, another long wave to the upside got underway even as it was interrupted by the Panic of 1873 and what became known as the Long Depression. As well, there were financial panics in 1893, 1896, 1907, 1910, and a very steep depression following World War I and the Spanish Flu pandemic in 1920–1921. The wave culminated in the “Roaring Twenties” and a stock market bubble (Wave III) followed by the Panic of 1929 stock market crash and the Great Depression. Wave IV was the Great Depression and World War II.
Wave 5 has also seen its share of panics and stock market bubbles. The steepest declines were the 1973-1974 oil crisis, the Panic of 1987, the high-tech/dot.com stock market bubble of the 1990s, and the Financial Panic of 2008. Out of the Great Recession of 2007–2009 we have, so far, been riding the wave of QE and ultra-low interest rates that lasted until the Pandemic Panic of March 2020. Since then, we wonder whether we are in the throes of another big up wave, once again driven by QE and ultra-low interest rates along with massive stimulus to combat the pandemic. The question is, when and how will this one end? But one thing is clear: Wave 5 is still in progress despite the interruption of the Panic of 2020.
The U.S. Job Numbers

The October U.S. nonfarm payrolls came in somewhat better than expected at 638,000 vs. an expectation of 600,000 and a revised September nonfarm payroll of 672,000. The unemployment rate (U3) fell to 6.9% from 7.9%. That too was much better than the expected 7.7%. The Bureau of Labour Statistics (BLS) also reported the U6 unemployment rate at 12.1% vs. 12.8% in September. U6 is the BLS’s broadest unemployment measure, including short-term discouraged workers plus other marginally attached workers as well as those forced to work part-time because they can’t find full-time employment. Shadow Stats (www.shadowstats.com) reports their broadest unemployment measure at 26.3% vs. 26.9% in September. The Shadow Stats number is U6 plus long-term discouraged workers who were largely defined out of the labour force in 1994.
Private sector nonfarm grew by 906,000 as government nonfarm fell 268,000. Of that total, 271,000 were in the category of leisure hospitality with 192,000 in drinking and food services. The question is, how sustainable is this with COVID-19 rising sharply in the U.S. and colder weather coming? The vast majority of jobs came from those with a high school diploma or less. Those with a BA or better actually fell. The labour force participation rate rose to 61.7% from 61.4% while the employment population ratio was also higher at 57.4%, up from 56.6%. Those reported as not in the labour force slipped slightly to 100,058 thousand vs. 100,599 thousand. Of that total, 64,878 thousand are either retired or disabled.
The U.S. lost 21.2 million jobs in March and April and has now gained back 12.3 million or 58% of the total lost. One item that rose was average weeks unemployed which rose to 21.2 weeks from 20.7 weeks. The total number unemployed for 27 weeks or more rose to 3,556 thousand, up from 2,405 thousand in September. The total unemployed rose to 12,504 thousand but the actual unemployed is 19,428 thousand because many of the unemployed are not eligible for benefits. The number of persons working part-time rose to 26,163 thousand up from 25,161 thousand.
The BLS once again acknowledged the headline unemployment rate (U3) was understated for the eighth straight month. A total of 562,000 persons were listed as employed that should have been listed as unemployed. That would have hiked the U3 rate to 7.2% up from 6.9%. Overall, there is nothing in this report to suggest a huge recovery and if that is the case then the recovery, such as it is, continues to be more an L or, as we have described it, a K recovery with Main Street remaining down even as Wall Street celebrates the rise in the stock market.
Canada Job Numbers
Canada Unemployment Rate

Statistics Canada (www.statcan.gc.ca) reported that the employment increased by 83,600 in October. The market had expected a rise of at least 100,000. The gain in September was 378,200. Surprisingly, most of the gain came in full-time employment, up 69,000. Surprisingly as well there was a decline of 48,000 jobs in accommodation and food services, primarily in Quebec. Canada lost 3.0 million jobs in March and April and, so far, they have recouped 2.4 million or almost 80% of them. The unemployment rate 8.9% was virtually unchanged from September’s 9.0% rate. The R8 rate which includes discouraged workers, and involuntary part-timers slipped to 11.0% from 11.2%. The labour force participation rate was 65.2% vs. 65.0%. The number unemployed was little changed at 1,816.8 thousand vs. 1,832.6 thousand. There were 826,000 workers working part-time who wanted full-time work. That’s up 5.6% from a year ago. There remained 540,000 who wanted work but were very discouraged and didn’t search. More than half the long-term unemployed report that they are living in households that are having considerable problems meeting expenses. The long-term unemployed number stands at 448,000, making up roughly ¼% of all the unemployed. All these numbers have exceeded peaks seen during the 2008–2009 financial crisis.
MARKETS AND TRENDS
| % Gains (Losses) Trends | ||||||||
| Close Dec 31/19 | Close Nov 6/20 | Week | YTD | Daily (Short Term) | Weekly (Intermediate) | Monthly (Long Term) | ||
| Stock Market Indices | ||||||||
| S&P 500 | 3,230.78 | 3,509.44 | 7.3% | 8.6% | up | up | up | |
| Dow Jones Industrials | 28,645.26 | 28,323.40 | 6.9% | (0.8)% | up | up | up | |
| Dow Jones Transports | 10,936.70 | 11,614.65 | 4.6% | 6.5% | up | up | up | |
| NASDAQ | 9,006.62 | 11,895.23 | 9.0% | 32.6% | up | up | up | |
| S&P/TSX Composite | 17,063.53 | 16,282.83 | 4.5% | (4.6)% | up (weak) | neutral | neutral | |
| S&P/TSX Venture (CDNX) | 577.54 | 742.29 | 8.6% | 28.5% | up | up | up (weak) | |
| S&P 600 | 1,021.18 | 925.22 | 5.6% | (9.4)% | up | up (weak) | neutral | |
| MSCI World Index | 2,033.60 | 1,920.85 | 8.0% | (5.5)% | up | up | neutral | |
| NYSE Bitcoin Index | 7,255.46 | 15,485.04 (new highs) | 16.1% | 113.4% | up | up | up | |
| Gold Mining Stock Indices | ||||||||
| Gold Bugs Index (HUI) | 241.94 | 346.08 | 10.0% | 43.0% | up | up | up | |
| TSX Gold Index (TGD) | 261.30 | 376.30 | 7.5% | 44.0% | up | up | up | |
| Fixed Income Yields/Spreads | ||||||||
| U.S. 10-Year Treasury yield | 1.92 | 0.83 | (4.6)% | (56.8)% | ||||
| Cdn. 10-Year Bond yield | 1.70 | 0.65 | (3.0)% | (61.8)% | ||||
| Recession Watch Spreads | ||||||||
| U.S. 2-year 10-year Treasury spread | 0.34 | 0.68 | (4.2)% | 100.0% | ||||
| Cdn 2-year 10-year CGB spread | 0 | 0.38 | (2.6)% | 3,800.0% | ||||
| Currencies | ||||||||
| US$ Index | 96.06 | 92.22 | (1.9)% | (4.0)% | down | down | down | |
| Canadian $ | 0.7710 | 0.7680 | 2.3% | (0.3)% | up | up | neutral | |
| Euro | 112.12 | 118.80 | 2.0% | 5.9% | up | up | up | |
| Swiss Franc | 103.44 | 111.04 (new highs) | 1.8% | 7.4% | up | up | up | |
| British Pound | 132.59 | 131.57 | 1.5% | (0.7)% | up | up | neutral | |
| Japanese Yen | 92.02 | 96.82 | 1.4% | 5.2% | up | up | up | |
| Precious Metals | ||||||||
| Gold | 1,523.10 | 1,951.70 | 3.8% | 28.1% | up | up | up | |
| Silver | 17.92 | 25.66 | 8.5% | 43.2% | up | up | up | |
| Platinum | 977.80 | 899.40 | 6.0 | (8.0)% | up (weak) | neutral | neutral | |
| Base Metals | ||||||||
| Palladium | 1,909.30 | 2,500.00 | 12.8% | 30.9% | up | up | up | |
| Copper | 2.797 | 3.15 | 3.3% | 12.6% | up | up | up | |
| Energy | ||||||||
| WTI Oil | 61.06 | 37.14 | 3.8% | (39.2)% | down | neutral | down | |
| Natural Gas | 2.19 | 2.89 | (13.7)% | 32.0% | up | up | up |
Note: For an explanation of the trends, see the glossary at the end of this article.
New highs/lows refer to new 52-week highs/lows.

What a week. The election, the Fed, and the job numbers. The stock market appeared to not be phased by the possibility of a Biden victory (which happened) because the view was that it meant more stimulus. And stock markets like stimulus. And, while it is still to be determined, the Republicans could still maintain control of the Senate. However, that will remain unknown until January when the two Senate seats in Georgia have to go into a run-off. The Republicans would have to win at least one of them and then they would have 51 Senate seats to the Democrats 49. Lose both and the Senate is tied 50-50 with Vice President-elect Kamala Harris having the tie-breaking vote.
A compromised legislature with the Republicans controlling the Senate would mean things like tax hikes would have difficulty passing. And that could translate into gridlock, which the stock market likes. The Fed is committed to its bond buying program (QE) and interest rates will remain at zero into 2023. With Biden now the confirmed winner (subject to all the lawsuits to be launched by Trump and confirmation by the electoral college on December 14, 2020) and the potential for a deadlocked Senate, the stock market might wobble this coming week.
The S&P 500 gained 7.3% this past week. That puts the S&P 500 into the black by 8.6% on the year. The Dow Jones Industrials (DJI) was up 6.9% but remains down on the year by 0.8%. The Dow Jones Transportations (DJT) gained 4.6% while the NASDAQ was up 9.0%. The small cap S&P 600 rose a feeble 4.5%. Elsewhere, the TSX Composite was up 4.5% and the TSX Venture Exchange (CDNX) gained 8.6%. The MSCI World Index rose 8.0% and Bitcoin continued to soar up 16.1% to new 52-week highs. In the EU, the London FTSE was up 5.9%, the Paris CAC 40 jumped 8.0%, and the German DAX was also up 8.0%. In Asia, China’s Shanghai Index (SSEC) was up 2.7% and the big star was the Tokyo Nikkei Dow (TKN), up 5.9% to fresh 52-week highs.
With the gain this week, the charts that looked like they were breaking down a week ago have taken on a new look. Instead of falling, they could actually rise. When the markets fell a week or two ago, they left gaps on the charts. These gaps have now been filled. This raises the possibility of new highs ahead. But then again, maybe not.
Why? Breadth was not very impressive on this rally. The NYSE advance/decline line remains shy of its recent highs. Generally, for the S&P 500 only about 47% of the issues were advancing. On Friday, the NASDAQ closed higher but the DJI, the DJT, and the S&P 500 all closed lower. The rebound this past week was also on reduced volume. All these are signs that the rally this past week did not have much “oomph” behind it. Naturally, we won’t find out until Monday’s market. That will determine whether this rally is just a “head fake” or whether it does have real legs. Given the big rise since March, the signs are not positive that the market should continue higher. And, given the potential for major litigation from Trump challenging the Biden victory, it could put a degree of uncertainty into the market. And stock markets hate uncertainty.
It will be interesting to see how the stock market performs between now and inauguration day January 20, 2021. Generally, if the market falls during this period it could translate into a rocky 4-year presidency. And generally, the first year of any presidency is also the weakest of the four years for the stock market. Given the potential for major litigation by Trump, the key will be how it fares in the courts. So far, the Trump team has not fared well in the courts; however, that could change, especially if they can prove some of their claims. If they can’t, the courts will quickly dismiss them.
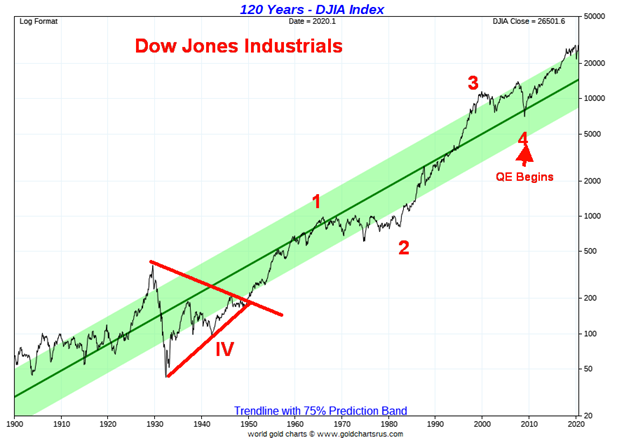
To the upside, the old high remains the final barrier. It is possible we could be creating what we call three thrusts to a high. Usually it translates into three successive highs, each one barely above the other. In this case, the last high on October 12 did not exceed the high of September 2. That doesn’t eliminate new highs again above the September 2 high of 3,588, but any new thrust shouldn’t be more than 3% above that high or a rise to about 3,700. We note the trend line drawn from the February 2020 high to the September 2 high and it currently comes in at about 3,670. If we can’t break over that line, the market could fail.
The downside break is then at the recent lows 3,234. A breakdown under that level sets up a decline to about 3,000. A breakdown under 3,000 would see the S&P 500 enter a serious bear market.
The story is the same with the DJI. The DJI is approaching resistance just above at 28,850 and there is further resistance up to 29,600. Remember, the DJI has so far diverged with the DJT and also with the S&P 500 and the NASDAQ in that they all made new all-time highs on this up move but the DJI did not. That is a significant divergence. While the divergence has not been confirmed, it remains until the DJI joins them and makes new all-time highs. Any breakdown under the recent low at 26,144 would be terminal.

The NASDAQ, like the other indices, has rallied right back to a resistance line joining the two recent highs seen on September 2 and October 12. On Friday the NASDAQ managed to eke out a small gain, diverging with the other indices who all closed lower. A number of the key high-tech stocks that have led this market enjoyed a good week as well. Facebook was up 11.5%, Apple gained 9.0%, Amazon 9.1%, Netflix +8.2%, Google +8.7% and new all-time highs, and Microsoft +10.5%. Tesla gained 10.8% while Berkshire Hathaway was up a feebler 3.8%. Our assessment here is the same as the others. The NASDAQ needs to break through to new highs. Any return that takes the NASDAQ back under 11,300 would be negative and suggest that it is headed lower.
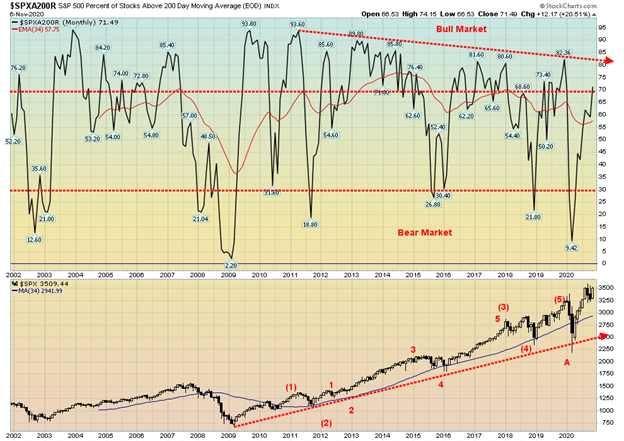
The percent of stocks trading over their 200-day MA is now just over 70%. This is the best level seen since the high in September 2018. Still, it is a divergence as the S&P 500 is higher than it was in 2018 while the indicator is lower. Despite the strong rally, especially since March 2020, the percentage of stocks over their 200-day MA is still only 70%.

We were quite surprised that, given the rally this past week, the CBOE put/call ratio plunged to new lows at 0.41. This suggests that calls are overwhelming puts and indicates a high level of complacency in the market. This is not a positive scenario for the stock market rising further as the put/call ratio is suggesting that everyone has already bought. We are wary.

The VIX Volatility Index has fallen back to 25, not far from its low seen at the recent S&P 500 top in February. While it has changed the potential head and shoulders pattern, the pattern developing still appears be positive for the VIX and negative for the S&P 500. Naturally, that remains to be seen but it does suggest a high degree of complacency.

The TSX Composite joined the party this week with a gain of 4.5%. The TSX Venture Exchange (CDNX) was also victorious, rising 8.6%. The CDNX is now up 28.5% on the year while the TSX remains down on the year by 4.6%. All 14 TSX sub-indices were up on the week led by Health Care (THC), up 12.8%. Big gains were seen in a number of indices: Information Technology (TKK) +9.3%, Golds (TGD) +7.5%, Metals & Mining (TGM) +6.6%, Materials (TMT) +5.8%, Consumer Staples (TCS) +5.8%, Industrials (TIN) +5.5%, and Consumer Discretionary (TCD) +5.1%. Despite the gains, six of the 14 sub-indices remain down on the year, led by Energy (TEN) -54.9%. Leading the upward charge is Information Technology (TKK) +42.2% and Golds (TGD) +44.0%. The biggest components of the TSX are, however, Financials (TFS) down 14.7% in 2020, Materials (TMT) +29.1%, and Energy (TEN) down 54.9%. Between Financials and Energy, they have dragged the TSX into negative territory for the year. The three make up 56.2% of the Composite.
The TSX has rallied back to a downtrend line. The question is, will it break over the line? A break over 16,500 would confirm that the TSX is probably going higher. A move above that level would also suggest that the TSX could make new highs. With the recent low at 15,418, that is the line in the sand. A breakdown under that level would send the composite lower, potentially targeting down to 14,250. At best, the TSX is in a weak uptrend. But it is choosing the right sub-indices to be in that is key. Golds, Materials, Metals, and Technology remain the best choices and have been the best performers.

Is it a bird? Is it a plane? No, it’s Bitcoin! Bitcoin is soaring. Bitcoin rose 16.1% this past week to fresh 52-week highs. Bitcoin is the best-performing asset in 2020, up 113.4% on the year (sorry gold). The trouble with Bitcoin is, despite the big rise in 2020, Bitcoin would only be about the 18th largest company by market cap in the U.S. Bitcoin currently has a market cap of $285.3 billion. The entire cryptocurrency market has a market cap of $443.2 billion. That would move the cryptocurrency market into 8th place amongst U.S. corporations. Bitcoin represents 64% of the entire cryptocurrency market.
It’s hard to believe, but Coin Market Cap (www.coinmarketcap.com) still lists 7,600 cryptocurrencies. Of those, 22 have a market cap of $1 billion or higher. Altogether, the 22 large cryptos represent 92% of the cryptocurrency market by market cap. Doesn’t leave a lot for the remaining 7,578.
The chart shows Bitcoin from 2015. It includes the remarkable historic blow-off bubble into December 2017. Bitcoin rose on that chart by 7,800% from May 2015. That’s more than the Tulip Bubble of 1637, the gold and silver bubble of 1979, the Roaring Twenties stock market bubble, or the Japanese stock market bubble of the 1980s. The fall into December 2018 was about 83%. That is shy of the 89% the DJI lost from 1929 to 1932. We have considered the action since December 2018 to be corrective. Bitcoin appears to be unfolding in a large ABC pattern with the A and B waves complete. We are currently on the C wave. These types of waves could in theory see Bitcoin make new all-time highs. Bitcoin has now surpassed the level which might suggest new all-time highs lie ahead. Once this up wave is complete, Bitcoin could have another historic collapse.

COVID-19 cases are soaring. We broke through 500,000 cases daily and are now getting over 600,000 cases a day, every day. Deaths are also rising, but the death/cases ratio is lower today than it was at the outset of the pandemic. Cases are averaging roughly 525,000 every day. If that is maintained, that puts us on pace for another 29 million cases by year end, bringing the total to about 80 million globally. We have now passed 50 million cases. Deaths are on pace for an additional 400,000+ by year end, bringing the total to about 1.7 million world-wide. The death/cases ratio which was around 3% in the first go-around in the spring has fallen to roughly 2.5%. But the current pace is roughly 1.4% which is a big improvement, thanks to better care. In terms of where the cases are, Asia leads with over 14 million, followed by North America with about 12 million. Europe is over 11 million while South America is roughly 10 million. Africa remains small with under 2 million cases. The U.S. leads the way with over 10 million cases, followed by India at about 8.5 million cases and Brazil at 5.6 million. The U.S. leads in deaths as well with over 240,000, followed by Brazil over 160,000 and India with over 125,000. Not a pretty picture. Could we see daily cases of a million? It is certainly possible.
COVID-19 Coronavirus Pandemic – November 8, 2020 16:34 GMT
Number of Cases: 50,505,413
Number of Deaths: 1,259,310

U.S. cases have soared as over 100,000 cases are being recorded almost every day now. Cases in Texas have soared to over one million and California and Florida are not far behind. In terms of deaths, New York still leads the way but their pace has slowed considerably. Texas is now leading the way in terms of new deaths. The U.S. death/cases ratio is around 2.5%, but, again, as it is globally the current rate has fallen to about 1%. That is still sharply higher than the common flu whose death/cases ratio is around 0.1%. If the world is headed for a million cases in a day, the U.S. could be on its way to 200,000 cases in a day. The rise is that steep. The U.S. is on pace for 400,000 deaths by February 1, 2021, but if the opening of the economy continues at its current pace, the number of deaths may approach 600,000 by the same date.
COVID-19 Coronavirus Pandemic – November 8, 2020 16:34 GMT
Number of Cases: 10,196,998
Number of Deaths: 243,343

Canada is not immune to the rise in the number of cases and deaths. Canada is now recording over 3,000 cases every day and is rising towards 4,000 cases per day. Deaths remain low, averaging lately around 47/day. That’s a current ratio of around 1.4% deaths/cases. Canada’s death rate is down sharply from what was seen in the first wave in March through May. Still, the rise is alarming. Canada has maintained its position as 31st in the world in terms of cases but is 22nd in terms of deaths, thanks primarily to a high total in the first wave.
COVID-19 Coronavirus Pandemic – November 8, 2020 16:34 GMT
Number of Cases: 261,383
Number of Deaths: 10,503
US 10-Year Treasury Note, Canada 10-Year Government Bond (CGB)

Given the potential for a dragged-out conflict over a Biden presidency from the Trump camp and the rising COVID cases that could weigh on the economy, bond yields fell this past week (yields fell, prices that move inversely to yields rose). Some better than expected economic numbers didn’t help push bond yields up this past week. The U.S. 10-year treasury note fell 4.6% on the week or 4 bp. The Government of Canada 10-year bond (CGB) also fell down 2 bp or 3.0%. Economic numbers of note this past week included the manufacturing PMI that came in at 53.4, marginally better than the expected 53.3; construction spending rose 0.3% in October vs. an expectation of a 0.1% gain; the New York ISM index was 65.1 vs. an expectation of 54.5; ADP employment for October was 365,000 vs. an expectation of 650,000 (one of the few misses); the September trade deficit was $63.9 billion vs. expectation of $63.8 billion; weekly jobless claims were 751,000 vs an expectation of 732,000; and, as previously noted, the nonfarm payrolls were up 638,000 vs. an expectation of a rise of 600,000. For the most part the economic numbers were higher. The trade deficit numbers hit a record $1,085 billion in Q3. Ten-year yields remain just below potential breakout zones. We’d like to see the 10-year break above 0.90% to suggest a move to 1.00% or higher. If it can’t break above that ceiling then yields are not going anywhere.

Is the U.S. dollar now headed into the abyss? This week’s reversal and plunge may be a sign of big trouble for the U.S. dollar. The US$ Index fell 1.9% on the week while other currencies rose against the U.S. dollar. The Cdn$ was up 2.3%, the euro up 2.0%, Swiss franc up 1.8%, pound sterling up 1.5%, and Japanese yen up 1.4%. Bucking the trend was the Chinese yuan which fell 0.5% against the U.S. dollar. The yuan is not a component in the US$ Index. The US$ Index failed at the falling 100-day MA and is now threatening to break down under the recent low at 91.75. The fall in the US$ Index is already suggesting we could soon see new lows below 91.75. The US$ Index has the potential to fall to 88.70 once new lows are seen. The Biden presidency, the sharply rising coronavirus cases, the potential for violence following the election of Biden, and the potential for court conflicts from Trump over the presidency all weighed on the U.S. dollar this past week. Not even some slightly better than expected economic numbers helped it. Only regaining above 93.35 might end this downswing.

A collapsing U.S. dollar and the potential for a Democrat presidency which could be positive for a large stimulus helped propel gold to a gain of $72 or 3.8% on the week. Silver rose 8.5% and platinum was up 6.0%. Of the near precious metals that are also industrial metals, palladium rose 12.8% and copper was up 3.3%. All in all, a good week for gold and the precious metals. Gold was driven higher by a sharply falling U.S. dollar, a Biden victory which could translate into more stimulus, the uncertainty surrounding the presidency given lawsuits being launched by Trump, and the sharply rising COVID numbers. Gold is considered a hedge against inflation/deflation, currency debasement, economic uncertainty, and political turmoil. Gold rose in all currencies this past week with gold in Cdn$ up 1.6%, gold in euros up 2.0%, gold in pound sterling up 2.1%, gold in Swiss francs up 1.9%, and gold in Japanese yen up 2.5%. Gold broke out of a down-sloping trendline at roughly $1,920. Next, gold needs to clear $1,950 and $2,000. Above $2,035, new highs above $2,089 are highly probable. If gold were to fall back under $1,900 it would be a negative. The breakdown point would be at $1,860 and confirmed with a break down under $1,825. This scenario is now less likely following this week’s breakout. Interest rates are to be held at zero into 2023 and the odds of even the 10-year U.S. treasury note rising too high are low. Gold remains a positive alternative asset, negatively correlated to both stocks and bonds. Gold is up 28% on the year and, setting aside the big gain by Bitcoin, gold is the best-performing asset this year.

The gold commercial COT slipped this past week to 21% from 22%. Long open interest fell about 6,000 contracts while short open interest also fell down over 12,000 contracts. Open interest fell about 16,000 contracts on an up week. But this report only goes to November 3 so it did not capture the strong move in the latter part of the week following the election. The large speculators COT (hedge funds, managed futures, etc.) also slipped to 80% from 81%. It too saw a decline in long open interest but a slight rise in short open interest. The COT report remains somewhat bearish.

The weak U.S. dollar, the coronavirus, and the election also helped propel silver higher this past week. Silver leaped 8.5% to $25.66. Clearing $25 was an important hurdle. The next hurdle is $26. Above $28 new highs become more likely. Based on the August high of $29.92 and the September low of $21.81 potential targets could be at minimum $32.50 and as high as $38.00. Silver is now up 43% on the year. Silver’s rise is premised similar to gold. In a strong gold bull, silver tends to lead and outperform. The gold/silver ratio is currently at 76 above its recent low of 68.60. A breakdown under 70 and new lows below 68.60 could target the gold/silver ratio down to 57.25. All things being equal, that would mean a silver price of $34 with gold holding steady at its current level of $1952. Silver broke out of a multi-year basing pattern in July 2020. We have previously noted that the breakout implied a move for silver up to around $65.

The silver commercial COT slipped to 31% this past week from 32%. Long open interest fell about 3,000 contracts while short open interest also fell but only just over 2,000 contracts. Overall, open interest fell about 7,000 contracts on a strong up week. But remember that this report only goes to November 3, so the best part of this week’s advance wasn’t captured. That’s next week. The large speculators COT rose to 73% from 71%. Overall, the silver COT remains mildly bearish.

Gold stocks enjoyed a strong up week and are on the verge of breaking out to new highs. This past week the TSX Gold Index (TGD) gained 7.5% while the Gold Bugs Index (HUI) did even better up 10%. There was a strong up week for Gold Fields (GFI) and AngloGold Ashanti (AU), two stocks in the HUI, not in the TGD. The TGD broke through one line of resistance at 360 and closed just under the next key break point at 380. Once through 380, the next focus would be for a close above 400. Above 400, new highs are probable. What’s key now is for the TGD to remain above 360 on a close basis. A breakdown under 340 would turn the TGD to the downside. But, given the strong up move this past by both gold and silver, the odds favour the TGD testing to 400 and higher and eventually put in new highs. The TGD appears to have made an ABCDE-type correction from the July high at 417. The TGD may also have completed a 5-wave advance from the March 2020 low to the peak in July. That’s a little harder as the advance might also have been an ABC pattern for completion of an (A) wave up. The recent correction is the (B) wave and now we will see the (C) wave. If that’s correct, in theory we could rise as high as 580 as a minimum on this advance. At that point the (C) wave would equal the (A) wave. Irrespective of this, the TGD appears poised for an advance and it could be a strong one.
The world is focused on the U.S. election, but oil is focused on the rising COVID-19 numbers. While oil prices improved this past week with WTI oil rising 3.8%, prices remained under $40. Natural gas (NG) prices came off their recent run-up, losing 46 cents on the week and falling 13.7%. The energy indices managed to rise, but how much of it was because of the small rise in oil prices and how much of it was due to positive sentiment in the market? The ARCA Oil & Gas Index (XOI) was up 2.1% on the week while the TSX Energy Index (TEN) rose 2.8%.
Some of the chatter in the energy markets is: how will a Biden presidency impact the energy sector? If a divided government remains in place, the Biden administration may not be able to implement much of their green plan. Still, Biden has the power of executive authority, something used extensively by Trump and even Obama before him. Executive authority could cancel Keystone, put the U.S. back in the Paris Climate agreement, and even cancel the Dakota Access Pipeline. It could also slow or stop drilling in Alaska and reinstate methane regulations on drilling. These were all items that Trump used executive authority on. If the Democrats were to win the two seats in Georgia, then the Senate would be tied 50/50 and the deciding vote would fall to Kamala Harris as vice president. That could help push through green legislation that requires Congress and Senate approval.
But it is COVID that is playing havoc with demand as lockdowns take place through Europe. On the other hand, OPEC plus Russia seem to be hesitating now as to whether they will abandon production cuts. So that is a positive for oil prices. Oil prices hit as low as $33.64 this past week but rebounded into the end of the week. We don’t know whether our trading band is just widening or whether the breakdown the previous week was the start of a new drop. With the bounce-back, it keeps intact the potential for a widening range. The top of the channel is up around $45 with the bottom of the channel around $32.50. Stocks, however, remain in their downtrend and we don’t expect that to change despite periodic rallies. But if the XOI were to regain back above 600 and especially above 700, a new up move would be underway.
—
(Featured image by markusspiske via Pixabay)
DISCLAIMER: This article was written by a third party contributor and does not reflect the opinion of Born2Invest, its management, staff or its associates. Please review our disclaimer for more information.
This article may include forward-looking statements. These forward-looking statements generally are identified by the words “believe,” “project,” “estimate,” “become,” “plan,” “will,” and similar expressions. These forward-looking statements involve known and unknown risks as well as uncertainties, including those discussed in the following cautionary statements and elsewhere in this article and on this site. Although the Company may believe that its expectations are based on reasonable assumptions, the actual results that the Company may achieve may differ materially from any forward-looking statements, which reflect the opinions of the management of the Company only as of the date hereof. Additionally, please make sure to read these important disclosures.


The TopRanked.io Weekly Affiliate Marketing Digest [The Top VPN Affiliate Programs Roundup]
Want to be let in on a little secret about two massive affiliate opportunities you can take advantage of today?...


Sustainable Finance Faces Hurdles as Green Asset Ratio Reforms Fall Short of Full Transparency
The Green Asset Ratio (GAR) measures banks' alignment with the EU Taxonomy but remains low due to methodological flaws and...


XRP Hits New All-Time High Amid U.S. Crypto Policy Shift and Ripple’s Expansion
XRP surged past its 2018 all-time high, reaching $3.65 amid renewed political support for crypto in the U.S. under Trump....


Germany Moves to Curb Medical Cannabis Abuse, Sparking Access Concerns
Medical cannabis imports in Germany have surged, but health insurance-covered prescriptions remain low. Easy online access raises concerns about abuse...


JPMorgan’s Data Fees Shake Fintech: PayPal Takes a Hit
JPMorgan Chase will charge fintechs for customer data, threatening business models reliant on free access. PayPal’s stock plunged 5.7% after...
 |
|
 |  |
 |
|
-

 Biotech4 days ago
Advancing Sarcoma Treatment: CAR-T Cell Therapy Offers Hope for Rare Tumors
-

 Impact Investing2 weeks ago
Shein Fined €40 Million in France for Misleading Discounts and False Environmental Claims
-

 Impact Investing1 day ago
Nidec Conversion Unveils 2025–2028 ESG Plan to Drive Sustainable Transformation
-

 Impact Investing1 week ago
Vernazza Autogru Secures €5M Green Loan to Drive Sustainable Innovation in Heavy Transport