Featured
Inflation Continues to Rear Its Ugly Head Even as It Appears to Be Coming Down
Oil prices (along with all commodities) have played a role in inflation particularly over the past 75 years. We show how rising and falling oil prices has an impact on inflation. Gold too appears to follow the same pattern and we compare gold with inflation. Rising oil and gold (commodities) are long associated with rising inflation and when they fall inflation falls too.

Inflation. It’s been around with us forever. Quite simply, inflation is the rate at which prices rise and, on the other side, the rate at which purchasing power falls. Something that cost $100 in 1980 costs $365 today (using the Bank of Canada inflation calculator). Economists talk about two types of inflation: demand-pull, when rising demand exceeds supply, and cost-push, when prices rise to cover higher supply prices and to maintain profit margins. What they rarely talk about is deflation. That’s when prices are falling due to falling demand and is often accompanied by a contraction in money supply and tightening credit conditions.
Gently rising inflation is good. Rapidly rising inflation is bad. Rapidly falling inflation, including negative inflation, could be good or bad. For years we had gently rising inflation. Think the period of 2010–2020 or the period from 1983–2000. Those periods were also accompanied generally by ultra-low interest rates, rising money supply, and easy credit. Stock markets, housing markets, indeed, all assets benefitted and prices rose. We moved from price inflation to asset inflation. Then inflation rose, interest rates rose, money supply contracted, and credit became more difficult to get. The result was, stock markets fell and housing prices fell.
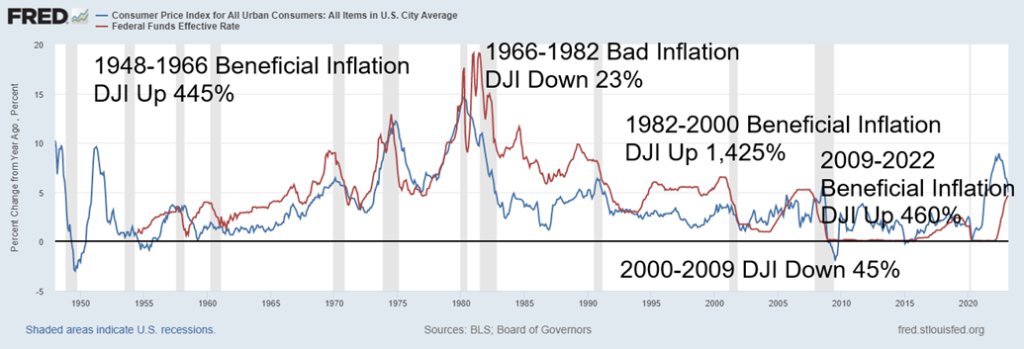
Our chart below outlines how the stock market fared (represented by the Dow Jones Industrials (DJI)) during periods of beneficial inflation and periods of bad inflation. Beneficial inflation rates ranged between negative 3% (deflation) followed by a temporary spike to 9.3% during the 1948–1966 period. After that it was steady with a range of negative 0.8% to 3.6% as inflation started to rise in 1966. The stock market soared during that period, up some 445%. The period after 1966–1982 saw inflation peak at 14.6% in 1980. There were four recessions during that period: 1969–1970, 1973–1975, 1979–1980, and 1981–1982. The Fed hiked interest rates to 20% (and we think we have it bad today) and the stock market was a huge underperformer, losing 23% during the period.
Once again, a period of beneficial inflation followed in 1982–2000 where the stock market soared an incredible 1,425%. Inflation peaked at 6.4% in 1990, interest rates rose, and a mild recession in the early 1990s followed. It was the only named recession during that period. It is not that inflation soared as it only hit 3.7% in 2000, the highest it had been since 1990, but that the dot.com/high-tech bubble blew up (as all bubbles do). A recession followed. Then the housing bubble hit its peak in 2006 and it too blew up, resulting in the financial crisis of 2008 and collapse of Lehman Brothers. Inflation peaked at 5.5% in 2008. Inflation never really got bad during the period, but excesses in the stock market (high-tech) and housing reached their peak and the fall was rapid.
Next came the most incredible bubble in history, as some might say. Interest rates were slashed to zero (with negative interest rates in the EU and Japan) and the monetary spigots were opened. The result was that inflation stayed benign, never getting higher than 3.8%. But the stock market, housing market, and everything else soared. The DJI was up 466% during that period. Price inflation was replaced by asset inflation. Then inflation started rising once again, the Fed tightened to combat inflation and ease market excesses, money supply contracted, and obtaining credit became more difficult. So far, inflation has peaked at 8.9% and the DJI has fallen 22% at its low in October 2022. The DJI remains down 8.4% while other indices have fared worse.
Inflation and Fed Funds 1948–2023
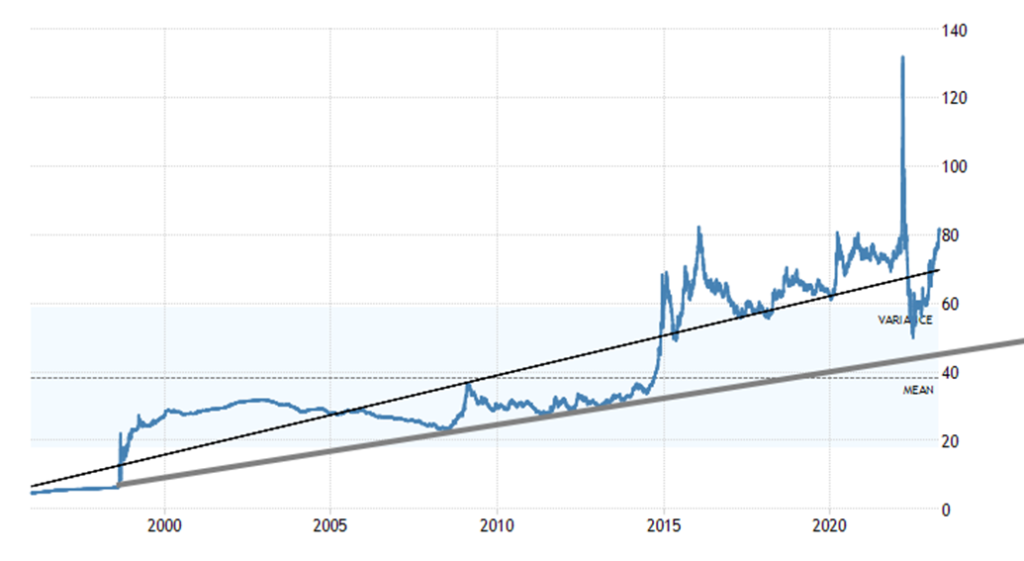
A common element behind inflation has been oil prices. During the 1950s and until the Arab Oil crisis of 1973, WTI oil never exceeded $3.50 bbl. Then along came the Arab oil embargo and oil prices soared to over $10 bbl. by 1974. However, they didn’t stop there. By the time the Iranian hostage crisis was underway in 1979, oil prices soared again to about $40. That would be $143 bbl. in today’s money. That was during the inflationary 1970s. Then oil prices collapsed, hitting a low of $10 in 1986 and $11 in 1998. Yes, they spiked into 1990 and Gulf War 1, hitting $35 bbl., but they quickly came down after. That saw a rise in inflation and eventually the early 1990s recession.
Oil prices were benign throughout the 1990s, eventually hitting that low of $11 bbl. in 1998 before rising once again. By 2008 they hit a peak of over $140 bbl. (or $193 bbl. in today’s money). The result was the 2008 financial crisis, even as rising oil prices were not the direct cause of the crisis but instead a major contributor. Oil prices remained somewhat benign again during the 2010s, hitting their trough in 2020 during the pandemic with a low of $6 bbl.
Then came the growing Russia/Ukraine crisis, and when war broke out and sanctions rose, oil soared once again to a peak of around $130 bbl. While oil prices have come down, they are starting to rise again. Whether they hit new peaks or not is not known at this time, but rising oil prices are not a good sign and could result in inflation heating up once again. This is despite oil prices today on an inflation-adjusted basis are roughly at the same level they were in the mid-1980s. The recent OPEC production cuts are most likely politically motivated to cause problems for the U.S. economy. Could they do it again?
WTI Oil Prices 1948–2023

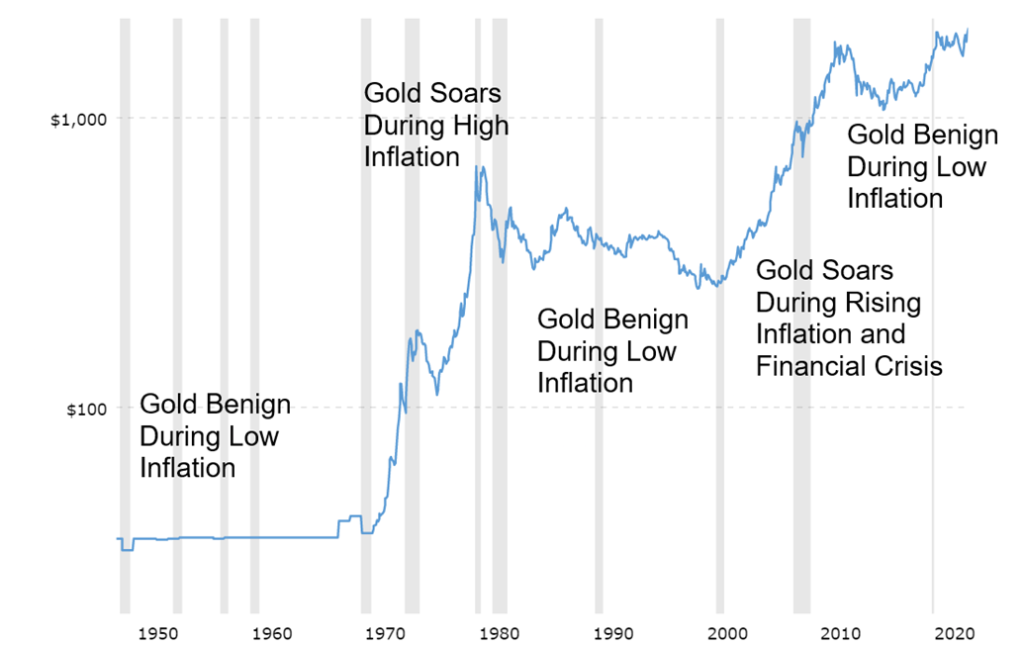
The path of gold also appears to follow the path of oil, although that could be simplified down to commodities. Gold also appears to fall and remain low during periods of low inflation but soars during periods of financial and economic stress and rising inflation. Gold has only been tracking since 1971 as a free-trading commodity. But the inflationary 1970s that were also a period of financial and geopolitical stress saw gold soar to record highs by 1980. When the Fed hiked interest rates to 20% to bring down the rate of inflation, gold collapsed. The period of low inflation during the 1980s and 1990s saw gold mostly languish. As inflation picked up somewhat in the 2000s, gold started rising again. Oil prices were also rising. Then along came the 2008 financial crisis and gold exploded upwards to new highs once again (financial stress). With inflation dragged down during the 2010s, gold again collapsed. But now, with inflation (and oil) rising again along with a financial (banks) crisis and geopolitical stress (U.S./Russia/China), gold is once again rising.
Gold 1948–2023
There is nothing benign about inflation. The monetary authorities (Fed, BofC, BOE, etc.) are caught between a rock and hard place. Canada stood pat this past week on another interest rate hike, despite evidence suggesting that stopping or pausing may be the worst thing they could do. The Canadian dollar is still exhibiting strength, given the recent strong job numbers and interest rates that are rising once again. The Canadian 10-year Government of Canada bond (CGB) is back up to 3.00% after being as low as 2.73% in March.
The stronger economic numbers have, along with rising oil prices, helped push the Cdn$ higher to almost 75.00 vs. a low recently of 72.20 in early March.
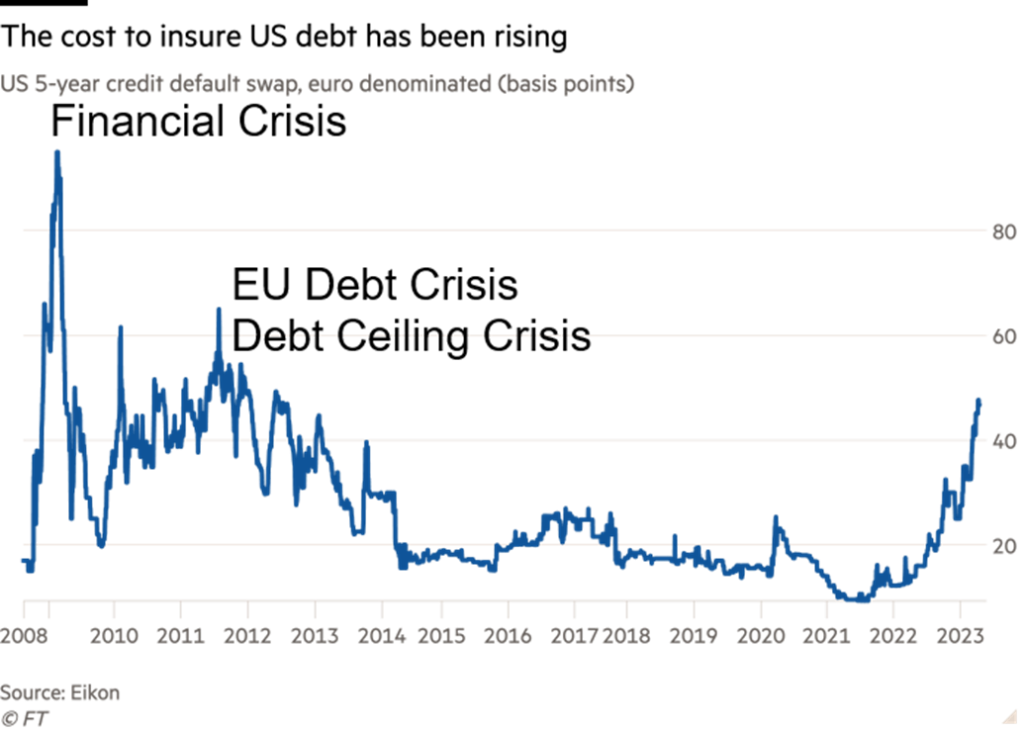
Finally, something else that isn’t getting the attention it probably warrants is the ongoing debt ceiling battle. The debt ceiling is at a stalemate between the White House and congressional Republicans. The White House wants it raised. Republicans are demanding huge budget cuts to agree to a higher debt level. The White House has refused to concede. As a result, the probability of a default is rising and is being reflected by the widening cost of buying insurance against a U.S. default (credit default swaps – CDSs). The 5-year U.S. CDS has widened recently to almost 50 bp after being close to zero back in 2021. Previous periods of rising CDSs were during the 2008 financial crisis, throughout the period of the EU/Greek debt crisis, and during an earlier fight over the debt ceiling limit during the Obama administration in 2012. Further fights in 2013 and later saw, instead, a suspension of the debt ceiling (temporary) and kicking the debt ceiling can down the road.
But failure to pass a new debt ceiling could have all sorts of negative consequences. U.S. Treasury Secretary Janet Yellen views that it could lead to a potential catastrophe. While many believe they will all come to their senses in the nick of time, that is not guaranteed. As a result, the CDSs have been rising. And with a rise in the credit spread comes a rise in interest rates. Investors are avoiding maturities that come due during the period, and short-term interest rates are rising, with the 3-month treasury bill up to 5.07% from 4.37% barely a month ago.
A U.S. default of any kind could have a profound negative impact on the global economy and the financial system, particularly banks. SVB Bank and Signature Bank collapsed because of withdrawals and a portfolio that had lent long and funded short. But short funding rates are rising, as noted by the rise in the 3-month T-Bill, which has a profound impact on numerous other banks that are also facing the same problem. The Fed can’t guarantee everybody. As depositors flee the banks, many others could soon be in trouble.
Yet markets have been rallying on expectations that the Fed will pause interest rate hikes. They don’t appear to believe that the debt ceiling fight could have a profound impact on the economy if they don’t come to an agreement. A number believe that if the economy rolls over the Fed will cut rates. All that could fuel inflation even further, egged on by rising oil prices. As we note, the Fed and the other central banks are caught between a rock and hard place. Inflation is not going away anytime soon. A fall to 2% inflation will remain out of reach for some time. Even Tiff Macklem, the BofC Governor, has said so.
Chart of the Week
Chinese Yuan
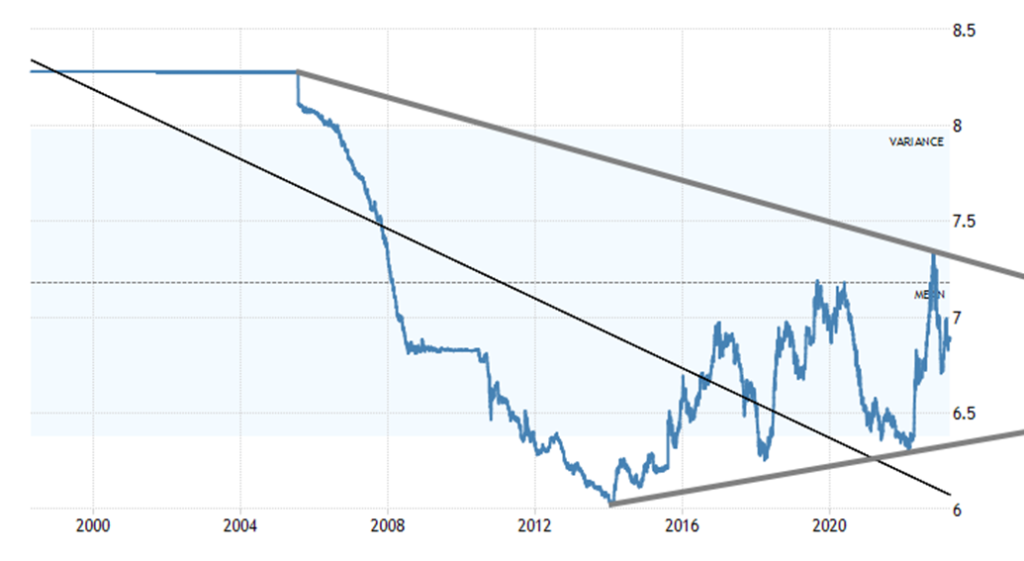
We’ll call this the “yuan and ruble show.” Above is the Chinese yuan and on the next page the Russian ruble. The chart is expressed in number of yuan or rubles that can be purchased by US$1. Currently US$1 = 6.88 yuan or US$1 = 81.7 rubles. For Canadians, it is the same as saying US$1 = 1.346 (all as of April 12, 2023). Curiously, the U.S. dollar has been rising against the yuan since late February 2022. That’s the same time that, because of the outset of the Russian invasion of Ukraine, the U.S. dollar rose sharply against the ruble, where at one point a U.S. dollar could purchase some 130 rubles or more.
Clearly, the invasion has played a role for both the yuan and the ruble. But because of sharply rising oil prices at the time, the ruble fell back into June 2022 when at one point the U.S. dollar had fallen to almost only 50 rubles. The U.S. dollar peaked in October 2022 at around US$1 = 7.30 yuan, then promptly fell to after to US$1 = 6.50 yuan by early January 2023. Since then, both currencies have been falling against the U.S. dollar. Both currencies have shown a high degree of volatility. That shouldn’t come as any surprise.
However, the reasons why the two are falling against the U.S. dollar differ. China’s inflation rate is falling, currently only 0.7%. Producer price inflation in China is negative 2.5%. Compare that to the U.S.’s inflation rate of 5.0%. The Chinese 10-year bond is 2.82% vs. 3.51% in the U.S. Rates have been falling in China. All of this has
China looking at cutting interest rates. They recently cut their reserve requirements, looking to stimulate the economy. With the U.S. labor market still strong, expectations are that the Fed will hike again on May 2–3 by a further 25 bp. One area of concern for China is its falling exports that dropped a sharp 6.8% in January/February 2023 to a value of US$506.3 billion. It was the fourth consecutive monthly drop and adds to China’s concern of a global slowdown. China still has a trade surplus of some US$368.6 billion with the U.S. All this despite the ongoing rhetoric of war between the two countries.
Russian Ruble
The fall in the Russian ruble is, of course, quite different. Falling oil prices certainly hurt the Russians, but so have all of the sanctions to varying degrees. Sanctions are not dissimilar to a trade war. It hasn’t helped Russia that inflows of foreign currency have fallen, even as demand has picked up. Russia’s exports fell sharply over the past year despite deals with China, India, and others for oil to replace what has been lost from the EU. Exports fell US$21.7 billion in January from December to a level of about US$54.0 billion. They are down some 35% over the past year. Fewer exports mean less demand for foreign currencies as well.
Inflation as of March is only 3.5%. That is a big drop from February when it was 11%. But rates haven’t come down as the Russian 10-year is at 10.56% but off its highs of 11.20%. Interest rates spiked shortly after the war to over 14%, but then came back down later.
Both currencies are subject to geopolitical developments. Biden calling Putin a “killer” doesn’t help the Russian ruble. Fear of further sanctions, particularly on Russia, also has a negative effect. Overall, both currencies are most likely trading below fundamental values. China has the largest foreign exchange reserves in the world with US$3,188.8 billion. Surprisingly, Russia is also ranked number 6 with US$497.5 billion. A big chunk of their FX reserves is made up of gold, as China holds 2,010 metric tonnes and Russia 2,301 metric tonnes. That ranks them the fifth and sixth largest holders of gold in the world. Both have been added over the past year.
China also has some US$859.4 billion of U.S. treasuries, but they have been selling them off. Their holdings have fallen US$174.4 billion over the past year. Nor are they stepping up and buying U.S. treasuries like they used to. The ongoing war rhetoric between the two countries is negatively impacting China’s holdings of U.S. treasuries. The old relationship between the two whereby China bought the U.S.’s securities and the U.S. bought its goods has broken down. And that is even as the U.S.’s trade deficit remains unusually high. In 2022 the U.S. reported importing US$575.9 billion from China. That was higher than the US$540.0 billion imported in 2021.
Both the yuan and the ruble have fallen in the past year. But, as many note, it is largely because of the ongoing political difficulties between the U.S. and the two countries. Fundamentally, both currencies should be stronger.
Finally, and no surprise since we have noted it before, we are moving towards a bipolar currency world with the Chinese yuan as the currency most opposed to the U.S. dollar. As we have emphasized before, this does not mean the end of the U.S. dollar as the world’s reserve currency, but it can and will put pressure on the value of the U.S. dollar. China and Russia are leading the charge to try and create an alternative economic, monetary, and global reserve system. This will most likely not come easily and, as we have noted, may lead to real wars as it has in the past.
The BRICS (Brazil, Russia, India, China, and South Africa) could be joined by others such as Saudi Arabia, Argentina, Turkey, and Egypt. A group of South East Asian nations (ASEAN) are also working on creating a common currency for trade again off the U.S. dollar. If one wants to understand why we are in an increasingly unstable world, one needs to look no further than the quest to create an alternative economic system. But, no, the U.S. dollar won’t disappear. This process towards a bipolar currency world is going to take years. And the yuan may never make it because China just does not have the capital markets that the U.S. has. And as to longevity of currencies, well, even the pound sterling is still with us. The peso, the franc, the guilder, and the real—all gone.
Markets & Trends
| % Gains (Losses) Trends | ||||||||
| Close Dec 31/22 | Close Apr 14/23 | Week | YTD | Daily (Short Term) | Weekly (Intermediate) | Monthly (Long Term) | ||
| Stock Market Indices | ||||||||
| `S&P 500 | 3,839.50 | 4,137.64 | 0.8% | 7.8% | up | up | up (weak) | |
| Dow Jones Industrials | 33,147.25 | 33,886.47 | 1.2% | 2.2% | up | up | up | |
| Dow Jones Transport | 13,391.91 | 14,246.60 | 2.0% | 6.4% | neutral | neutral | up (weak) | |
| NASDAQ | 10,466.48 | 12,123.47 | 0.3% | 15.8% | up | up | neutral | |
| S&P/TSX Composite | 19,384.92 | 20,579.91 | 1.9% | 6.2% | up | up | up | |
| S&P/TSX Venture (CDNX) | 570.27 | 637.88 | 1.9% | 11.9% | up | up | down (weak) | |
| S&P 600 (small) | 1,157.53 | 1,163.71 | 1.2% | 0.5% | down (weak) | down (weak) | neutral | |
| MSCI World Index | 1,977.74 | 2,163.07 | 2.1% | 9.4% | up | up | up (weak) | |
| Bitcoin | 16,535.23 | 30,586.66 | 9.4% | 85.0% | up | up | neutral | |
| Gold Mining Stock Indices | ||||||||
| Gold Bugs Index (HUI) | 229.75 | 273.55 | 0.7% | 19.1% | up | up | neutral | |
| TSX Gold Index (TGD) | 277.68 | 327.06 | 0.2% | 17.8% | up | up | up (weak) | |
| % | ||||||||
| U.S. 10-Year Treasury Bond yield | 3.88% | 3.51% | 6.4% | (9.5)% | ||||
| Cdn. 10-Year Bond CGB yield | 3.29% | 3.04% | 9.0% | (7.6)% | ||||
| Recession Watch Spreads | ||||||||
| U.S. 2-year 10-year Treasury spread | (0.55)% | (0.58)% | (9.4)% | (5.4)% | ||||
| Cdn 2-year 10-year CGB spread | (0.76)% | (0.84)% | (6.0)% | (4.0)% | ||||
| Currencies | ||||||||
| US$ Index | 103.27 | 101.25 | (0.3)% | (2.0)% | down | down | up | |
| Canadian $ | 73.92 | 74.94 | 0.8% | 1.4% | up | down | down | |
| Euro | 107.04 | 109.97 | 0.7% | 2.7% | up | up | down (weak) | |
| Swiss Franc | 108.15 | 111.88 | 1.2% | 3.5% | up | up | up | |
| British Pound | 120.96 | 124.18 | (0.2)% | 2.7% | up | up | down (weak) | |
| Japanese Yen | 76.27 | 74.77 | (1.4)% | (2.0)% | neutral | up | down | |
| Precious Metals | ||||||||
| Gold | 1,826.20 | 2,015.80 (new highs) | (0.5)% | 10.4% | up | up | up | |
| Silver | 24.04 | 25.46 (new highs) | 1.5% | 5.9% | up | up | up | |
| Platinum | 1,082.90 | 1,054.00 | 3.7% | (2.7)% | up | up | up (weak) | |
| Base Metals | ||||||||
| Palladium | 1,798.00 | 1,496.30 | 2.3% | (16.8)% | up | down | down | |
| Copper | 3.81 | 4.11 | 2.2% | 7.9% | up | up | up (weak) | |
| Energy | ||||||||
| WTI Oil | 80.26 | 82.52 | 2.3% | 2.8% | up | neutral | up (weak) | |
| Nat Gas | 4.48 | 2.11 (new lows) | 5.0% | (52.9)% | down | down | down | |
New highs/lows refer to new 52-week highs/lows and, in some cases, all-time highs.
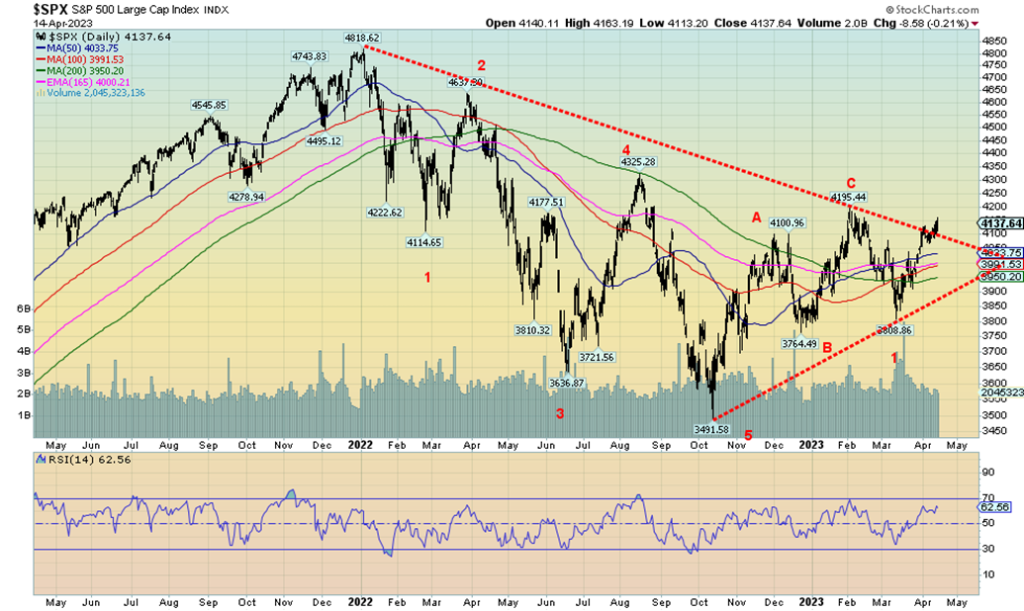
It’s the reluctant rally, or so we are calling it. The rebound that started off the October low of 3,491 still appears to us as an ABC correction. Yet we are seeing constant forecasts that we are headed for new all-time highs and that the new bull market is upon us. Whoa! Hold on. The recession hasn’t even started yet and, as we showed last week, markets normally don’t make their ultimate low before the recession has even started. We have been in the strong six months—October to April, and now it is “sell in May, and go away.” That’s the saying, but even we admit it doesn’t always happen. Since 1950 the best six months have returned on average for the DJI 7.3% and the worst six months brought a return of 0.8%. But we also note, of the best six months, 56 out of 72 months were up and for the worst six months 45 of 72 months were up. So, it seems they all make money. It’s those nasty hiccups one has to watch for.
On the week, the S&P 500 gained 0.8%, the Dow Jones Industrials (DJI) was up 1.2%, the Dow Jones Transportations (DJT) gained 2.0%, and the NASDAQ was up 0.3%. The S&P 400 (mid) gained 1.7% and the S&P 600 (small) was up 1.2%. Bitcoin continued its recent tear and was up 9.4% this past week. That market is becoming super-bullish once again. But, really, who in their right mind would go there, given all the scams, hacks, thefts, money laundering, and lack of regulation, even as the regulator’s circle.
In Canada, the TSX Composite gained 1.9% and the TSX Venture Exchange (CDNX) was also up 1.9%. The world MSCI Index was up 2.1%. In the EU, the London FTSE was up 1.7%, the EuroNext gained 1.7%, the Paris CAC 40 was up 2.7%, and the German DAX up 1.3%. The EuroNext, the CAC, and the DAX all made fresh 52-week highs.
In Asia, China’s Shanghai Index (SSEC) was up 0.8% and the Tokyo Nikkei Dow (TKN) gained a strong 16.4%. Hong Kong’s Hang Seng (HSI) was up 0.5%.
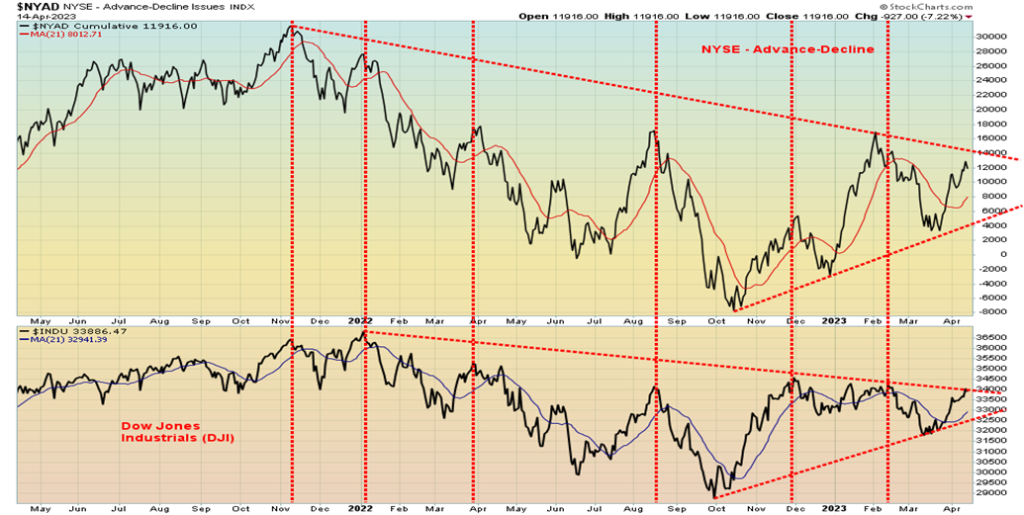
The bulls we are reading could well be right. Some are saying 4,600. We always get a bit suspicious of these forecasts when we are currently only at 4,137. That’s almost 500 points away or 11%. Maybe they are right, but given we haven’t even started a recession (which is still predicted by many economists), we seem to be reaching levels of high complacency and optimism. Even the Fear & Greed Index is currently at Greed (no, not Extreme Greed—yet). We are advancing on declining volume. Not a good sign. New highs/new lows are not confirming, either. Nor for that matter is the advance/decline line (see chart next). Elliott Wave International (www.elliottwave.com) is calling this just a corrective wave. There’s no denying we could go higher. If we are successful and break above 4,200, then we could see a run to at least that August 2022 high of 4,300.
There are unknowns like the debt ceiling. And we are in the dark as to what, if any, impact the revelations in the latest Pentagon papers might bring. What those papers did show is how deeply the U.S. and NATO are already involved in the Russia/Ukraine war. But the trouble is on the horizon with France’s Macron questioning it all. The banking crisis is not over, despite some rosy numbers this past week. We’ll see how further company results may help push the markets higher. After all, markets like good returns and then they shove everything else into the background.
Nonetheless, the current trend is higher. If the S&P 500 were to break back under 4,000 it would be sign of some trouble. Under 3,900, and we’d declare the bull run is over and the next wave down is underway.
NYSE Advance/Decline vs. DJI
U.S. Retail Sales 2018-2023
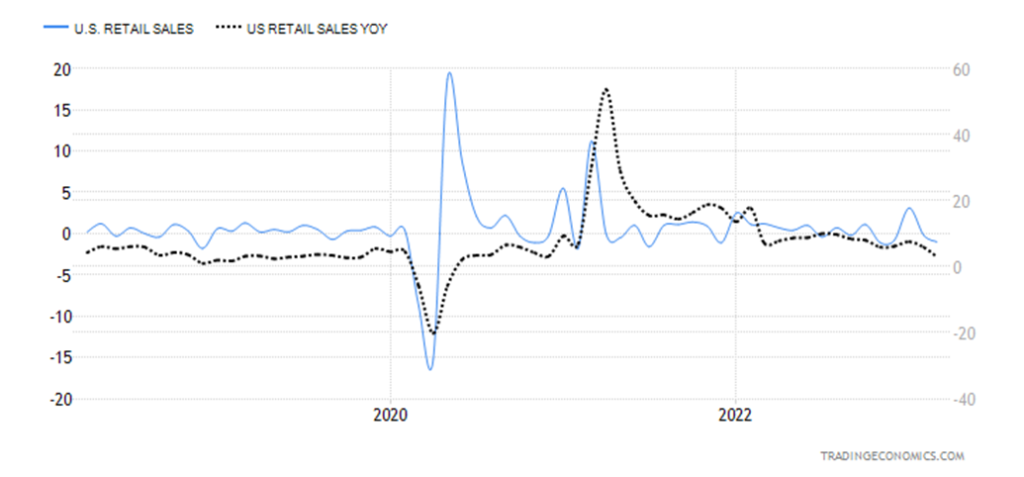
Retail sales fell in March by 1% and February sales were revised downward to negative 0.2%. The drop in March was well above (or, we guess, below) the expected drop of 0.4%. Rising inflation and high-interest rates appear to be impacting the economy. On a year-over-year basis, retail sales were up only 2.9%. It’s the lowest level seen since the pandemic recession of 2020. Retail sales are now growing below the rate of inflation. In real terms (adjusted for inflation), retail sales peaked in March 2021 and are now down 3% from that peak. And that’s not taking into consideration population growth.
University of Michigan Sentiment Index 1998-2023
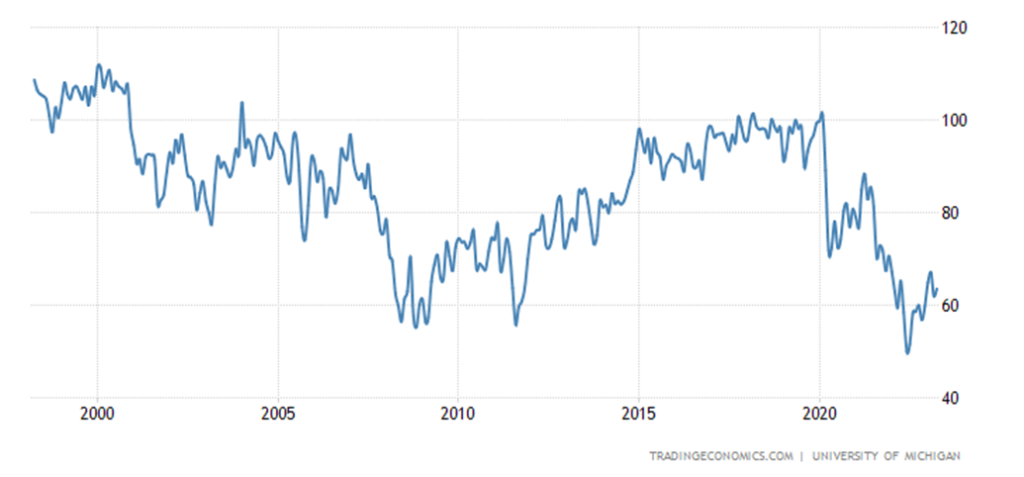
Given the poor retail sales, it may have been surprising that the Michigan Consumer Confidence Index came in at 63.5 for April. That was above the expected 62 and above March’s 62. Still, that leaves consumer confidence around the lows of the 2007–2009 Great Recession and not a lot better than what was seen during the early 1980s recessions. It did not help the markets on Friday, as they fell.
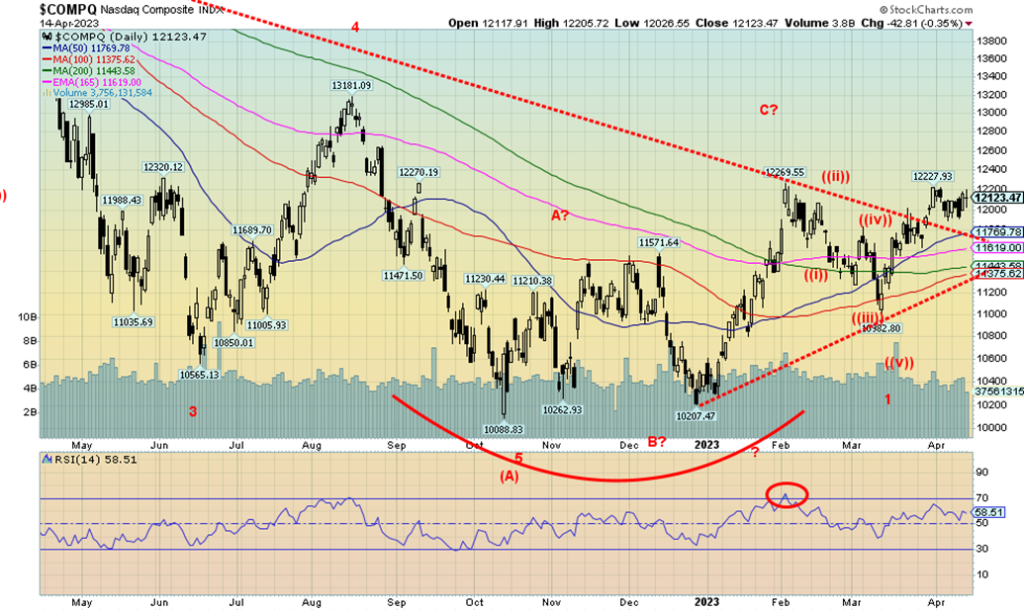
The NASDAQ struggled to a 0.3% gain this past week, the weakest of the major indices. We have broken above that downtrend line from the highs, but with fading volume, maybe it’s not surprising that the NASDAQ has struggled higher since breaking the line. We are in an uptrend, but the uptrend is not particularly strong. The NY FANG Index actually fell this week, a small 0.3%. That’s despite Meta once again making new highs. Meta is up an incredible 84% in 2023. Big losers were the Chinese stocks, with Baidu down 11.2% and Alibaba off 8.0%. This has not been a strong rally, so we’d be cautious on being long. There is some potential trouble if we break under 11,900. Real trouble starts with a break under 11,600. Despite recent strength and a gain of 15.8%, so far this year the NASDAQ still appears as a laggard. The up pattern continues to appear as an ABC-type corrective with the C wave not as yet complete. Resistance has formed at 12,230/12,270. A move above 12,270 could then take us to the August 2022 high of 13,181.
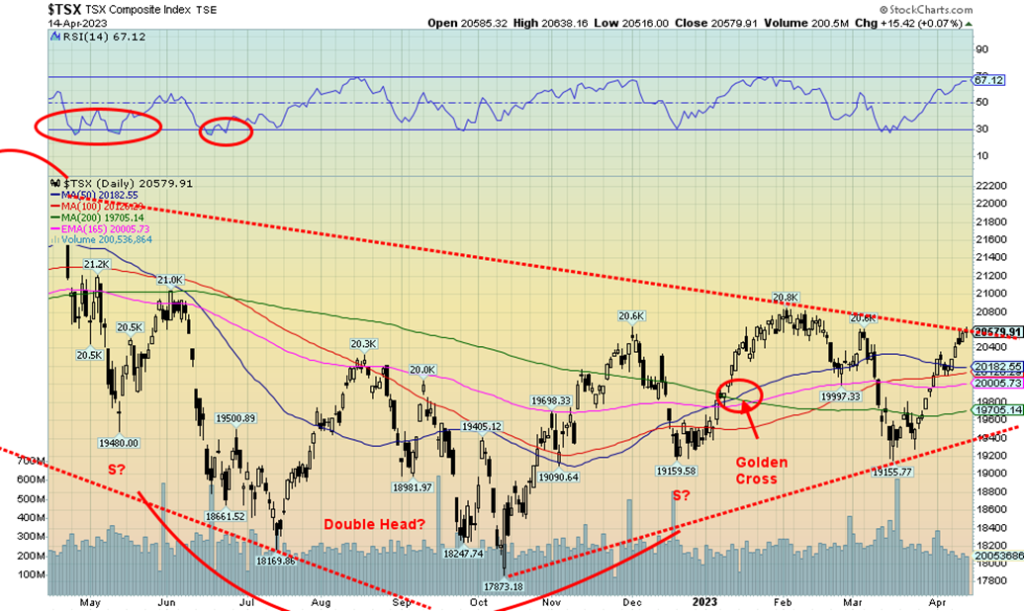
The TSX Composite had an up week, gaining 1.9%. The junior TSX Venture Exchange (CDNX) also gained 1.9%. Of the 14 sub-indices, only one was down, the much-beleaguered Health Care (THC), off 2.1%. THC continues its woes from 2022 and is the only TSX sub-index losing in 2023, down 5.2%. Information Technology (TKK) is the star, up 24.4% in 2023, followed by Golds (TGD), up 17.8%. On the week, there was no real star but the best gain was seen for Energy (TEN), up 2.9%. Others gaining 2% or more were Income Trusts (TCM), up 2.3%, and Materials (TMT), up 2.4%. The TSX has now climbed to test a downtrend line from the highs. We need to firmly break over that line to suggest higher. Resistance can be seen up 20,800. To the downside a breakdown back under 20,180 would be negative. Volume has been sliding on this up move, suggesting to us that the rally is not particularly strong.
U.S. 10-year Treasury Bond/Canadian 10-year Government Bond (CGB)
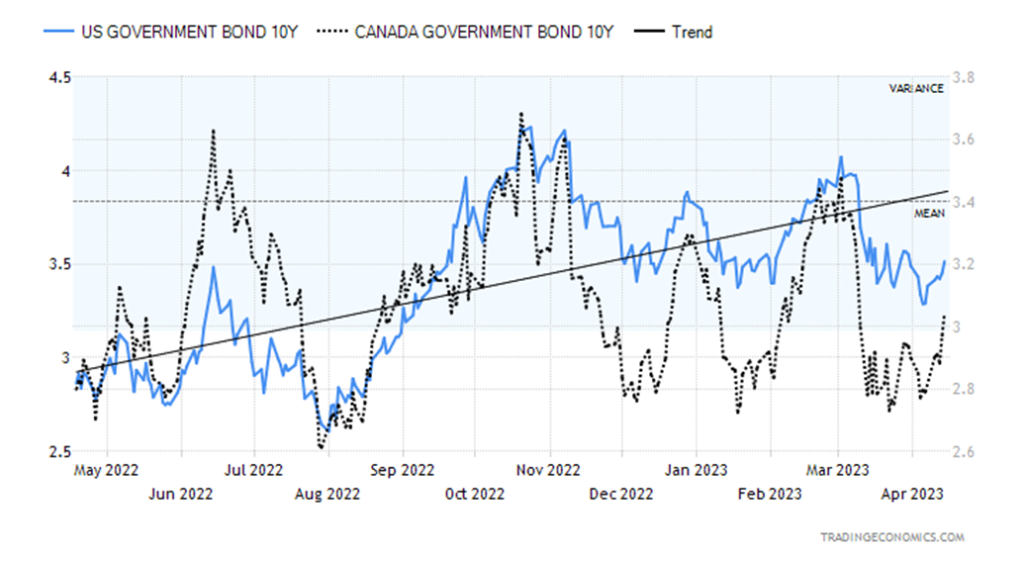
Bond yields rose this past week. The 10-year U.S. treasury note rose to 3.51%, up from 3.30% the previous week and the Canadian 10-year Government of Canada bond (CGB) rose to 3.04% from 2.79%. Good up moves. The spreads were little changed and are still pointing to a recession that has not started. It’s still expected that the Fed will hike another 25 bp at the May 2–3 FOMC. Economic numbers are not strong but they aren’t disasters, either. At least not yet. The bond market may be concerned about the debt ceiling war and that alone would push rates higher. We are certainly seeing with maturities out to three months that they are potentially the most impacted in a protracted debt ceiling fight. But the prevailing expectation is that an agreement will be reached, as the alternative is too scary to contemplate. A U.S. default?
We noted almost all the big economic numbers from last week, including inflation (CPI, PPI) (coming down), retail sales (lower), and the Michigan Consumer Confidence Index (stronger). The weekly jobless claims were up to 239,000, above the expected 232,000. That didn’t seem to impact bond yields too much. Nor did it impact the market to any extent.
Bonds have become quite choppy. We do appear to be in a downtrend as the high was 4.24% back in October followed by a lower high in March of 4.18%. The recent low of 3.10% was below January’s low of 3.37%. A downtrend is in place. We saw that in Canada too as the high was 3.68%, also in October 2022, followed by a lower high in March of 3.48%. Failure to make any new highs this time will confirm the downtrend.
This coming week Canada reports its inflation numbers while the U.S. reports on some housing numbers and manufacturing indices such as the Philly Fed and the NY Empire State Index. Otherwise, it is not a busy week.
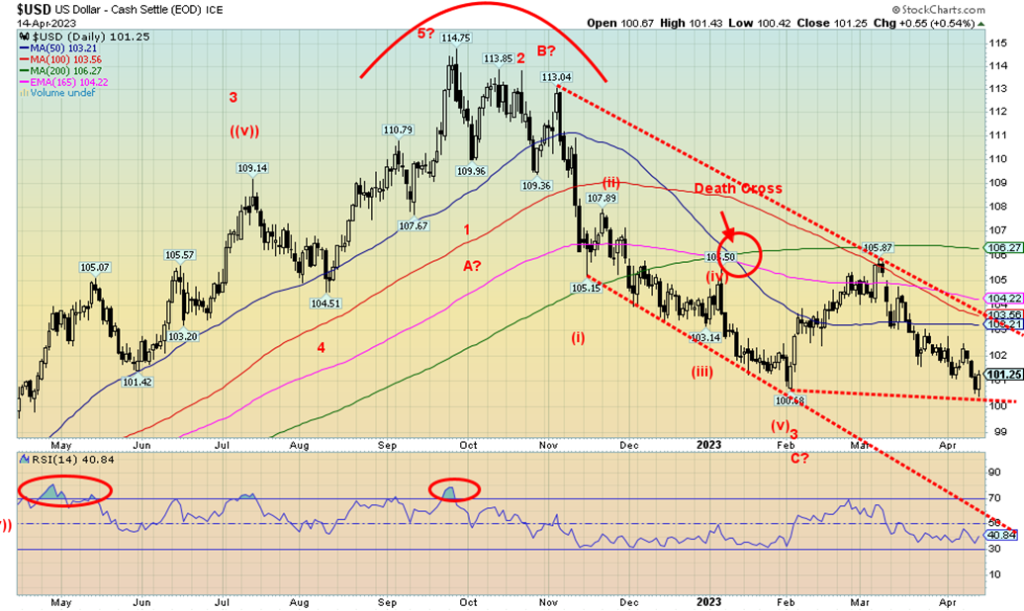
Did the US$ Index put in a reversal day on Friday? It appears that way as the US$ Index made a new low at 100.42, then reversed and closed above Thursday’s high. An outside day upside reversal. A move above 102.50 would confirm the low. On the week, the US$ Index fell 0.3%, the euro was up 0.7%, the Swiss franc gained 1.2%, but the pound sterling fell 0.2% and the Japanese yen dropped 1.4%. The Cdn$ was up 0.8%.
We need to see the US$ Index firmly break under 100 to suggest to us that we really are going low. That bear channel doesn’t have a bottom until we reach down around 96. All that would be great for gold. But a rising US$ Index is negative for gold. One day does not make a reversal. But momentum was fading on this decline as new lows were not confirmed by most indicators. If the reversal Friday was real, we should move higher. If not, then we will make new lows below 100.
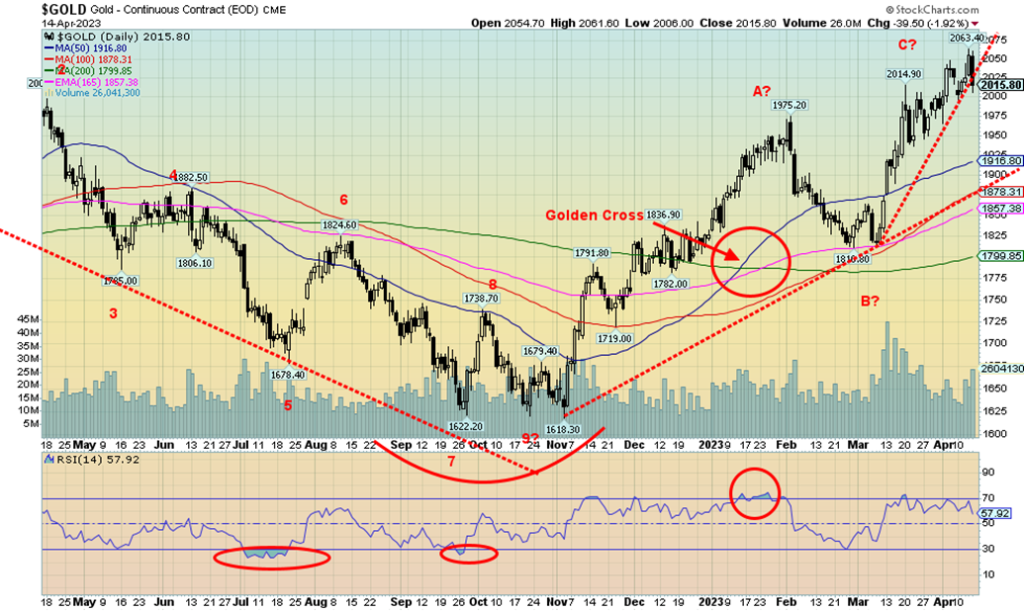
We weren’t wild about Friday’s action in gold. It reversed to the downside. No, we saw no new highs, but we took out the low of Thursday and closed under that level. We also noted what appears to be an outside day to the upside for the US$ Index. As well silver put in an outside reversal day to the downside. A low in the US$ Index and a high in gold? That’s often the way it works. We also penetrated the up-trend line from the earlier March low. We note that the rebound from that $1,618 low in November appears to us as a large ABC pattern and not an impulse wave to the upside. Since making that all-time high back in August 2020 at $2,089, gold has been undergoing what certainly appears to be a large corrective pattern.
For the week, gold actually fell a small 0.5% after making 52-week highs at $2,063. Silver also made 52-week highs but held its gain up 1.5%. Platinum rose as well, up 3.7%. Palladium gained 2.3% and copper was up 2.2%. The Gold Bugs Index (HUI) gained 0.7% and the TSX Gold Index (TGD) was up a small 0.2%. Winning streaks continued as this was to be the seventh consecutive up week. It failed, of course, with the small loss for gold.
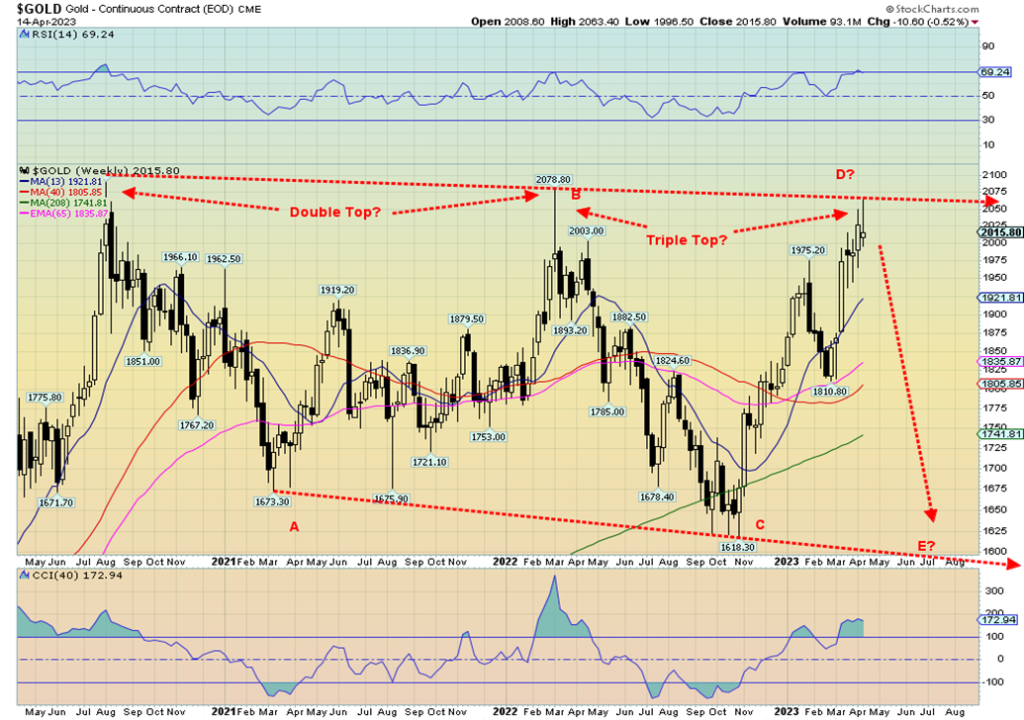
We have some negative seasonals coming up as the period April/June/July is not traditionally a strong period for gold. We remain concerned that we may not have made our 7.83-year and 23.5-year cycle low back in November. We have continually noted that only new highs above $2,100 would confirm our cycle lows. We have mused previously that the low could come as late as December 2023 before gold starts a more sustained rise. The pattern up from $1,618 low in November appears as a possible ABC. That’s not an impulse wave. The weekly chart below suggests that the pattern since that high of $2,089 in August 2020 was also a possible ABC move. But sometimes these long patterns (and even shorter ones) play out in five waves an ABCDE. If that’s correct, then this may be the D wave with the E wave to come. The E wave should decline in five waves to a low. The bottom of that channel is down around $1,600. Some might argue it’s a triple top with $2,089 in August 2020, $2,079 in April 2022, and $2,063 now. Triple tops are rare. If it really were, then a breakdown under $1,600 could suggest a really serious decline to $1,100. Some have suggested that. Minimum targets would be down to just under $1,500.
The weekly RSI did just tick above the overbought level of 70. Not serious, but noted. Sentiment has been high for gold as well, as the gold writers are falling all over themselves predicting sharply higher prices. We could argue that the wave up from $1,618 did unfold in five waves, but the wave 2 of that was pretty shallow. The supposed fourth wave was quite clear when we topped at $1,975 and fell to $1,810. So, is it a fourth wave or just the B wave?
Gold will eventually break out. We do not believe the banking crisis is over just yet, nor is the global geopolitical situation any better and may have been made worse with the release of those Pentagon papers. Oddly enough, gold, despite beliefs to the contrary does follow the market. Gold fell during the 2008 financial crisis and also during the 2020 pandemic, just nowhere near as much as the broader market. However, silver and the gold stocks fell sharply, more than the broader market. Something to keep in mind going forward, especially if the markets do take a turn for the worse. In the interim, new highs above $2,063 keep new highs above $2,089 in play. A break of $1,975/$2000 would be negative and suggest the top is in.
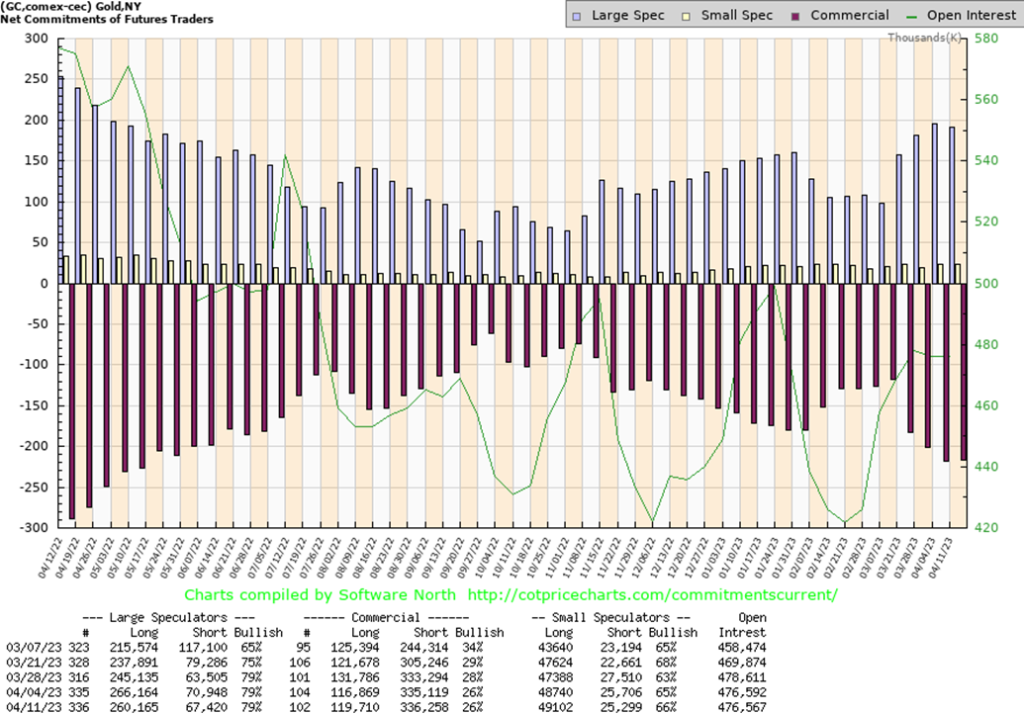
The commercial COT (bullion companies and banks) for gold remained at 26% this past week. Not much changed. Long open interest rose some 3,000 contracts, while short open interest was up only around 1,000 contracts. The large speculators COT (hedge funds, managed futures, etc.) was also flat at 79%, but they shed roughly 6,000 longs and over 3,000 shorts. Overall, open interest was flat on the week. The fact that the commercial COT didn’t deteriorate further could be taken as a positive sign.
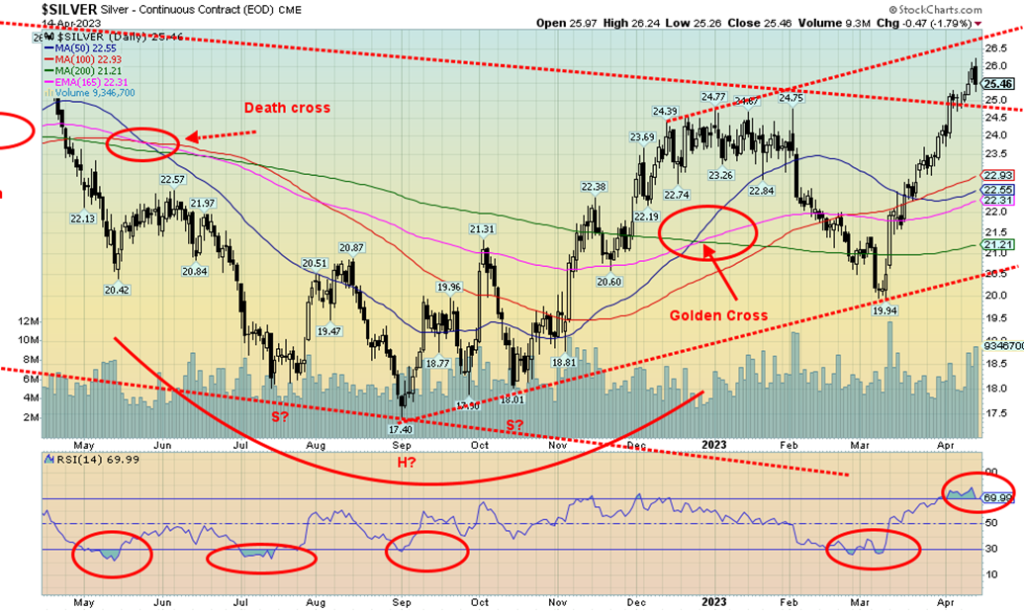
We won’t pretend we liked the action of silver on Friday. Silver put in what appears to be an outside day reversal with a higher high, a lower low, and a lower close on Friday from Thursday. We are also coming off of some overbought conditions with the RSI above 70. As well, we do have some divergences in indicators (not shown) suggesting that we may have made at least a temporary top. As we noted with gold, we have some seasonal tendencies that show weakness for the precious metals at least into June or even July. We thought we might have made it to the top of that channel we drew that is up around $26.75, but we’ve fallen short with a high so far at $26.24.
The pattern up from that September low of $17.40 appears to have unfolded in an ABC with the A wave topping at $24.77 in December, the B wave low of $19.94 in March, and the current up wave to the high of $26.24. We thought we had an awkward-looking head and shoulders bottom form in July/October with potential targets up to $25.60 and next up to $26.50. We fell just short of that second target, so far. Nonetheless, we don’t like reversals like that and some caution must be exercised. If this really was an ABC pattern, that means the next wave down could be a steeper decline than many expect. The bottom of a broader weekly channel is down around $16. Any drop now under $25 is negative. A drop under $24 would confirm the top and we could then be starting a larger wave to the downside. Only new highs and preferably a move above $27 would convince us we are moving higher.
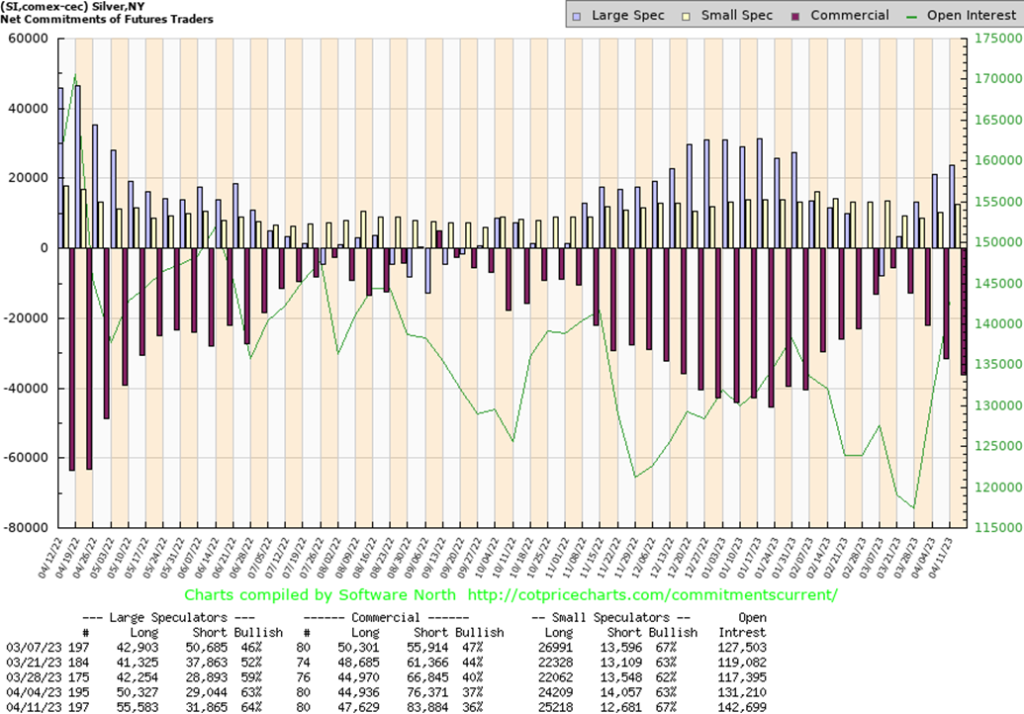
The commercial COT for silver fell further this past week to 36% from 37%. Like gold, long open interest rose by about 3,000 contracts but short open interest also rose up over 7,000 contracts. The large speculators COT rose to 63% as they added over 5,000 longs but also added over 2,000 shorts. Total open interest rose over 11,000 contracts on an up week which was positive. The silver commercial COT is deteriorating, but it is still not at levels that would suggest a top.
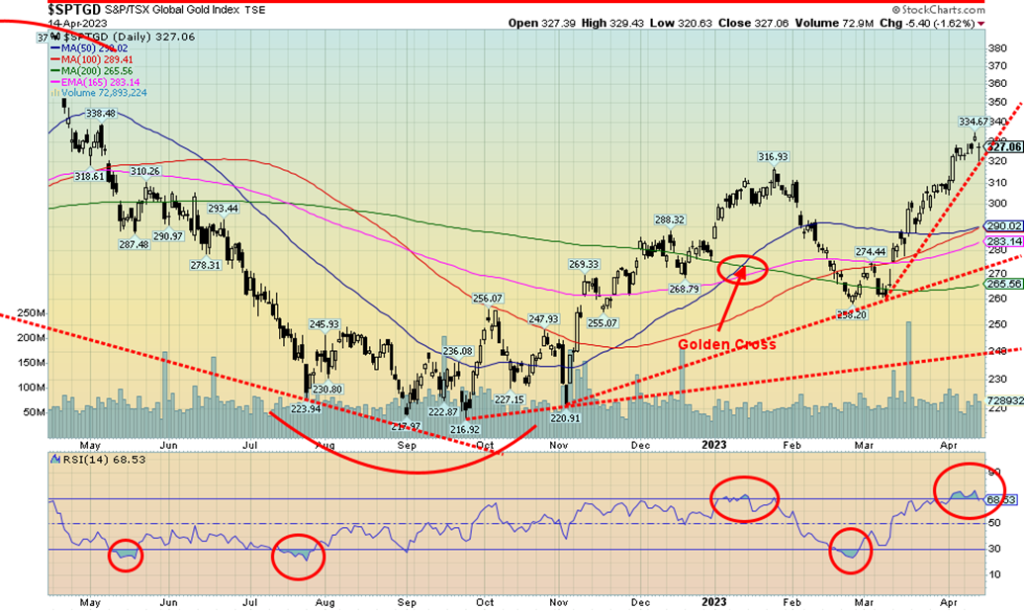
Overbought conditions eventually result in a correction. Could one now be underway? The gold stocks appeared to spike last week into Thursday, then Friday’s reversal in gold and silver led to the gold stocks taking a hit as well. Still, on the week the TSX Gold Index (TGD) managed to eke out a 0.2% gain while the Gold Bugs Index (HUI) was up 0.7%. It was the fifth consecutive weekly gain for the TGD and it has been up six of the past seven weeks. An RSI over 70 set up the potential correction. As well, we note that the Gold Miners Bullish Percent Index (BPGDM) hit about 76 this week, the low end of what we call the happiness zone for gold stocks. In April of 2022 at an earlier top, we reached as high 83. That August 2020 high was an unprecedented 100 for the BPGDM. Rare to see that. So, while the BPGDM is now in what might be overbought territory, it is not yet at highs seen for past tops.
Friday’s action saw the market open, then plunge, following gold and silver down as profit-taking took over. But the TGD bounced back towards the end and closed near the open level. There was a small gap left on the charts from the Thursday spike that now looks like a small island reversal pattern. That’s because the market opened higher on Thursday from Wednesday (a small gap up), then did a small gap down on Friday. All that action suggests that a possible top is in. That said, it might be a temporary top. If we break Friday’s low of 320, we’ll know a top is in, but the market doesn’t start to break down until under 300/305. We note the 50-day
MA is down at 290 and it looked as if it might cross over the 100-day MA to the downside, but also appears to be curling back up. We’ll see. The trends remain up and it would take a major break under 265 to turn the trends down.
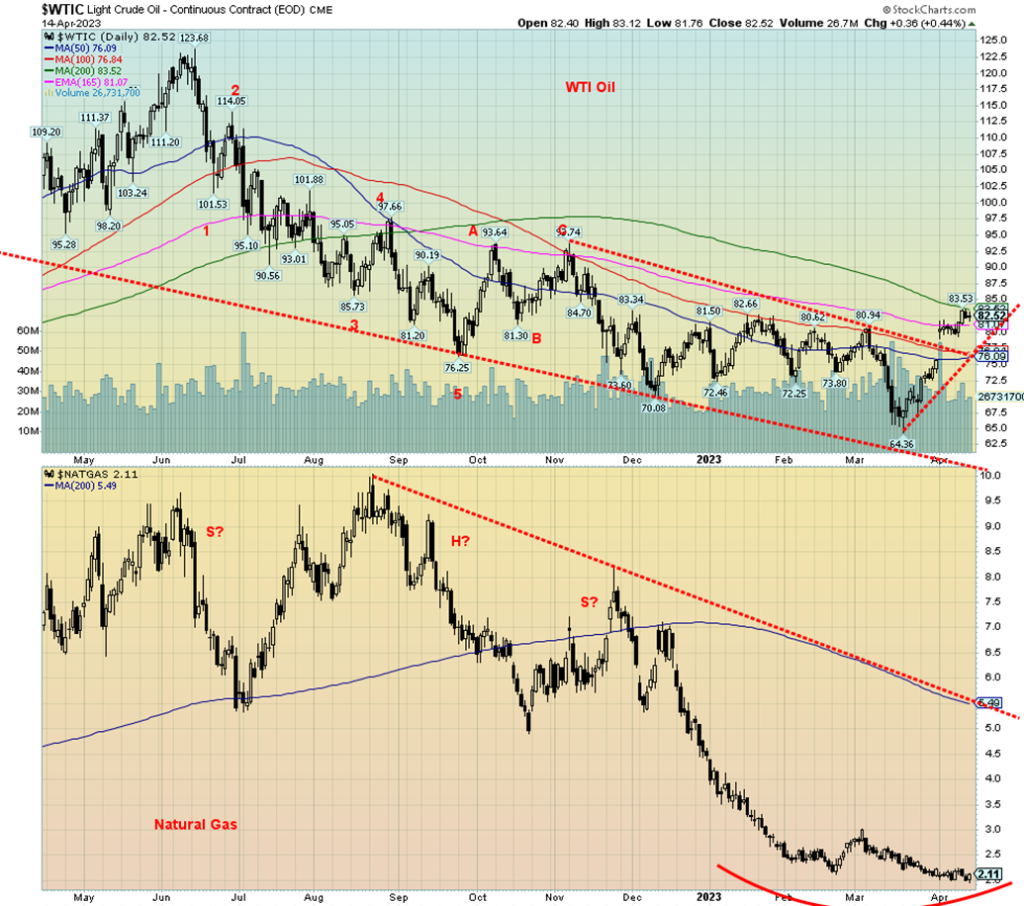
Since breaking out on an up gap after the production cut announcement from OPEC, WTI oil has been moving higher, but slowly. WTI oil gained 2.3% this past week while Brent crude was up 1.7%. Natural gas (NG)
continues to languish once again, printing 52-week lows this past week, but managed to end the week up about 5%. EU NG at the Dutch Hub continues to weaken as it was down 4.6%. NG at the Henry Hub is down 52.9% in 2023 while the Dutch Hub NG is down 46.1% year to date.
There have been some conflicting reports of late. OPEC actually warned that demand could fall in the second half of the year. However, the IEA countered that there could be a significant supply deficit later this year. The IEA seemed to win out and WTI rose. WTI is up only 2.8% on the year but is up 28% from that low seen in March at $64.36. Still, WTI has considerable work to do to show that it is really going to move higher.
The market closed the week at around the 200-day MA. We need to successfully break through that level and preferably above $88/$90 to prove we really are going to move higher. Once we take out $94, we should move higher faster. The gap is enticing, but we note that so far there has been no attempt to fill that gap. We expect the gap should stay intact and higher prices should prevail going forward. The breakdown point doesn’t occur until we bust under $76. That does not seem likely. Was OPEC’s warning politically motivated? Possibly. And they could do it again, given the tensions between US/China/Russia and that Saudi Arabia appears to be moving out of the sphere of the U.S. and into China’s.
NG could be starting a rounding bottom. However, it would appear it has considerably more work to do. A move above $3 would be positive, but it would need to be sustained. That 200-day MA up at $5.50 is a long way off. But overall, we could now be forming a bottom. So far, at least, the formation does not appear to be ledge but the start of a more rounding bottom.
__
(Featured image by Egonetix_xyz via Pixabay)
DISCLAIMER: This article was written by a third party contributor and does not reflect the opinion of Born2Invest, its management, staff or its associates. Please review our disclaimer for more information.
This article may include forward-looking statements. These forward-looking statements generally are identified by the words “believe,” “project,” “estimate,” “become,” “plan,” “will,” and similar expressions. These forward-looking statements involve known and unknown risks as well as uncertainties, including those discussed in the following cautionary statements and elsewhere in this article and on this site. Although the Company may believe that its expectations are based on reasonable assumptions, the actual results that the Company may achieve may differ materially from any forward-looking statements, which reflect the opinions of the management of the Company only as of the date hereof. Additionally, please make sure to read these important disclosures.
Copyright David Chapman 2023
David Chapman is not a registered advisory service and is not an exempt market dealer (EMD) nor a licensed financial advisor. He does not and cannot give individualised market advice. David Chapman has worked in the financial industry for over 40 years including large financial corporations, banks, and investment dealers. The information in this newsletter is intended only for informational and educational purposes. It should not be construed as an offer, a solicitation of an offer or sale of any security. Every effort is made to provide accurate and complete information. However, we cannot guarantee that there will be no errors. We make no claims, promises or guarantees about the accuracy, completeness, or adequacy of the contents of this commentary and expressly disclaim liability for errors and omissions in the contents of this commentary. David Chapman will always use his best efforts to ensure the accuracy and timeliness of all information. The reader assumes all risk when trading in securities and David Chapman advises consulting a licensed professional financial advisor or portfolio manager such as Enriched Investing Incorporated before proceeding with any trade or idea presented in this newsletter. David Chapman may own shares in companies mentioned in this newsletter. Before making an investment, prospective investors should review each security’s offering documents which summarize the objectives, fees, expenses and associated risks. David Chapman shares his ideas and opinions for informational and educational purposes only and expects the reader to perform due diligence before considering a position in any security. That includes consulting with your own licensed professional financial advisor such as Enriched Investing Incorporated. Performance is not guaranteed, values change frequently, and past performance may not be repeated.


Morocco’s Budget Execution June 2026: Deficit Narrows to 20.2 MMDH
Morocco’s Finance Law execution at end-June 2026 shows a reduced budget deficit of 20.2 billion dirhams, down from 24.9 billion...

Tilray Brands Hits Multi-Year Lows as Cannabis Investors Await Regulatory Clarity
Tilray Brands shares have fallen 57% this year amid cannabis sector weakness and uncertainty over US regulatory reform. While potential...


Ethereum Between ETF Inflows, Price Risks and a Strong July
Ethereum faces mixed signals as ETF inflows and a strong July performance support recovery, while technical resistance and downside risks...


Mercedes-Benz Accelerates EV Decarbonization With Recycled Aluminum
Mercedes-Benz expands its partnership with Hydro to accelerate supply chain decarbonization. Future electric vehicles will use Hydro CIRCAL aluminum containing...

Evotec and BioGaia Boost Biotech, while Vitrolife Disappoints
European stocks moved on earnings and broker actions. Evotec, BioGaia, Plus500, Pharming, Inwido, Amundi and Julius Baer rallied on upgrades,...
 |
|
 |  |
 |
|
-

 Business2 weeks ago
Dow Jones’ Record Run Faces Early Signs of Potential Shift
-
 Fintech3 days ago
French Fintech in 2026: A More Selective Market Driven by Mega-Rounds, Consolidation, and Sector Maturity
-

 Fintech1 week ago
AI Agents Transform Payments as Visa, Mastercard, and Qonto Tackle Trust, Liability, and Regulation
-

 Cannabis6 days ago
Namibia Cannabis Activists Seek Political Path After Legal Setbacks