Markets
The Magnificent Seven Bubble: Does It Resemble the Dot.com Bubble
Canada’s job numbers looked rosy but underneath not so rosy. The S&P 500 along with the Dow Jones Industrials (DJI) plus a few others continue to reach new highs. The Magnificent Seven rally of 2023/2024 continues. One for the history books. In Canada, for example, Constellation Software Inc. completed several acquisitions, and announced increased revenue, higher net income, and expanded cash flows.

It’s not 600 basis points, but it’s almost 300 basis points and at the highest level since 2007 at the peak of the housing bubble before the sub-prime crisis broke in 2008. It’s nowhere near where it was in the early 1980s when the 30-year soared to over 15%. And people think rates are high today. The 30-year, so far, peaked at 5.11%.
30-Year U.S. Treasury Yield – S&P 500 Yield Index
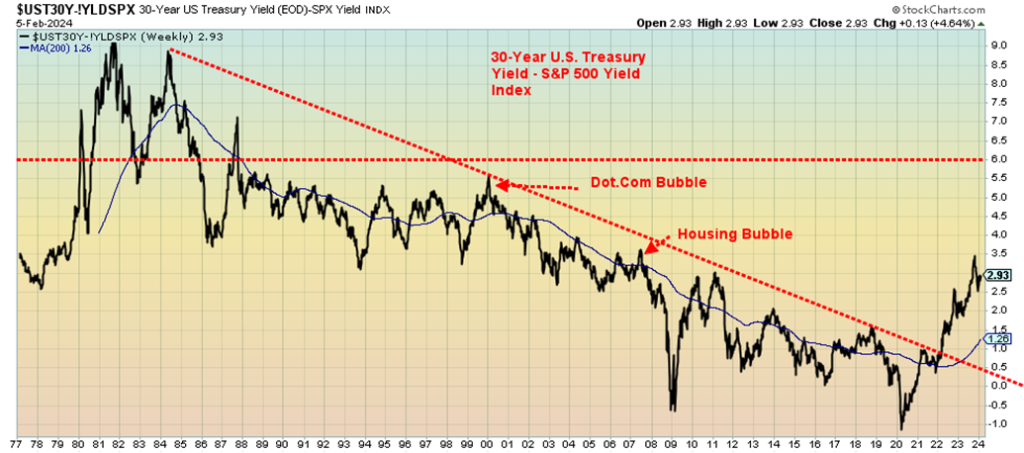
But it was yields that came crashing down in the early 1980s, thanks to Fed Chair Volcker creating the steepest recession since the 1930s raising rates to 20%. They soared again before the 1987 stock market crash and the spread widened again before the popping of the late 1990s dot.com bubble.
Now we have another bubble. The Magnificent Seven bubble or, as some are saying now, the Magnificent Six because of the fall from grace of Tesla. With Tesla falling, Elon Musk has now fallen to only the third wealthiest person on earth. Bit of a comedown. However, he won’t be checking into a food bank anytime soon. The definition of what might constitute stocks being overpriced might have changed slightly since Peter Lynch made that statement. At almost 300 basis points it is challenging those earlier peaks.
Canada Job Numbers
Canada Employed Persons, Unemployed Persons 2019-2024
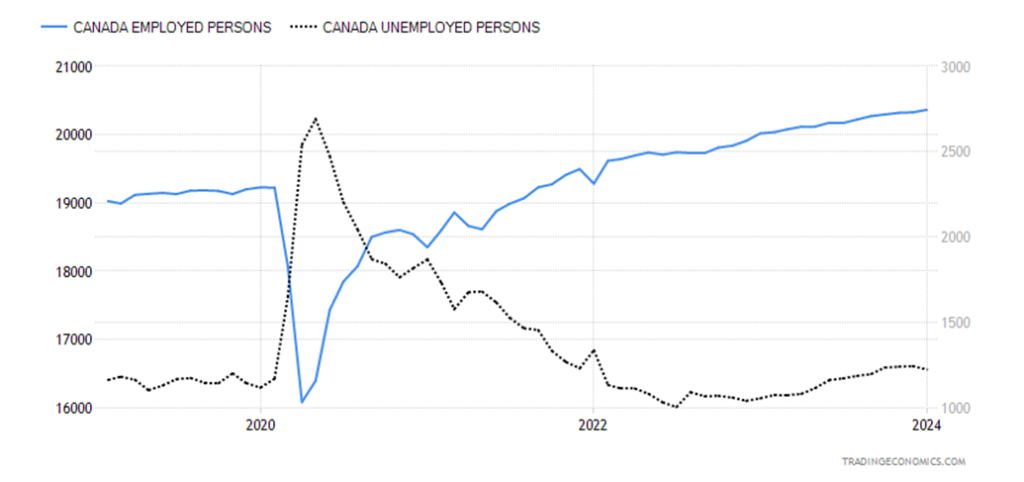
Canada is booming. Or so it seems. Another gang buster employment number for January as 37,300 new jobs were added. Better December was revised upwards to 12,300. The market had expected only 15,000 new jobs. The number of people employed now rises to 20,362,200, up from 20,324,900, while the number of people unemployed fell to 1,224,600 from 1,243,800.
The unemployment rate fell to 5.7% from 5.8% while the employment rate slipped to 61.6% from 61.7%, mostly because the labour force rose thanks to a rise in immigration. The market had expected an unemployment rate of 5.9%. The labour force participation rate also slipped to 65.3% from 65.5%. That all helped the unemployment rate fall. The R8 unemployment rate, the highest reported by Statistics Canada rose to 8.4% from 7.3%. The R8 is adds in discouraged searchers and the waiting group of part-timers.
All sounds good, except full-time employment actually fell by 11,600 while part-time employment rose by 48,900. More part-time, less full-time which means lower wages as well. That means that R8 number is not a good sign as in behind-the-scenes things are deteriorating. This could be exemplified by BCE Inc. announcing they are laying off 9% of their workforce.
Wage growth for full-time employment also fell to 5.3% vs. 5.7% a month earlier. That could help the inflation rate. Tiff Macklen kept the BofC rate at 5% and some are still speculating he’ll cut later in the year. But that could depend on as well on what the Fed does. No surprise that the higher rates are biting as bankruptcies, both commercial and consumer, are rising. Along with defaults on pre-purchased condos and more.
Gee, how did the boomers survive 20% rates back in the late 70s and early 80s? And we also remember the great real estate bust of the early 90s that brought down Confederation Life Insurance Co. (CLIC), one of the largest life insurance companies in Canada at the time. CLIC fell because of its overexposure to commercial real estate, as CLIC was known at the time as the commercial real estate lender of last resort.
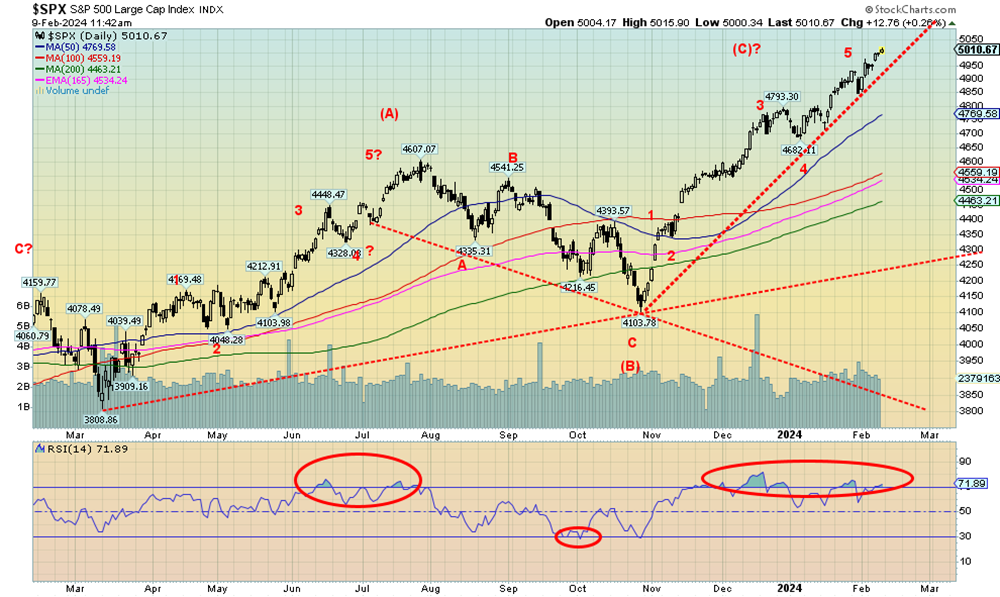
Up, up, and away. We can fly. Seems there is no stopping the advance. S&P 500 5,000. Overbought? Who cares. In a bubble? Who cares. Still, everyone will chase it because PMs (portfolio managers) know that if they don’t have it their results will be terrible. So just buy the Magnificent Seven, er Magnificent Six, because if you don’t own it, you could lose your job.
We read Mark Zukerberg of Meta added $28 billion to his wealth in a nano-second recently. Okay, maybe not a nano-second but pretty quickly. He’s trying to catch up to Elon Musk who is actually falling because Tesla isn’t doing well. It’s Nvidia leading the pack, up 44% so far in 2024. Meta has gained 33%. Tesla has fallen 23% despite recovering a bit of late. It is said that the Magnificent Seven represents 29% of the S&P 500. No wonder it keeps going up.
Yes, Elon Musk is no longer the richest person in the world, having fallen to Bernard Arnault & Family of France. He’s now number 2. Who remembers number 2? Remember Basil Exposition #2 (Robert Wagner) behind Dr. Evil (Mike Myers) in the Austin Powers films? Worse, he was just called #2. David Thomson and family are listed as #21, the richest Canadian.
The poor Thomsons are only worth about $65 billion. You won’t find them at Walmart. Arnault? About $220 billion or about the size of Algeria. Poor Elon at #2 is about the size of Hungary. The Thomsons? About the size of the DR Congo. Even just someone with a billion net worth is the size of St. Vincent and the Grenadines.
Yes, the U.S. economy is doing well. Consumer confidence is up. Compared to most other countries, nothing seems to stop the U.S. economy. No wonder the U.S. dollar has been rising as the US$ Index is now over 104 and climbing. That’s not too good for gold. If the holders of the Magnificent Seven are laughing all the way to the bank, the gold bugs are sinking in their stupor.
Yes, well, we saw that in 1999 too. Then things changed. For the next decade, stocks suffered or at best tread water (the lucky ones) but gold soared. They switched places. The same feeling exists today.
New all-time highs was a theme for the week but again the rise is narrow. The S&P 500 gained 1.4%, the Dow Jones Industrials (DJI) despite new all-time highs was actually flat while the Dow Jones Transportations (DJT) is nowhere near its highs but gained 2.6%. The significant Dow Theory divergence continues. The NASDAQ hit new 52-week highs but not new all-time highs, up 2.3%. Those hitting all-time highs included the NY FANG Index, up 3.2% this past week, the NASDAQ 100 up 1.8%, the Russell 1000 up 1.4%, the Russell 3000 up 1.6%, and the Wilshire 5000 up 1.5%.
In Canada, the TSX Composite fell, losing 0.4%, led by Metals & Mining (TGM), down 3.3%. The TSX Venture Exchange (CDNX) lost 1.9%. In the EU, the London FTSE fell 0.6%, the EuroNext went to new all-time highs, up 1.4%, as did the German DAX up just under 0.1%. The Paris CAC 40 gained 0.7% but fell short of new highs. In Asia, the Shanghai Index (SSEC) bounced back up almost 5.0% while the Tokyo Nikkei Dow (TKN) hit new 52-week highs, up 2.7% and Hong Kong’s Hang Seng (HSI) was up 1.4%.
The runaway rally continues. We are not sure how high we are going to go. The dot.com bubble peaked in March 2000. But with overbought levels prevalent, this market could turn unexpectedly to the downside. So, we are at the stage of buyer beware. We await the top headline of nothing will stop the bull market of 2023/2024. Any headline, though, is ignoring that this has really been a Magnificent Seven rally led by Nvidia.
Gold has been miserable. Well, actually not that miserable as it remains within about 5% of its all-time high of $2,152. Now silver has been miserable, still down about 55% from its all-time high near $50 set way back in 1980 and equalled in 2011. The stocks? Even more miserable. The Gold Bugs Index (HUI) remains down about 67% from its all-time high and the TSX Gold Index (TGD) is down about 45% from its all-time high both set back in 2011.
Junior mining stocks? Depression is the only way to describe them. And don’t forget those numbers are on a nominal basis. On an inflation-adjusted basis it’s even worse. Yet the sector is the most overlooked and undervalued we know of. How the entire sector is not bankrupt is a miracle. And that gives us hope as it doesn’t stay that way forever. Given it is such a small sector, even a small amount of funds tossed its way could set it soaring to new heights. Compared to the Magnificent Seven, those companies could gobble up the entire gold mining sector two, three times or more over. And still have change left over.
Gold itself has been the only strong part of the sector, thanks to central banks continuing to add to their reserves and people, particularly in China and India, buying because they recognize it as a long-term store of value. Gold itself is rare, yet it represents about 3.0% of global financial assets. In 1960 it represented about 5.0% of global assets. But that’s just all the gold ever mined.
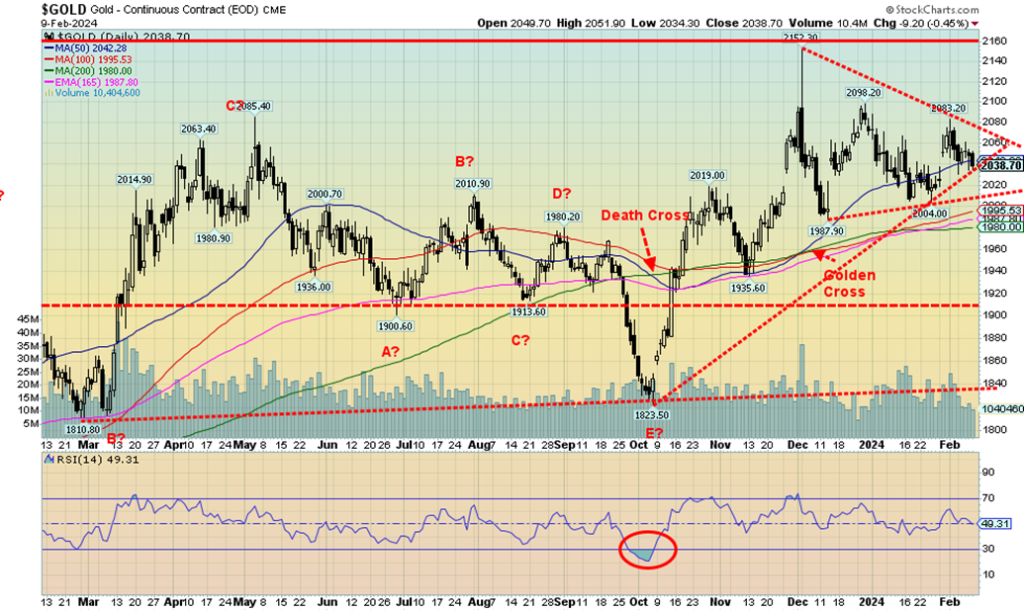
On the week, gold fell 0.7%. Silver, despite performing well for the last two days was still down 0.9% on the week. Platinum was dumped, down 2.6%, while for the near precious metals, palladium fell 8.4% and copper was down 3.7%. The gold stocks are looking as if they could see new lows below the October low as the Gold Bugs Index (HUI) fell 3.7% while the TSX Gold Index (TGD) dropped 3.8%. Technically both indices have surpassed the point where the indication is that they could see new lows. The Gold Miners Bullish Percent Index (BPGDM) has fallen to 25, which is now starting to break into oversold territory. But it is nowhere near its lows near zero seen in 2015 at the major low.
We should note WTI oil that jumped once again on geopolitical concerns, gaining 6.3% while Brent crude was back over $80, up 5.9%. Natural gas (NG) is being plagued with warm weather and plunged to new 52-week lows at $1.85, losing 11.1% and the EU NG at the Dutch Hub fell 7.4%. The energy stocks held in with the ARCA Oil & Gas stocks (XOI) up 0.5% while the TSX Energy Index (TEN) gained 1.3%.
The energy indices are driven more by oil then they are by gas. WTI oil still needs to break above $80 to suggest to us that we are headed higher. Geopolitical concerns are driving the market with the situation in Gaza deteriorating and some, particularly in the U.S., who want to bomb Iran. That would in turn jeopardize the Straits of Hormuz where 30% of the world’s global supply of oil passes through. This would happen despite record of amounts of oil being pumped in the U.S. and Canada, and Canada’s rising exports of oil to the U.S.
Technically, gold is caught in a forming symmetrical triangle. If this is actually a descending triangle then gold could be in trouble. The triangle is not fully clear it is a symmetrical triangle. A dangerous descending triangle (flat bottom, descending highs) suggests we could fall down through $2,000. Under $2,030 we are still in the triangle. The triangle currently goes down to about $2,010. A break under $2,000 could be more dangerous and, technically, the triangle says we could fall to about $1,840. If we did that, it could form a very significant multi-year low.
The breakout is around $2,080 but to be safe above $2,100. Then we could rise to $2,250. Our problem with the forming triangle and what preceded it is that it all looks corrective. If that is correct, then a breakdown becomes more likely than a breakout. These next few weeks could be key for gold. Geopolitical concerns could spark the breakout as global tensions rise. Any easing could have the opposite effect.
A strong US$ Index is not helping gold, even as the US$ Index was up only a small 0.2% this past week. Interest rates are rising again as the U.S. 10-year Treasury note rose to 4.18% up from 4.02%. The Government of Canada 10-year bond (CGB) also jumped up to 3.55% from 3.38%. All this despite the 2-10 spreads narrowing further, signaling that we are getting closer to a recession despite the still strong economic numbers. The Fed and the BofC are keeping rates as is, but many still expect cuts later in the year. But strong economic data, coupled with rising interest rates, isn’t leading to cuts anytime soon.
Markets & Trends
| % Gains (Losses) Trends | ||||||||
| Close Dec 31/23 | Close Feb 9, 2024 | Week | YTD | Daily (Short Term) | Weekly (Intermediate) | Monthly (Long Term) | ||
| Stock Market Indices | ||||||||
| S&P 500 | 4,769.83 | 5,026.61 (new highs)* | 1.4% | 5.4% | up | up | up | |
| Dow Jones Industrials | 37,689.54 | 38,671.69 (new highs)* | flat | 2.6% | up | up | up | |
| Dow Jones Transport | 15,898.85 | 16,216.50 | 2.6% | 2.0% | up | up | up | |
| NASDAQ | 15,011.35 | 15,990.66 (new highs) | 2.3% | 6.5% | up | up | up | |
| S&P/TSX Composite | 20,958.54 | 21,009.60 | (0.4)% | 0.2% | up | up | up | |
| S&P/TSX Venture (CDNX) | 552.90 | 546.59 | (1.9)% | (1.1)% | down (weak) | down (weak) | down | |
| S&P 600 (small) | 1,318.26 | 1,288.34 | 1.2% | (2.3)% | up | up | up (weak) | |
| MSCI World | 2,260.96 | 2,239.69 | (0.4)% | (0.9)% | up | up | up (weak) | |
| Bitcoin | 41,987.29 | 47,445.98 | 10.3% | 13.0% | up | up | up | |
| Gold Mining Stock Indices | ||||||||
| Gold Bugs Index (HUI) | 243.31 | 211.00 | (3.7)% | (13.3)% | down | down | down | |
| TSX Gold Index (TGD) | 284.56 | 252.17 | (3.8)% | (11.4)% | down | down | down | |
| % | ||||||||
| U.S. 10-Year Treasury Bond yield | 3.87% | 4.18% | 4.0% | 8.0% | ||||
| Cdn. 10-Year Bond CGB yield | 3.11% | 3.55% | 5.0% | 14.2% | ||||
| Recession Watch Spreads | ||||||||
| U.S. 2-year 10-year Treasury spread | (0.38)% | (0.30)% | 14.3% | 21.1% | ||||
| Cdn 2-year 10-year CGB spread | (0.78)% | (0.67)% | 1.5% | 14.1% | ||||
| Currencies | ||||||||
| US$ Index | 101.03 | 104.08 | 0.2% | 3.0% | up | up (weak) | up (weak) | |
| Canadian $ | 75.60 | 74.30 | flat | (1.7)% | down | neutral | down | |
| Euro | 110.36 | 107.88 | flat | (2.3)% | down | neutral | down (weak) | |
| Swiss Franc | 118.84 | 114.34 | (0.9)% | (3.8)% | down | up | up | |
| British Pound | 127.31 | 126.33 | flat | (0.8)% | down | neutral | neutral | |
| Japanese Yen | 70.91 | 66.99 | (0.6)% | (5.5)% | down | down | down | |
| Precious Metals | ||||||||
| Gold | 2,071.80 | 2,038.70 | (0.7)% | (1.6)% | neutral | up | up | |
| Silver | 24.09 | 22.59 | (0.9)% | (6.2)% | down | down | neutral | |
| Platinum | 1,023.20 | 878.20 | (2.6)% | (14.2)% | down | down | down | |
| Base Metals | ||||||||
| Palladium | 1,140.20 | 869.30 | (8.4)% | (23.8)% | down | down | down | |
| Copper | 3.89 | 3.68 | (3.7)% | (5.4)% | down | down (weak) | down | |
| Energy | ||||||||
| WTI Oil | 71.70 | 76.84 | 6.3% | 7.1% | up | down (weak) | neutral | |
| Nat Gas | 2.56 | 1.85 (new lows) | (11.1)% | (27.7)% | down | down | down | |
New highs/lows refer to new 52-week highs/lows and, in some cases, all-time highs
__
(Featured image by Matthew Manuel via Unsplash)
DISCLAIMER: This article was written by a third party contributor and does not reflect the opinion of Born2Invest, its management, staff or its associates. Please review our disclaimer for more information.
This article may include forward-looking statements. These forward-looking statements generally are identified by the words “believe,” “project,” “estimate,” “become,” “plan,” “will,” and similar expressions. These forward-looking statements involve known and unknown risks as well as uncertainties, including those discussed in the following cautionary statements and elsewhere in this article and on this site. Although the Company may believe that its expectations are based on reasonable assumptions, the actual results that the Company may achieve may differ materially from any forward-looking statements, which reflect the opinions of the management of the Company only as of the date hereof. Additionally, please make sure to read these important disclosures.
Copyright David Chapman 2024
David Chapman is not a registered advisory service and is not an exempt market dealer (EMD) nor a licensed financial advisor. He does not and cannot give individualised market advice. David Chapman has worked in the financial industry for over 40 years including large financial corporations, banks, and investment dealers. The information in this newsletter is intended only for informational and educational purposes. It should not be construed as an offer, a solicitation of an offer or sale of any security. Every effort is made to provide accurate and complete information. However, we cannot guarantee that there will be no errors. We make no claims, promises or guarantees about the accuracy, completeness, or adequacy of the contents of this commentary and expressly disclaim liability for errors and omissions in the contents of this commentary. David Chapman will always use his best efforts to ensure the accuracy and timeliness of all information. The reader assumes all risk when trading in securities and David Chapman advises consulting a licensed professional financial advisor or portfolio manager such as Enriched Investing Incorporated before proceeding with any trade or idea presented in this newsletter. David Chapman may own shares in companies mentioned in this newsletter. Before making an investment, prospective investors should review each security’s offering documents which summarize the objectives, fees, expenses and associated risks. David Chapman shares his ideas and opinions for informational and educational purposes only and expects the reader to perform due diligence before considering a position in any security. That includes consulting with your own licensed professional financial advisor such as Enriched Investing Incorporated. Performance is not guaranteed, values change frequently, and past performance may not be repeated.


TopRanked.io Weekly Affiliate Digest: What’s Hot in Affiliate Marketing [Changelly Affiliate Program]
It's official. TikTok is (potentially) dead. And, if you believe the news, that's gonna destroy thousands of small businesses and...


Terre et Lac Launches Crowdfunding for a Photovoltaic Power Plant
Terre et Lac, a Lyon-based company, launches a crowdfunding campaign for a solar plant in Voreppe. Residents of Isère and...


Qonto, Ledger, and Younited Credit, Leading Trio of the French Fintech Ecosystem
Qonto emerges as the top fintech in the latest rankings after its successful Series D funding. The 2024 Fintech 100...


Cannabis Clubs: Germany Introduces Strict Regulations
Germany introduces new regulations aimed at tightening control over cannabis clubs, following recent reforms. The Cannabis Act (CanG) allows limited...


Merck Invests Over 300 Million Euros in a New Research Center in Germany
Merck invests over 300 million euros in a new biotech research center in Germany, part of a larger 1.5 billion...
 |
|
 |  |
 |
|
-

 Crypto2 weeks ago
Solana Rolls Out First Update to Address the Problem of Failed Transactions
-

 Crowdfunding3 days ago
The French Real Estate Crowdfunding is Going through First Crisis
-

 Fintech1 week ago
Starting from 2025, Expected Revenues Will Exceed Investments in the Fintech Sector
-

 Impact Investing6 days ago
Loyal Is Working on a Drug to Extend the Life of Dogs