Business
The markets continued their relentless climb with new all-time highs once again
Gold, Bitcoin. Are they the same? Bitcoin has been soaring. Gold not so much. The Scoop looks at the Bitcoin phenomenon. Is it the new gold as some are claiming? Our “Chart of the Week” looks at rising interest rates at the long end of the curve. There is history here and it happens with some regularity. The other big event of the week was the cold snap in Texas and the ensuing chaos.

Gold continues to be the best performing asset thus far in this century. Okay, we have to set aside Bitcoin, which is up a mind-boggling 20,600% + since its inception back in 2015. Indeed, Bitcoin is being hailed as the best performing asset of the past decade. Some are even saying it’s the best performing asset ever. But is it an asset? Or merely a speculative vehicle? Like tulip mania in 1634–1637. But tulip fever saw tulips rise only 5,900% to its top. More appropriate might be a stock called eDigital (EDIG) that soared 45,000% back in the late 1990s as a part of the dot.com bubble. EDIG subsequently fell 95% and, since it doesn’t seem to exist any longer, it fell 100%. Bre-X Minerals (BMX) rose over 13,000% at its peak in the mid-1990s during a brief gold mining craze. Bre-X also no longer exists. Bubbles and crazes are a regular occurrence and history tells us that they all end badly. Except, of course, a few speculators always get through with huge profits.
We can’t speculate as to whether Bitcoin will go the way of EDIG and Bre-X, but we do note that gold has been around and used as money and a store of value for over 3,000 years. Quite simply, there is no basis for comparing Bitcoin to gold as some would like do. Bitcoin is not a store of value. Bitcoin is unregulated. Bitcoin is not held by any central banks. There are those who believe, however, that Bitcoin and cryptocurrencies will eventually become a part of central bank reserves. But 3,000 years from now gold will still be around. Will Bitcoin?
Mysia, Kyzikos circa 600-550 BC, EL Stater

Note: Kyzikos or Cyzicus was an ancient town in Mysia in Anatolia (modern day Turkey) on the Sea of Marmara.
Electrum is a naturally occurring alloy of gold and silver. This is fairly large for type at 16.05 grams. It depicts the head of a tunny fish and tunny fish below (aka: tuna). Sold for US$6,000. This one would be from what was known as the Archaic period of Ancient Greece.
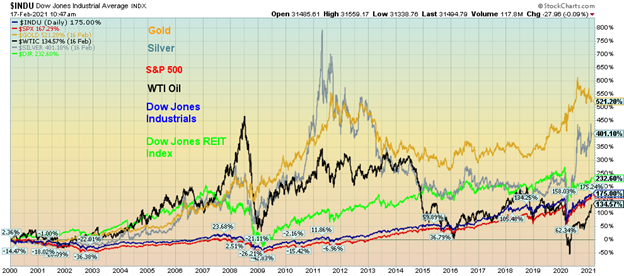
Investors like to focus on the now, and right now gold has been falling. Gold has fallen over 6% so far in 2021 vs. the S&P 500 up about 4%. Bitcoin is up about 80%. Oddly, the other precious metals are up. Silver is up about 3%, platinum up over 15%, and even copper (which has some precious metals characteristics) is up roughly 8%. In both bull and bear markets silver (and even platinum and copper) tends to lead. During the 2008–2011 bull market, silver soared almost 400% at its peak in April 2011. Silver peaked a good four months before gold (August/September 2011). Gold at its peak was only up about 160%. Silver made a lower high when gold peaked, telegraphing us with a divergence that eventually proved fatal for the precious metals, although not until 2013.
Gold is a hard asset. Bitcoin is a virtual asset. All the above-ground gold in the world of roughly 5.9 billion troy ounces (183 thousand metric tonnes) is worth approximately $10.6 trillion. Upwards of 20% of the gold is held in central banks. A big chunk of the rest is in jewellery and coins. But gold is also used in electronics, medicine, dentistry, space exploration, and more. But what can Bitcoin be used for? Well, it can be used to purchase some goods but it is not widely accepted. Its acceptance could grow. Bitcoin also consumes a huge amount of energy, more than many countries. While Bitcoin may be virtual and away from the eyes of regulators, it is incredibly dirty. Bitcoin’s biggest contribution may be the Blockchain technology. Blockchain is moving beyond Bitcoin.
Yes, Bitcoin is now just over a $1 trillion market cap, given its 18.6 million circulating supply. While there are over 57,000 metric tonnes of potential reserves of gold in the ground, Bitcoin’s circulating supply is to be eventually capped at 21 million, a level it is supposed to reach in 2140. To reach the value of all of the gold, Bitcoin would have to rise to over $500,000. Given the current mania for Bitcoin, we have seen predictions of $100,000 and over $300,000, with one analyst even calling for a $1 million. Bitcoin is being described as the gold for the 21st century. This is especially the case since institutional investors and investment banks are now leaping into the digital universe. Bitcoin is being called digital gold.

Gold trades on well-established platforms around the world 24/7. Bitcoin does as well but the platforms are still in their infancy. Platforms include TradeStation, Coinbase, e Toro, Kraken, Bittrex, Gemini, and Robinhood. There is a major question concerning the safety of trading Bitcoin and other cryptocurrencies. Since its inception, scandals have been numerous. We can only call out their names: Mount Gox (where $460 million was lost), Silk Road, Singapore scandal, CoinOne margin trading scandal, plus others. Millions were lost. Plus, we’ve heard horror stories of people losing their password and being unable to recover their account. While some consider gold to be a barbaric relic and, occasionally, we hear about some scandal about gold, none have surpassed the Bitcoin and cryptocurrency scandals where millions have been lost. Trading gold is transparent. It is difficult to transfer fake gold.
Trading with Bitcoin is the wild, wild west. It’s a fairy tale. But with institutions and others jumping into the fray, is it about to go mainstream and become respectable? A year ago, Bitcoin was $10,000. Now it is over $50,000. An ETF has come out. The ETF is managed by Purpose Financial LP and it will trade on the Toronto Stock Exchange (TSX) under the symbol BTCC. It sold some $260 million on the first day of trading. Another ETF provider, Evolve Funds Group Inc. also announced an ETF to start trading on the TSX under the symbol EBIT. There are other closed-end funds involved in Bitcoin. All cite how the involvement of institutions and the growth of the infrastructure has made trading Bitcoin and other cryptocurrencies respectable. It didn’t hurt when Elon Musk purchased $1.5 billion of Bitcoin and is apparently now sitting on an estimated $700,000 profit.
ETFs sound great because they typically have low management fees. But ETFs can trade at significant discounts or premiums to the net asset value. With a potentially volatile ETF like Bitcoin, these swings could easily be as high as 40%. And, given a propensity to trade on margin, will traders be able to deal with the volatility, especially if it results in margin calls they cannot meet?
Bitcoin, like gold, is not correlated to mainstream assets such as stocks and bonds. In that respect it is similar to gold and silver. But, like any currency—if one chooses to call Bitcoin a currency—it is a fiat currency backed by nothing. It is also extremely volatile; the volatility in the stock market pales in comparison. And what if the power goes down (see Texas) for an extended period? Or the wi-fi is not available? At least in owning physical gold and silver it remains readily available. And what if the regulatory environment changes, preventing or at least pausing the use of cryptos? India is banning cryptocurrencies. The taxation of cryptos is up in the air because of its anonymous ownership. Surprisingly, Bitcoin can only process 4 transactions per second. Visa can process 1,750 transactions per second.
What we are witnessing with Bitcoin and, no doubt, the other cryptocurrencies as well is a blow-off. Expectations keep growing and the forecasts are “to the moon and beyond.” We can’t even predict a top for Bitcoin. It has become impossible and it is extremely volatile. Bitcoin cannot be considered a currency despite some acceptance in lieu of currency. Governments control and regulate currency. Even those accepting Bitcoin for payment may have to quote a wide market to protect themselves. Selling that $100,000 automobile could quickly turn into a loss for the seller given the market volatility. Bitcoin is merely a speculative instrument. Or, if we want to be polite, it’s an instrument no different than a stock or a bond. But, given the volatility, one may wish to take the money and run if they have a profit. And—don’t lose your password. In this volatile environment your gain can quickly turn into a huge loss. Just remember that after rising to almost $20,000 in December 2017 Bitcoin collapsed, losing over 80%. It can happen again. Caveat emptor.
The Pandemic Rages On!
The pace of cases has slowed down leading many to believe the worst is over and we can soon with the help of the vaccines return to normal. But new variants are being discovered and no one really knows what the impact might be. Will it be nothing or will it spark a huge jump in cases and deaths once again prompting yet another lockdown. Lockdown, open, cases and deaths rise, lockdown again, rinse repeat. Pandemics of this nature are never one and done. They can linger for years even decades coming and going. The U.S. passed a milestone this past week with over 500,000 dead.
Sunday February 21, 2021 – 15:52 GMT
World
Number of cases: 111,754,970
Number of deaths: 2,474,143
U.S.A.
Number of cases: 28,708,395
Number of deaths: 509,916
Canada
Number of cases: 843,301
Number of deaths: 21,630
Source: www.worldometers.info/coronavirus
Chart of the Week
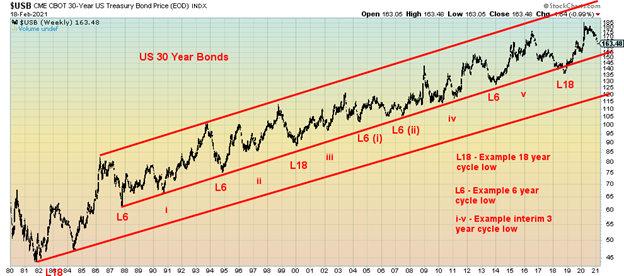
If there is one thing we like about watching the bond market, it is that bonds tend to have reasonably predictable cycles. As this long-term chart of the U.S. 30-year bonds (USB) demonstrates, the ups and downs seem to come in almost like clockwork. One thing that is amazing about this chart is the length of the rally from that important cyclical low seen back in 1981.
We are not sure whether there is any real long-term cycle in bond yields. We have seen one interesting chart at Gold Charts ‘R’ Us (www.goldchartsrus.com) that amazingly dates back to 1150 BC. It appears that from 1150 BC to 1344 AD there was a long downtrend in yields. This was followed by a period of a long up-trend that peaked in 1440. Another long downtrend got underway which bottomed in 1679. There was a short-lived spike in rates into the early 18th century before another downtrend got underway, bottoming in 1737. Since then, we generally witnessed up until 1814, down until 1889 except for a short-lived spike up to 1861, up until 1920, and then down until 1941. That started a huge uptrend that topped in 1981, coinciding with the low in prices noted above (prices move inversely to yields).
If there is one thing we did observe, it’s that periods of rising commodity prices accompanied by spikes in inflation tend to accompany rising bond yields since the late 18th century. This explains spikes seen into 1790 (American Revolution), 1814 (War of 1812), 1861 (U.S. Civil War), 1920 (WW1), and 1981 (Vietnam, Arab oil crisis).
Since 1981 bond yields, or in this case prices as shown above have demonstrated an 18-year cycle with lows in 1999/2000 (19 years) and again in 2018 (18 years) (shown on the chart as L18). The 18-year cycle breaks down into three 6-year cycles (shown on the chart as L6). Counting again from 1981 we see lows in 1987, 1994, 2000, 2005/2007 double bottom, 2013, and 2018. The 6-year cycle has a range usually of 5–7 years.
The 6-year cycle usually breaks down into either two 3-year cycles or three 2-year cycles. We labeled those i-v on our chart. One we didn’t label was seen in 1984, roughly three years after the key long-term low of 1981. The low labeled iv appears to have been a double bottom or even three 2-year cycles. Given where we are in the cycle, the odds highly favour that we are now embarking on our interim 3-year cycle low. The next 6-year cycle low would be due in 2023–2025. For 40 years since 1981 we have held a solid uptrend line that really started with the low in 1987. If that is the case, then this current sell-off should bottom sometime later this year or early 2022, possibly in the 150–155 price range for the USB. That could imply a yield around 2.50% for the 30-year. The 10-year U.S. treasury note could rise to 2% which is where the 4-year MA is currently. Since 1981 the 4-year MA has generally held any rise in interest rates. Only once in 2018 did the 10-year yield rise much above the 4-year MA. That was also an 18-year cycle low.
If the 10-year yield were to rise significantly above the 4-year MA it could also be signaling that the long downtrend seen in bond yields since 1981 is over. We doubt that would happen given current and projected economic conditions, but it could happen especially if there were a sovereign debt crisis with U.S. debt.
Rising bond yields have potential knock-off effects on other yields from corporate bonds to mortgages as all tend to price themselves off the U.S. treasury curve. Stock markets often rise during the early stages of rising bond yields but eventually the negative effects kick in sparking a sharp stock market correction.
MARKETS AND TRENDS
| % Gains (Losses) Trends | ||||||||
| Close Dec 31/20 | Close Feb 19/21 | Week | YTD | Daily (Short Term) | Weekly (Intermediate) | Monthly (Long Term) | ||
| Stock Market Indices | ||||||||
| S&P 500 | 3,756.07 | 3,906.71 (new highs) | (0.7)% | 4.0% | up | up | up | |
| Dow Jones Industrials | 30,606.48 | 31,494.32 (new highs) | 0.1% | 2.9% | up | up | up | |
| Dow Jones Transports | 12,506.93 | 13,274.21 (new highs) | 0.8% | 6.1% | up | up | up | |
| NASDAQ | 12,888.28 | 13,874.46 (new highs) | (1.6)% | 7.7% | up | up | up | |
| S&P/TSX Composite | 17,433.36 | 18,384.27 (new highs) | (0.4)% | 5.5% | up | up | up | |
| S&P/TSX Venture (CDNX) | 875.36 | 1,098.56 (new highs) | 2.9% | 25.5% | up | up | up | |
| S&P 600 | 1,118.93 | 1,288.77 (new highs) | (0.7)% | 15.2% | up | up | up | |
| MSCI World Index | 2,140.71 | 2,230.17 (new highs) | 0.2% | 4.2% | up | up | up | |
| NYSE Bitcoin Index | 28,775.36 | 53,665.01(new highs) | 13.8% | 86.5% | up | up | up | |
| Gold Mining Stock Indices | ||||||||
| Gold Bugs Index (HUI) | 299.64 | 263.56 | (7.3)% | (12.0)% | down | down | up | |
| TSX Gold Index (TGD) | 315.29 | 281.14 | (7.3)% | (10.8)% | down | down | up | |
| Fixed Income Yields/Spreads | ||||||||
| U.S. 10-Year Treasury yield | 0.91 | 1.34% (new highs) | 10.7% | 47.3% | ||||
| Cdn. 10-Year Bond yield | 0.68 | 1.21% (new highs) | 17.5% | 77.9% | ||||
| Recession Watch Spreads | ||||||||
| U.S. 2-year 10-year Treasury spread | 0.79 | 1.23% (new highs) | 11.8% | 55.7% | ||||
| Cdn 2-year 10-year CGB spread | 0.48 | 0.98% (new highs) | 16.7% | 104.2% | ||||
| Currencies | ||||||||
| US$ Index | 89.89 | 90.36 | (0.1)% | 0.5% | neutral | down | down | |
| Canadian $ | 0.7830 | 0.7924 | 0.6% | 1.2% | up | up | up | |
| Euro | 122.39 | 121.14 | (0.1)% | (1.0)% | down (weak) | up | up | |
| Swiss Franc | 113.14 | 111.50 | (0.6)% | (0.9)% | down | up | up | |
| British Pound | 136.72 | 140.06 (new highs) | 1.1% | 2.4% | up | up | up | |
| Japanese Yen | 96.87 | 94.82 | (0.5)% | (2.1)% | down | neutral | up | |
| Precious Metals | ||||||||
| Gold | 1,895.10 | 1,777.40 | (2.5)% | (6.2)% | down | down | up | |
| Silver | 26.41 | 27.25 | (0.6)% | 3.2% | up | up | up | |
| Platinum | 1,079.20 | 1,293.10 (new highs) | 2.7% | 19.8% | up | up | up | |
| Base Metals | ||||||||
| Palladium | 2,453.80 | 2,369.20 | (0.6)% | (3.5)% | down | up (weak) | up | |
| Copper | 3.52 | 4.07 (new highs) | 7.1% | 15.6% | up | up | up | |
| Energy | ||||||||
| WTI Oil | 48.52 | 59.26 (new highs) | (0.4)% | 22.1% | up | up | up (weak) | |
| Natural Gas | 2.54 | 2.99 | 2.8% | 17.6% | up | up | up (weak) |
Note: For an explanation of the trends, see the glossary at the end of this article.
New highs/lows refer to new 52-week highs/lows and in some cases all-time highs.
It is amazing what $12 trillion can do. That’s the estimated amount of money that has been poured into the U.S. economy to prevent it from collapsing into the Great Depression II. In days of old there was no central bank and periods of what would be economic recessions then often turned into economic depressions. The 19th century was replete with it with constant recessions and depressions. Add in QE from the central bank plus interest rates at abnormally historically low levels and you have a recipe for a constantly rising stock market with minor interruptions along the way. And one panic in March 2020. This past week the S&P 500 made another all-time high but closed the week down 0.7%. Everybody, it seems, made all-time highs but closed lower. There were exceptions: the Dow Jones Transportations (DJT) made its all-time high (again) but closed up 0.8%. The Dow Jones Industrials (DJI) also managed to hold its gain, up 0.1%. But the NASDAQ fell 1.6% and the S&P 600 small cap dropped 0.7%.
Elsewhere, the TSX Composite couldn’t hold its all-time high and lost 0.4% but the TSX Venture Exchange (CDNX) made 52-week highs and closed up 2.9%. In the EU, the London FTSE slipped a small 0.1%, the Paris CAC 40 made new all-time highs and closed up 1.2%, but the German DAX did not make new all-time highs and fell 0.4%. In Asia, China’s Shanghai Index (SSEC) made 52-week highs and was up 1.1% and the Tokyo Nikkei Dow (TKN) also made 52-week highs and closed up 1.7%. The TKN closed over 30,000 for the first time since 1990. We can now see those all-time highs set in January 1990 at 38,900. Thirty-one years to break even. Okay, we are not there quite yet.
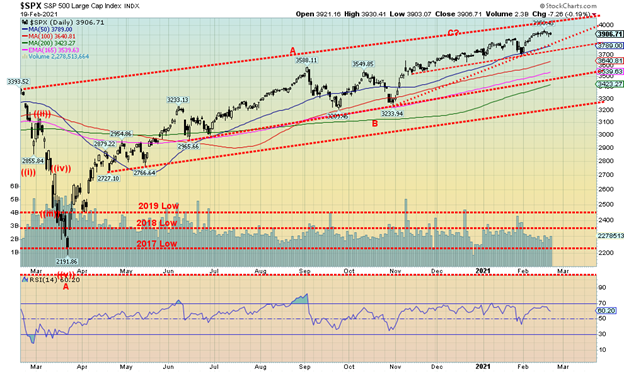
We have in the past seen weeks like this where we closed lower after making new all-time highs and it didn’t amount to much. But, like some of the other indices, the S&P 500 could be forming an ascending wedge triangle which is bearish. The breakdown point is currently near 3,800. Potential downside targets than could become 3200 and the October low. Confirmation of a breakdown underway would be under 3,700. A breakdown under 3,200 could spark a panic. But with so much money being thrown at the markets to prevent another Great Depression, any pullback might not be more than 4–5% as we have seen before. A bad pullback would be about 10%. There is certainly room to move higher in that bull channel with the top up just over 4,000. We have held that 4,000 to even 4,100 could be targets. But, given the current conditions, investors would be forgiven for being cautious. The worst thing would be everyone trying to bail at once and then you’d have March 2020 all over again. But one thing to note is that the shorts were spooked in the Robinhood/GameStop/Reddit upside panic and the number of shorts outstanding has actually fallen. That in some sense takes away potential buying power. As well, firms are not rushing to buy back their shares like they did in the past. Another source of buying power drying up. So, investors would be forgiven if they were wanting for a little bit of caution.
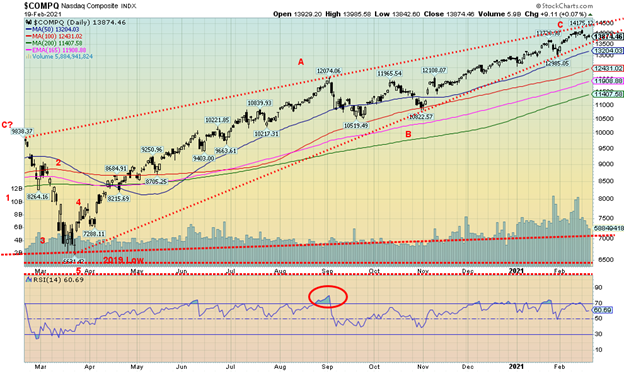
The NASDAQ continued its winning ways, once again hitting new all-time highs. But then things topped and reversed and the NASDAQ closed the week down 1.6%. Is this an important reversal? Hard to tell at this stage, but it could be signaling at least another short-term pullback. The FAANGs had a lousy week with Facebook down 3.3%, Apple off 4.1% (and could be breaking down from a head and shoulders top pattern targeting $110), Amazon off 0.9%, Netflix falling 2.9%, and Google dropping 0.1% after making new all-time highs. Microsoft dropped 1.6% after making new all-time highs, Tesla fell 4.3% but Twitter starred again, up 0.5% to new all-time highs. Berkshire Hathaway, the ultimate value stock, made new all-time highs but closed off 0.2%. We note how the NASDAQ touched the top of the bull channel before pulling back. Could the NASDAQ be making an ascending wedge triangle (bearish)? If so, the breakdown point can be seen at 13,500 and target down to 10,800 the October low. Confirmation of a breakdown would come under 12,985 the low seen in late January. The alternative, of course, is that we just crawl up that bull channel. But more likely, at least at minimum, another short-term pullback is getting underway. If, for whatever reason, we did fall to that October low and broke under it a panic could get underway.
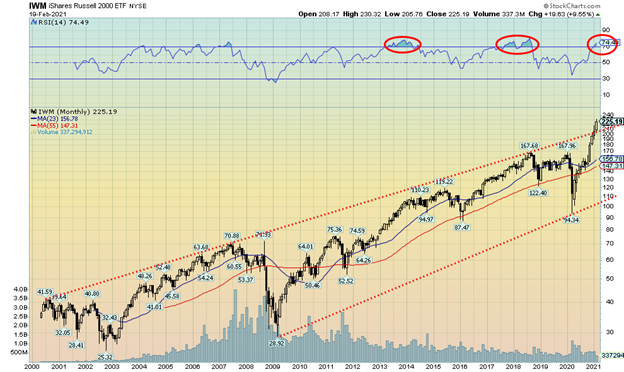
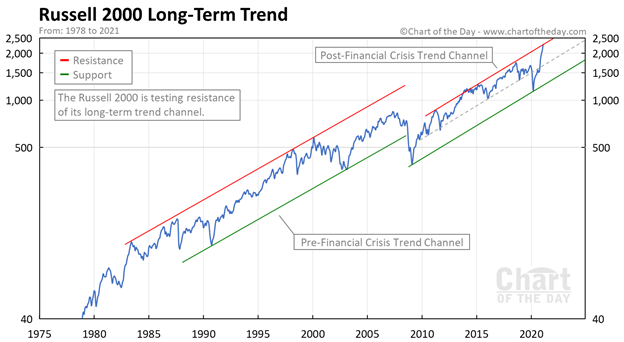
Is the Russell 2000 (small cap stocks) breaking out to the upside? This long-term chart of the Russell 2000 as represented by the iShares Russell 2000 ETF implies that the Russell is indeed breaking out above long-term resistance. Or is it a false breakout? This long-term chart from Chart of the Day (www.chartoftheday.com) implies it is not but merely hitting another long-term uptrend line.
Throwovers, as this would seem to imply, are not unusual in markets. The test is, can the Russell 2000 continue to march higher? Certainly, the small cap stocks have been strong and they often lead the way in a bull market (and in a bear market as well but to the downside). Since October 2020 the Russell 2000 has been outperforming the S&P 500 and it shows little sign of topping. The last major low of the Russell 2000:S&P 500 ratio was in March 2020. Since then, the ratio is up 45% in favour of the Russell 2000. If this should turn in favour of the S&P 500 it could be a sign that the market as a whole is topping.
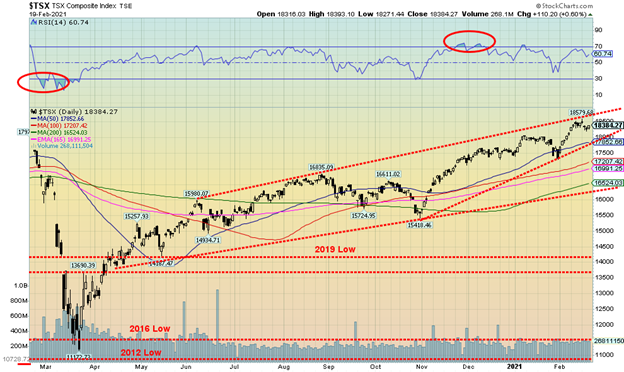
The TSX Composite continued its winning ways, once again making new all-time highs at 18,580. However, the gain was short-lived as the TSX closed the week down 0.4%. The small cap TSX Venture Exchange (CDNX) refused to follow, also making 52-week highs (again) but closing up 2.9% and now up 25.5% in 2021. Eight of the fourteen sub-indices fell on the week led by Gold (TGD), down 7.3%. Other leaders to the downside were Materials (TMT), off 3.9% and Consumer Staples (TCS), down 2.9%. Other losers were Industrials (TIN) down 1.0%, Real Estate (TRE) off 0.2%, Information Technology (TKK) down 1.1% after making new all-time highs, Telecommunications (TTS) down 1.9%, and Utilities (TUT) down 1.1%. The big winner was Energy up 2.5%, Financials (TFS) gaining 1.6%, Consumer Discretionary (TCD) up 2.0% and new highs, Income Trusts (TCM) up 0.5%, Metals & Mining (TGM) up 2.2% (copper, copper, copper), and Health Care (THC) up 2.1%.
The TSX hit the top of our bull channel before backing off this past week. We wonder whether the TSX is making an ascending wedge triangle (bearish). Its breakdown point is currently at 17,850 which roughly corresponds to the 50-day MA. A breakdown under that level could target down to a major support line just below 17,000. A breakdown under 17,000 would be far more bearish. If the TSX is to continue its rise, then the bull channel may act as resistance and instead the TSX would just crawl up the bull channel but not break through. But another 4% decline would not be unusual nor particularly earth-shattering.
U.S. 10-year Treasury Bond/Canadian 10-year Government Bond (CGB)
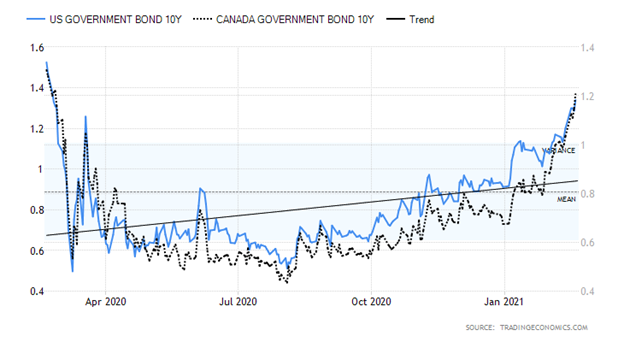
Bond yields continued their recent upward trek with the U.S. 10-year treasury note yield rising to 1.34%, up 10.7% this past week. The Canadian Government of Canada 10-year bond (CGB) rose to 1.21%, a 17.5% rise on the week. Spreads with the 2-year continued to rise with the U.S. 2–10 spread up to 123 bp and the Canadian 2–10 spread up to 98 bp. Wide spreads like this are music to banks’ ears.
U.S. interest rates are rising—well, in the long end of the curve, anyway. As one can see below, the 10-year and 30-year yields are rising, the 5-year yield is rising a bit while the 3-month and 2-year are relatively flat. It is the long end of the curve that is rising. The Fed controls the short end and is keeping rates flat, but the long end rates can rise even as the short end stays constant.
U.S. 10-year, 5-year, 30-year, 2-year and 3-month treasury yields
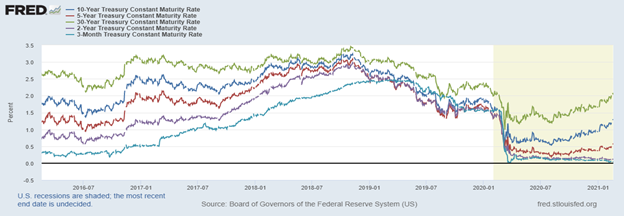
Why are U.S. long rates rising? The U.S. economy is showing signs of life and exhibiting strength above the EU and Japanese economies (but, note, not China’s). The U.S. dollar has been attracting fund flows and that goes into the stock and bond market for a higher return. Economic numbers of note this past week include these: January retail sales were better than expected, up 5.3% vs. a decline of 1% in December and expectations of a rise of 1.1%; retail sales ex-autos were up 5.9% vs. a decline of 1.8% and expectations of a rise of 1%; year over year retail sales were up 7.4% (but then so was population growth up 0.6%); the PPI for January was up 1.3% vs. 0.3% and expectations of up 0.4%; PPI year over year was up 1.7% vs. 0.8% and expectations of 0.9%; capacity utilization was 75.6% vs. 74.9%. On the slightly negative side, housing starts for January fell 6% when the expectation was only for a 0.7% decline; the Philly Fed Index was 23.1 vs. 26.5 in December and an expectation of 20; industrial production fell 1.8% vs. a December decline of 3.2% and the market expected a decline of 2.7%; weekly initial claims were up to 861,000 when the market expected only 765,000 and last week’s number was 848,000. Overall, however, it was a good week for economic numbers.
While a pause in the rise could be in order, the next stop would be a rise for the 10-year to 1.50% to 1.60%. We noted the potential to rise to 2.00%. Support is now down to 1.00% and more likely 1.10%. We are in a cyclical rise of interest rates and we do not appear to have topped yet.
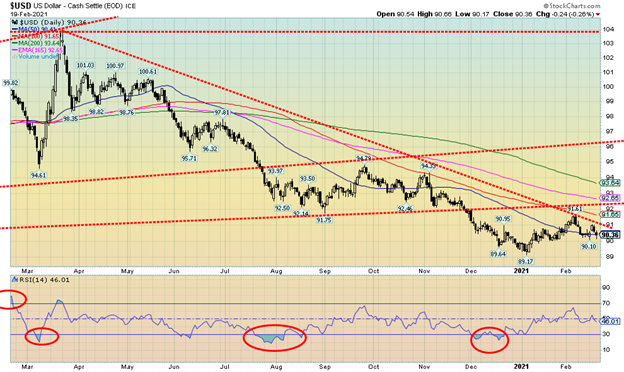
The US$ Index tried to rebound this week but it quickly ran out of steam and closed the week down a small 0.1%. The euro lost just over a ½% while the Swiss franc dropped almost 0.6%. But the flying U.K. pound sterling was up again, gaining 1.1% and moving to 52-week highs. The Japanese yen lost 0.5%. The Canadian dollar continued its recent strength, up 0.6%. However, we note that the Cdn$ could be making a double top.
The U.S. dollar has remained strong because of signs of an improving U.S. economy that is doing better than the struggling EU economy and Japanese economy, although not China’s. As well, and interest rates rising in the long end of the curve as bond yields are widening with their counterparts in the EU and Japan. It also helps that the U.S. stock market has remained strong as well. All of that has helped the U.S. dollar rebound of late. The US$ Index failed just below the 100-day MA and is currently trying to find support at the 50-day MA. That the US$ Index faltered this past week after trying to rebound again is a potential sign of weakness. Still, that is to be determined as we need to fall below 90 to convince us that we could go lower again. A rebound that carries us back over 91 would be bullish and suggest higher levels ahead. Overall, the US$ Index looks weak and our expectations are down. But we can’t eliminate upside just yet.
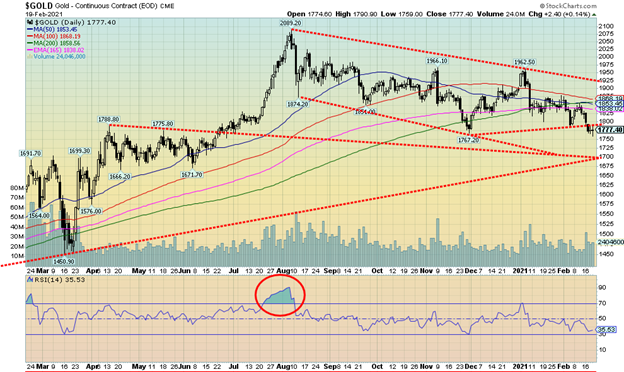
Gold can’t get out of the way of itself. This past week gold prices faltered once again, falling 2.5%. Silver was off 0.5% but platinum gained (again) to new 52-week highs up 2.7%. Palladium lost 0.6% but copper jumped to fresh 52-week highs, up 7.1% on the week (see notes on copper below). Gold broke down under what might be the neckline of a head and shoulders topping pattern. That pattern has potential targets down to $1,595. We are sure that no gold bugs want to hear that one. Minimum targets could be $1,748 with other targets seen at $1,698 and $1,720. If what we are doing is correcting the entire move from the March 2020 low at $1,450 to the August 2020 top at $2,089, then Fibonacci retracement levels are 38.2% – $1,845 (achieved), 50% – $1,770 (achieved) and 61.8% – $1,695. We note that there is major support near $1,700 given it is the bottom of the bear channel so we cannot rule out that zone as a potential target.
Gold has been falling for four reasons: signs of an improving U.S. economy, rising bond yields, a stronger than expected U.S. dollar, and signs of an improving global economy in the midst of the pandemic. We might add that the shift to Bitcoin isn’t helping as the focus is off gold and on to Bitcoin. Despite calls of oversold by some gold bugs, we note that we are not oversold so much that we don’t have room to move lower still. The bottom of that bear channel near $1,700 might act as a magnet. Ideally, we get a washout selloff followed by a reversal to the upside. That has signaled lows in the past. Overall, however, the long-term uptrend remains intact despite the current weakness.
To the upside we need first to regain above $1,800. There is a congestion resistance zone between $1,840 to $1,870 to overhaul next. Above $1,900 would be positive, but we need to take out that recent spike high at $1,962. Finally, we would need to regain above $2,000 to suggest new highs above the August high of $2,089. And on any plunge to the downside, our preference is to hold $1,700; otherwise, $1,595 might not be so unrealistic after all.
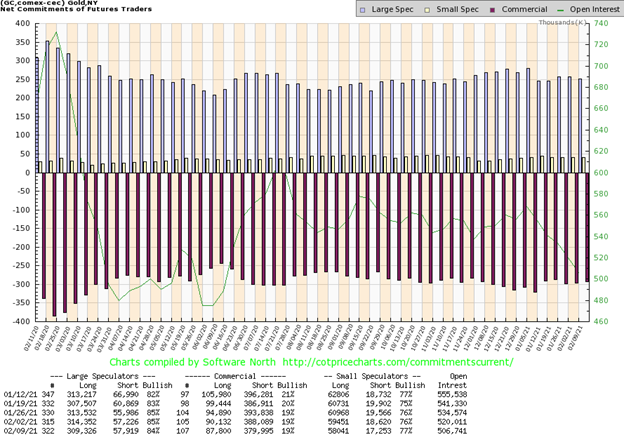
Once again, the gold commercial COT has remained steady at 19%. Long open interest fell just over 2,000 contracts this past week while short open interest was down just over 8,000 contracts. Open interest fell almost 14,000 contracts in a down week for gold. We consider that consistent with a corrective market. The large speculators COT (hedge funds, managed futures, etc.) slipped to 84% from 85%. Mostly it was their long positions that fell down around 5,000 contracts. The gold COT is still too bearish for our liking. Or is this the new norm?
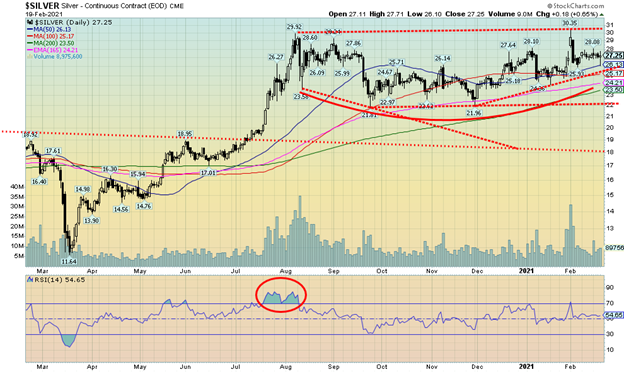
Silver prices slid 0.6% this past week. That’s the bad news. The good news is that was considerably less than the 2.5% decline for gold prices. But it paled beside the 2.7% for surging platinum prices. While we were not happy with silver prices falling, we are pleased to see silver maintain its firm lead over gold during this corrective period. Silver tends to lead in both rising and falling markets. That silver is holding up remarkably well during this period suggests to us that the bull market for precious metals remains alive. It’d be easy to argue that silver looks toppy here, especially given that the spike move to $30.35 appears as just that a spike top. Silver is holding an uptrend line from its November 2020 low of $21.96. Gold, on the other hand, put in a small new low below its November 2020 low this past week. Still, we don’t want to give a false impression that we are out of this just yet. We continue to read bearish reports how silver is going to fall to $18 or even lower. As long as we are holding now above $25.20 and the 100-day MA we should be okay. The 50-day MA is at $26.13 so that’s another key point. Above that we need to return back above $28 to suggest to us a test of the spike high at $30.35. Above $29.30 the odds favour new highs. Silver is fairly neutral here. If we have a concern it’s the ongoing weakness of gold prices. Silver appears to be pushed by demand, particularly in the green energy sector and short positions in the iShares Silver Trust (SLV).
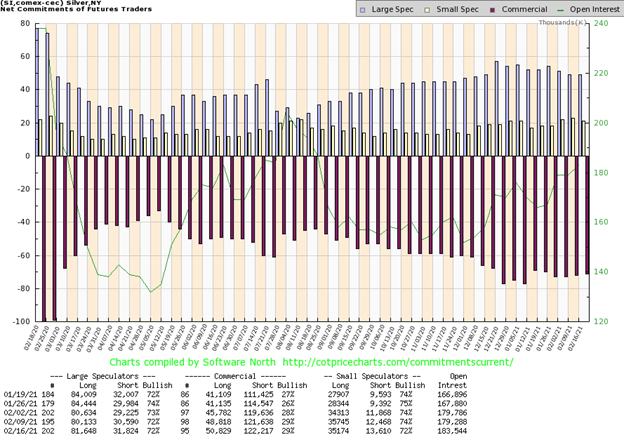
The silver commercial COT was steady this past week at 29%. There was little change in the make-up with the short open interest up only about 600 contracts while long open interest rose almost 2,000 contracts. Surprisingly, that didn’t change the over COT position. The large speculators COT was also steady at 72% with long open interest rising about 1,500 contracts and short open interest up about 1,300 contracts. Still somewhat bearish but holding steady. Open interest rose on a week when silver prices were relatively flat.
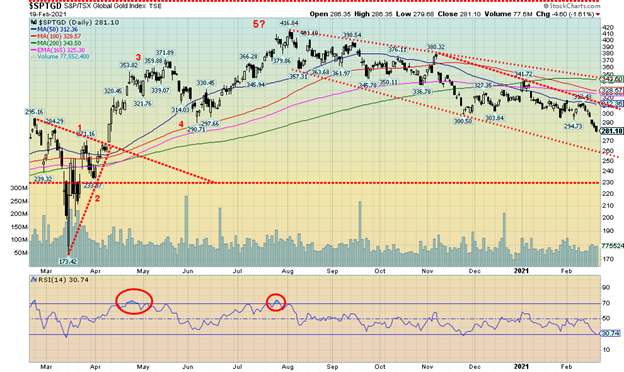
Oh, woe are the gold stocks. They have been somewhat miserable of late. This past week the TSX Gold Index (TGD) was a terrible performer, losing 7.3%. The Gold Bugs Index (HUI) did not want to feel left out so it too lost 7.3%. Both indices are now down on the year with the TGD off 10.8% and the HUI down 12.0%. The TGD is down 32.5% from its August 2020 high. The 38.2% retracement point for the rally from March 2020 to August 2020 is seen at 323.85. The 50% retracement point is at 295 and the 61.8% retracement point is at 266. The bottom of the bear channel can be seen at 260 so reaching that level is not impossible. The RSI has fallen to 30.74 which is oversold but not extremely so at this time. The Gold Miners Bullish Percentage Index (BPGDM) is currently at 37.93 which is low but again not extremely so. The result: both could go lower still. So far, the correction in the gold stocks appears to be fairly normal. During the 2008–2011 rally we had three pullbacks ranging from 21% to 25%. The long bull market that preceded that between 2001 to 2008 saw four corrections of 32% to 42%. Finally, the 2008 financial collapse saw the TGD drop 58%. So, this type of volatility is not unusual.
Support is clear down to around 260 and a drop to that level would not be a surprise. Major resistance is between 310–345. We are currently some 10% below the TGD’s 50-day MA so a rally back to that level would not be a surprise either. At this point we need to see a turnaround in gold prices to help the TGD recover. As we noted under gold, we could be seeing a low here soon.
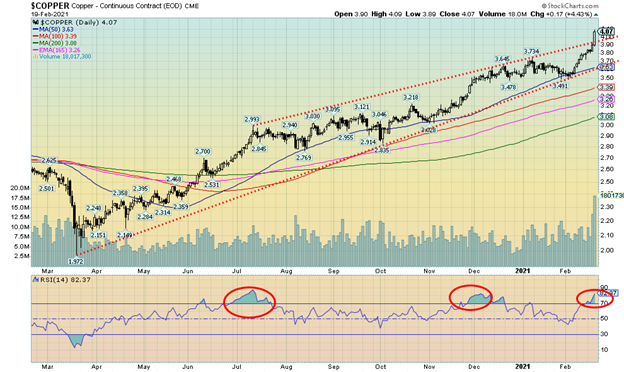
Copper has become a star. Copper rose 7.1% this past week and appears to be breaking out of a bull channel that has been in place since the March 2020 low of $1.97. Copper hit 52-week highs this past week at $4.09. Only the $4.65 high seen in 2010 seems to now be in the way. While we agree that copper appears to be breaking out of the bull channel, it could be what we call a throwover. Now and then we do see them where it appears it has broken out but it turns into a false breakout. We’d only know that was the case if copper were to reverse and go back down and close below $3.60 where the 50-day MA is currently. The last high was seen at $3.73 before the current rise got underway. So, we’d prefer to see that hold as well. We can’t help but notice that the RSI is now very overbought at about 83, so a pullback/consolidation would not be surprising nor unwelcome. We note as well that the commercial COT position is at 30%, the lowest level seen in weeks.
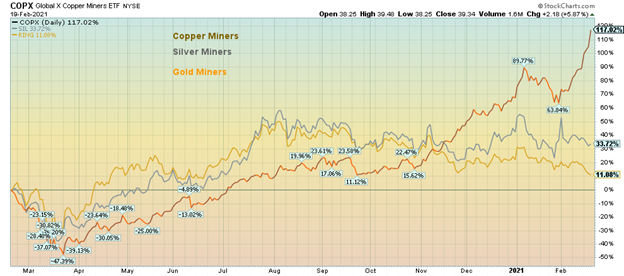
Comparatively speaking, copper mining stocks are outperforming both gold and silver (good suggestion to report this from Mike Ballanger). Here is a comparison performance between copper miners as represented by the Global X Copper Miners ETF (COPX), the Global X Silver Miners ETF (SIL), and the iShares MSCI Global Gold Miners ETF (RING). Copper miners lead up 117% in the past year, silver miners are up about 34%, and gold miners lag, up only about 11%. Yet the copper miners are under-owned and the gold miners are over-owned. For comparison’s sake, the S&P 500 is up just over 15% and the TSX Composite is up roughly 2.6% in the same time period. Naturally, that includes the crash of March 2020 where the drawdowns were quite severe. Copper really took off in November. One can see that gold and silver topped back in July/August 2020.
Where not to be right now—Texas. Texas seemed to be the main oil and gas story of the week. The state was frozen in with historic grid failures, primarily, it seems because of the failure to weatherize the power generating assets, resulting in wellhead freezes, natural gas equipment freezes, and, yes, even renewable energy freezes. Mostly because of a lack of de-icing capability. The state came that close to an all-out, unprecedented historic complete shutdown. All—oil, coal, natural gas and renewable—were impacted. And Texas was not connected to the main eastern or western grid, making it difficult to borrow emergency energy from the rest of the U.S. The main grid operator ERCOT was forced into a major mea culpa and will face, we suspect, numerous law suits. At one point over 4 million had lost power. Restarting equipment was not just a case of flipping a switch. Some could take weeks. Even refineries impacted could take weeks to restart properly. Did anyway say possibly $3/gallon gas by May?
All these problems in Texas, along with colder weather and storms elsewhere, helped push prices up over $60 this past week. But signs of the crisis easing by the week’s end helped push prices back below $60. All we could say is “what a mess” and “what a disaster” for a first-world country.
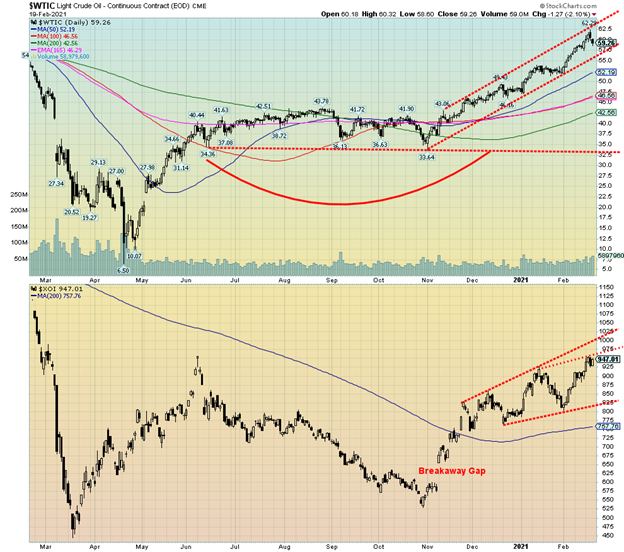
Is it strange that we are now seeing forecasts of $100 oil prices during the commodity super-cycle that many believe is underway? What a turnaround when briefly oil prices were actually negative last March 2020. But we also note that when WTI oil hit its peak this week at $62.29 it was also touching the top of the steep bull channel that has developed. The bottom of that channel is between $56–$57. If that’s correct, then we’d like to see that hold on any pullback. There is considerable price congestion between $60/$65 so we would have expected some hesitation here anyway. If we can get through $65 then the next stop could be $70/$75. $60/$61 was an interim target and since we took that out our next target is $71/$72. We can also see potential targets over $100, but first we have to take out overhead resistance points.
Fibonacci resistance and retracement levels from the 2008 high of $147.27 to the March 2020 official low of $6.50 are seen at between $60/$61 next $76/$78 and then $93/$95. We’d have to break out above $114 to even begin to suggest new highs above $147 were possible. That we have now slightly exceeded our first Fibonacci point suggests that the second point is now possible.
This past week WTI oil actually fell about 0.4% after making fresh 52-week highs. That is a potentially mild negative going into the coming week. That fits with our thoughts that we could test down $56/$57 and still remain in our bull channel. Natural gas (NG) rose 2.8% on the week and is now up 17.8% on the year. The energy stocks as represented by the ARCA Oil & Gas Index (XOI) and the TSX Energy Index (TEN) both made fresh 52-week highs with gains of 3.6% and 2.5% respectively.
Energy is a major component of the Commodity Research Bureau’s index (CRB), making up 39% of the index led by WTI oil at 23%. WTI oil is the largest component of the CRB Index. With the CRB Index at its highest level since 2018, we believe we are breaking out in a new commodity cycle. We are on the cusp of breaking a 12-year downcycle. Oil is one of the leaders. The downtrend line from the 2008 top of $147.27 currently comes in around $75 and that fits as one of the target zones noted. We would expect resistance at those levels.
_
(Featured image by Chris Liverani via Unsplash)
DISCLAIMER: This article was written by a third party contributor and does not reflect the opinion of Born2Invest, its management, staff or its associates. Please review our disclaimer for more information.
This article may include forward-looking statements. These forward-looking statements generally are identified by the words “believe,” “project,” “estimate,” “become,” “plan,” “will,” and similar expressions. These forward-looking statements involve known and unknown risks as well as uncertainties, including those discussed in the following cautionary statements and elsewhere in this article and on this site. Although the Company may believe that its expectations are based on reasonable assumptions, the actual results that the Company may achieve may differ materially from any forward-looking statements, which reflect the opinions of the management of the Company only as of the date hereof. Additionally, please make sure to read these important disclosures.


Mollie Expands Across EEA With €350M Investment to Strengthen European Payments Network
Fintech company Mollie has expanded into Croatia and Iceland, achieving full coverage of the European Economic Area. It has committed...


Trulieve NYSE Listing Signals New Era for Global Cannabis Industry
Trulieve’s NYSE listing marks a milestone for the cannabis industry, giving a major US producer access to institutional capital after...


Moroccan Bond Market Shows Mixed Signals as Primary Eases and Secondary Pressures Persist
The bond market shows a mixed trend, with cautious easing in the primary market as the Treasury raises limited funds...


Markets Diverge as Oil Falls, Rates Hold, and Inflation Persists
Markets reacted to a U.S.–Iran MOU and unchanged Fed rates, with oil plunging while energy stocks showed divergence. Equities fluctuated...


Cocoa Market Faces Mixed Trends Amid Rising Supply and Weak Demand
New York cocoa prices edged lower Thursday while London closed higher, with mixed but improving daily trends. West Africa’s main...
 |
|
 |  |
 |
|
-

 Business1 week ago
SpaceX IPO Sparks Déjà Vu as Market Risks Loom and Gold Bulls Stay Hopeful
-

 Crowdfunding6 days ago
Wyrmgold Launches Crowdfunding Campaign for Believe in me! (please)
-

 Biotech2 weeks ago
The German Biotech Industry Faces Funding Crunch Despite Market Stability
-
 Crypto1 day ago
XRP Under Pressure Amid Macro Forces, Fed Policy, and Regulatory Shifts