Featured
Markets go higher despite jitters over trade, Trump and Iran
It was a week of a dovish Fed and ECB, continued threats on the trade war front, and, war clouds hanging over the Gulf.

We look at interest rates in the G7 and how the U.S.’s high rates pull funds into the U.S. We look at the “what if” aspect of another war in the Gulf and discover that it could have a devastating impact on the global economy and banking system.
Our prime recession watch spread the 2-10 continues to widen but the increasingly watched 3m-10 spread remains negative and many analysts are citing it now as a recession warning.
Gold broke out to multi-year highs this past week. Could a new gold bull market become a runaway bull? Still, there are caution signals. Our “chart of the week” notes gold in other currencies and there are some interesting observations.
Fed statement
“The law is clear that I have a four-year term and I fully intend to serve it,” Jerome Powell, Chair of the Federal Reserve said in 1953. And with these words Powell sent a powerful message to the president, should the president try and demote him, or worse, fire him. The battle between Trump and Powell continues. Trump had been in talks with legal teams looking for a way to either fire or demote Jerome Powell. It would be unprecedented to demote a Fed Chair, let alone fire him. The escalating battle between Trump and Powell has never played out before like this even as there has in the past been tensions between the president and the Fed Chair.
Gone was the word “patient” from the Fed statement following Wednesday’s FOMC announcement. That left open the possibility of a rate cut as early as July. It is, however, overkill when, despite a rise in the Fed rate from 0–0.25% to 2.25–2.50%, interest rates remain at historically low levels. The odds of a rate cut having a significant impact on the economy—when unemployment is already at a multi-decade lows—is probably low. But it could fuel another stock market run, one that could be the final bubble.
The trouble is, the rest of the world has even lower interest rates. The latest for 10-year U.S. Treasury notes is last at 2.00% and even briefly dropped below 2.00% for the first time in three years. But 10-year German Bunds are negative 0.29%, a differential of 2.29 bp. Of the major countries, U.S. interest rates are the highest. And that helps keep the U.S. dollar high as funds flow towards the U.S. for the higher yields.
G7 Countries 5- & 10-year bond yields/Spreads to U.S. Treasuries
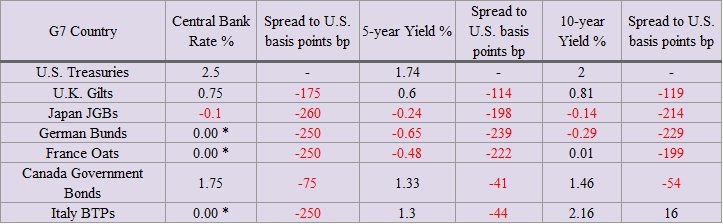
To make matters worse, Mario Draghi, the president of the ECB, indicated on Tuesday they may be prepared to lower interest rates once again. Markets reacted immediately as the euro moved lower against the U.S. dollar and traders priced in a 10-basis point cut by December. Trump accused Draghi of starting a currency war. The next day the FOMC dropped the word “patient” and the hint was on that the Fed was prepared to cut rates as well. The U.S. dollar fell sharply against the euro. The hint that the Fed might cut rates spurred on thoughts that the ECB was prepared to do the same. Currency wars, it appears, are on. They have been going for years.
But in today’s world, today’s news can quickly be old hat as new events take over. China imposed new tariffs on U.S. goods and cuts tariffs for other countries. The U.S. banned five more Chinese tech companies to join Huawei. Then comes the news that Iran shot down a U.S. drone in the Straits of Hormuz where 30% of the world’s oil passes. Trump sends in the troops, then pulls them back before they bomb anything. A Dr. Strangelove moment?
So, what happens? To no one’s surprise, oil prices leap and by the close of Thursday, they were up 5%. Gold, that was already rising as the ECB and the Fed hinted at rate cuts, leaped overnight, up almost $30, clearing major long-term resistance at $1,370/$1,375. Gold closed Friday at $1,400, new 5-year highs. Not to be outdone, stock markets also jumped, led by oil, golds, and materials. The S&P 500 and the Dow Jones Industrials (DJI) made marginal new all-time highs with potentially more gains ahead.
So, what’s happening? It seems that risk is on and markets are going higher. The risk is to the upside.
War in the Gulf
We have no idea as to whether there will be war in the Gulf or not. The shooting down of a U.S. unmanned drone by Iran and word that Trump sent a bombing mission to Iran only to pull it back at the last moment certainly raises the tensions. The shooting down of the unmanned drone was real. Whether Trump sent the bombing mission and pulled it back at the last-minute sounds odd but who knows. Surely the information of potential deaths would have been taken into consideration prior to any bombing mission.
However, the tensions and the potential for a real war are an economic catastrophe waiting to happen. Thirty percent of the world’s oil passes through the Straits of Hormuz. At its minimum, it is only 39 Km wide. Iran and Oman share the air and navigation space. It is the most important oil chokepoint in the world. Choke it off and the world could be plunged into an economic depression. Already airlines are rerouting airplanes to avoid the potential for a miscalculation in the Gulf.
According to intelligence sources we read, it might only take a statement from Iran that the U.S. does not have the military capability to keep the Straits open. It is already widely acknowledged that an outbreak of war between the U.S. and Iran would ignite the entire region. The coast of Iran is lined with anti-ship missiles. Iranian ballistic missiles can hit ships and even the Saudi and U.A.E. oilfields. Whether the U.S. can upend them prior to firing is moot as there are many, scattered and they are dug in.
But the concern is a panic that sends the price of oil soaring. And if that happens, what happens to the $1.2 quadrillion derivatives market (notional amount?. No, not all of it is oil derivatives but there has been an unknown amount of notional derivatives on oil at levels of $150 and higher. They are cheap to buy and they are uncovered by the option writers. Naked options are great for income until they are suddenly in the money and that notional amount becomes a real amount. It is like what happened in 2008 in the subprime market and credit derivatives written by institutions like AIG. The credit derivatives were a great source of income until they were in the money and it brought down AIG, Lehman Brothers, and almost the entire global banking system.
But higher oil prices could push up interest rates in a hurry as well and cause a stock market panic. Again, how much naked derivatives will be outstanding on higher interest rates (naked puts) and a lower stock market (naked puts)? We would hazard, quite a lot. Interest rates and the stock market would be collateral damage in an oil panic and the shutdown of the Gulf.
Even Goldman Sachs has premised that in a war in the Gulf oil could go to $1,000 a barrel. If that were correct the global banking system would collapse in an instant and the world would be plunged into a deep depression. The world’s central banks are ill-prepared for another 2008 let alone something like this. But for the gold bugs, gold would soar to how many $1,000’s of dollars – we don’t know.
It is noteworthy that Iran’s territorial waters in the Straits are 12 miles or roughly 20 Km. The Straits are, as noted only 39 Km wide at its minimum. Iran has, since 1959, only recognized non-military naval transit of its waters through the Straits. There are no international waters in the Straits. All sides are best to keep to themselves. But will they?
Markets and trends

We continue to wrestle with where we are in the wave count with the markets. By this particular count, we saw the top of intermediate wave 3 in January 2018. We have since then been experiencing intermediate wave 4. Following the completion of wave 4 expected sometime later this year the markets could move once again to all-time highs topping sometime in 2020. It would, however, be the final wave up. Another count suggests that the markets did indeed make its high in January 2018 and what we have been witnessing since then is the first wave down of much longer decline. That count would signal the December 2018 low as intermediate A wave down.
We are now working on intermediate wave B. We won’t know for sure until this wave is complete just exactly where we stand. Irrespective if our broadening top theory is correct then we could top out here no higher than about 3,000 on the S&P 500 and around 28,000 on the Dow Jones Industrials (DJI). The high would come sometime this summer in July or August but certainly no later than September. Two scenarios. One is bullish into 2020 while the other is bearish, with the current wave up topping some time into the summer. Which will it be?

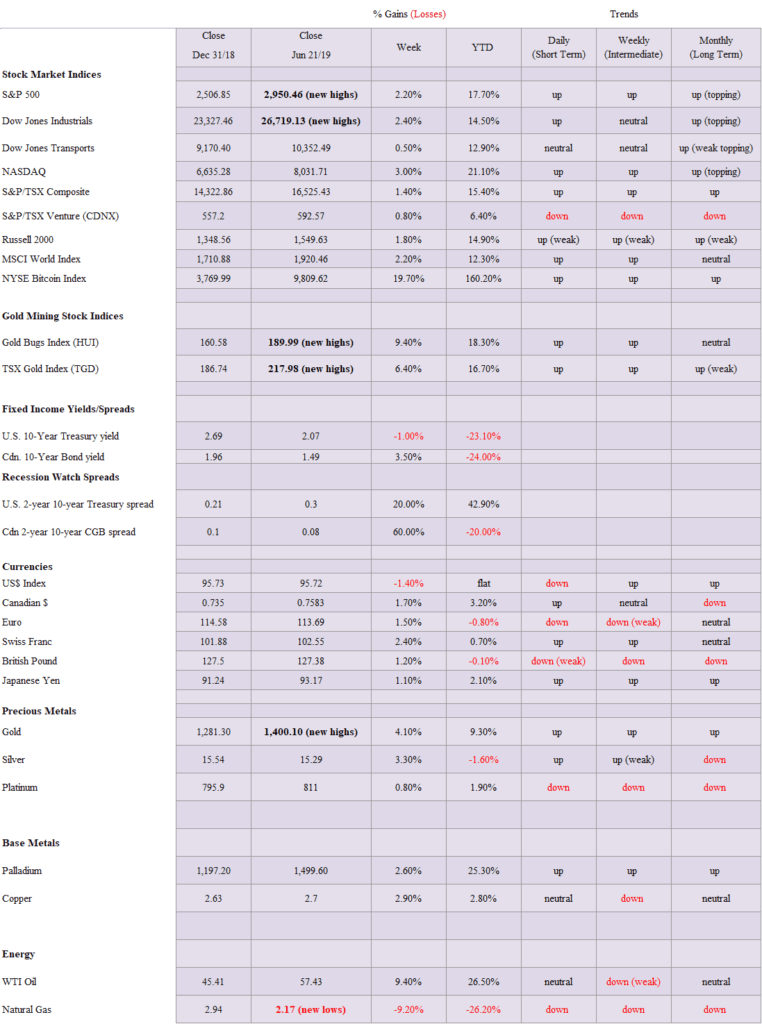
Thanks to a dovish Fed and ECB stock markets rallied once again this past week. Surprisingly, more negative news on the trade front and the ongoing conflict in the Gulf did not seem to impact the markets too much. The Dow Jones Industrials (DJI) rose 2.4%, the Dow Jones Transportations (DJT) was up 0.5%, the S&P 500 gained 2.2% and the NASDAQ put on 3.0%. Both the S&P 500 and the DJI made marginal new all-time highs. The Dow Jones Utilities (DJU) continued its record-making run. The Russell 1000 also saw marginal new highs. Elsewhere the TSX Composite gained 1.4% while the TSX Venture Exchange (CDNX) was up 0.8%. The Russell 2000 gained 1.8%. Globally the MSCI World Index gained 2.2% while the London FTSE was up 0.2%. The Paris CAC 40 was up 3.0% and the German DAX rose 2.0%. In Asia, China’s Shanghai Index (SSEC) gained 4.2% while the Tokyo Nikkei Dow (TKN) was up 1.2%. All in all, a good week for the stock markets.
Our expectations are that the S&P 500 could add to these gains in the next few weeks baring no serious negative news on the trade front nor any serious news on the spat in the Gulf between Iran and the U.S. The DJI pictured above has potential to rise towards 28,000 and could even creep higher towards 30,000. 30,000 would act as a psychological barrier to further gains as the markets tend to pause at these important milestones rather than sail right through them. The DJI has considerable support down to 26,000 and below that 25,500. But a breakdown below 25,500 would be more problematic. A breakdown under 24,700 would confirm that the DJI and the markets have entered a new down phase. It appears to us, that we have limited upside but considerable downside. Still, the markets want to go higher and right now that appears to be the path of least resistance.

We continue to be fascinated by the rising NYSE advance-decline line as it once again steams to new all-time highs. The AD line appears to be signaling that the markets should continue their current rise. The S&P 500 and the DJI did make tiny new all-time highs this past week. Most other indices have not. In an interesting divergence, the NASDAQ advance-decline line is nowhere near its former highs. (see chart below). So, is the NASDAQ signaling a potential top in the market with its non-confirmation with the advance-decline line of the S&P 500 and non-confirmation with the NASDAQ itself?


Bearish divergence #1. In stock markets, we like to see significant divergences at tops and bottoms. Markets, indices should confirm each other. So, if one makes a new all-time high we want a similar index to make a new all-time high as well. Here’s the large-cap S&P 500 vs. the small-cap S&P 600. While the S&P 500 is eking out a new all-time high the small-cap S&P 600 has been declining for months and is nowhere near its former highs. In bull markets, the small-cap stocks normally lead. Now they are lagging badly. This makes the rally in the large-cap S&P 500 suspect. This non-confirmation has been going on for 10 months now. It is not a positive sign.

Bearish divergence #2. This is actually the mother of all divergences. Charles Dow wrote his theory behind this one along with other theories. The two indices – the Dow Jones Industrials (DJI) and the Dow Jones Transportations (DJT) must confirm each other. Except the DJI is making new all-time highs and the DJT isn’t even close. Both topped together last September. Since then they are diverging. The DJT hasn’t even come close to regaining its high seen in April. Naturally, the divergence is not confirmed. That doesn’t happen until the two of them are falling and making new lows together.

The TSX Composite managed to tack on 1.4% this past week. Unlike the DJI and the S&P 500, the TSX has failed so far to make new all-time highs. The top of the current channel is up around 16,800. So, it is doable given that is only about 250 points away. The TSX was led this week by Golds, Metals, Energy, and Materials. Most others were quiet. And given what is going on, those groups are going to have to help take the TSX to the top of the channel and even higher. But like the DJI and the other U.S. indices, the TSX Composite appears to be making a huge broadening top formation. As we have explained before, the pattern is not guaranteed as it is rare. A breakdown would be underway if the TSX fell under 16,000 and confirmed under 15,700. Right now, the TSX appears to have limited upside and considerable downside.

Is Bitcoin mania back on? This past week Bitcoin leaped almost 20% as the NYSE Bitcoin Index closed over $9,800. In weekend trading Bitcoin hit as high as $11,200. Only that rebound high of $11,500 seen in 2018 remains before a run towards $20,000 can take place. But as was the previous run, it is speculative, manipulative and these cryptos are still not used for much of anything. But it attracts speculative money. Institutional money has also come in along with speculative hedge funds and others. Lack of regulation, hacking and outright theft remain. Yet people still come in. I guess we’ll see. There are still 2,279 different cryptos listed at Coin Market Cap. The market cap of all of the cryptos is up to $328.7 billion with Bitcoin at $194.1 billion or 59% of the entire market. There are 19 listed with a market cap over $1 billion. Newmont Goldcorp (NEM-NYSE) the largest gold mining company only has a market cap of about $31 billion. Bill Gates alone is worth more than three times that. So, is this time different than the last bubble run-up towards $20,000? Probably not. But they always say “this time is different.”

After falling briefly below 2.00% the 10-year U.S. Treasury note rebounded and closed the week at 2.07% down only 2 bp on the week from 2.09%. It is the lowest level seen for the 10-year since 2017. Yields rebounded as there was some profit taking and selling related to tensions in the Gulf and continuing trade tensions between the U.S. and China. The auctions this past week were also somewhat weaker than expected. A break above 2.15% could send yields towards 2.20%. Is it possible that yields have hit their lows? Only a break now below 2.00% would confirm that the historic yield decline remains firmly in place.
Recession watch spread

Our closely watched 2-year U.S. Treasury note 10-year U.S. Treasury note spread widened this past week to 30 bp the highest level seen in weeks. It also appears to have broken a downtrend line. For the interim at least this spread seems destined to rise (albeit slowly) rather than narrow and turn negative. It does kind of kill the argument that a recession is imminent. That would be good news considering the tensions in the Gulf. Nonetheless, economic numbers are weakening. May housing starts fell and market PMI’s are hovering just above 50. The 2-year note has been falling faster than the 10-year note largely because of expectations of a Fed interest rate cut.
Recession Watch Spread 2

We thought it best to now include the 3-month U.S. Treasury bill – 10-year U.S. Treasury note as part of our recession watch spread. We say that owing to the fact that weakening economic numbers and a widening 2-10 spread do not appear compatible. So, we will watch both. The 3M-10Y spread is at negative 4 bp this past week. This is actually up from a low of negative 28 bp. There is resistance here but above negative 4 it could rise to +7 bp. We will continue to monitor. These spreads need to stay inverted for upwards of six months before an actual recession might get underway.

Given a dovish Fed and ECB, the U.S. dollar took a tumble this past week breaking a multi-month trendline in the process. In turn, the weaker U.S. dollar helped spur gold prices higher. Support can be seen down to 95. The spat in the Gulf didn’t help either for the US$ as the go-to default currency. Instead, the Euro, the yen and the Swiss franc benefitted. The US$ Index fell 1.4% but the Japanese yen rose 1.1%. The euro was also higher up 1.5%, the Swiss franc had the biggest gain up 2.4% while the pound sterling gained 1.2%. The Canadian dollar also benefited jumping 1.7%. The US$ Index has the potential to fall to next support at 95. Following a consolidation, we suspect the US$ Index could then fall through 95 confirming a new bear market. Only a move back above 97.25 would negate this bearish scenario.

The Swiss franc was a major beneficiary of the fall in the US$ this past week as it jumped 2.4% the best of the major currencies that make up the US$ Index. The Swiss franc constitutes 3.6% of the US$ Index. The largest is the Euro at 57.6% followed by the Japanese yen at 13.6%. The pound sterling is 11.9%, the Canadian dollar at 9.1% and the Swedish krona at 4.2%. But the Swiss franc has a higher profile and funds are often parked in the Swiss franc because of Switzerland’s neutrality and private banking system. The Swiss franc has formed an interesting bottom pattern and appears to have broken away from the pattern on Thursday with sharper gains on Friday. We’ll follow the Swiss franc going forward and have added it to our currencies.

In a long-anticipated move, gold broke out this past week to multi-year highs. Yes, you heard that right. Not only did it rise to new 52-week highs but it moved to new multi-year highs. A dovish Fed and ECB, a weakening U.S. dollar and tension in the Gulf helped. This we anticipate, could be our long-awaited C wave. We say multi-year highs as we broke out over the highs of 2018, 2017, 2016, 2015 and 2014. Only the rebound high of $1,434 from 2013 remains. The highs of 2013 are much higher at around $1,700. We have noted that the huge potential head and shoulders bottom that gold has formed over the past few years projects up to $1,725-$1,750. In breaking above and closing above multi-year highs for two consecutive days the breakout is confirmed. We do need one more, close though and that is month end. So as long as we hold these prices through month end the breakout is confirmed. The question is how high can we go in the first good wave to the upside. The cup and handle pattern projects up to around $1,525-$1,550. We note that in 2013 the market fell swiftly from the breakdown point around $1,525 to a low of $1,179 before the rebound to $1,434. Could the market rise just as swiftly? It is possible. After all, the breakout to multi-year highs does release a lot of pressure. After years of misery, the gold bugs have something to celebrate. But just a little.

One encouraging aspect of gold’s breakout this past week was the huge upsurge in the volume that accompanied the breakout. This was to be expected if the breakout is real as we highly suspect. As we noted this could trigger a fairly swift move that takes us to $1,500. If that is correct, we suspect that our first good top could come as early as July probably past mid-month. It will be accompanied by a wave of euphoria. A multi-month correction could then follow before the next surge to the upside takes place. According to the Daily Sentiment Index (from Elliott Wave International), it hit 94% bulls this past week. No, that doesn’t mean we eminently collapse right back but we might need a week or two of consolidation. The RSI is also well past 70 indeed over 80 so it too needs some easing. But the die to us appears to be cast and gold is on the cusp of a powerful bull market that could take us into 2020.

It was no surprise to see that the commercial COT fell again this past week. The commercial COT for gold fell to 28% from 29% the previous week. Long open interest rose over 4,000 contracts while short open interest jumped roughly 26,000 contracts. Given that gold leaped to multi-year highs this past week we suspect that the commercial short position could rise further in the weeks ahead. It is noteworthy that the commercial COT for gold remained quite negative all the way up to $1,900 from 2009-2011. It would not be surprising to see the same thing happen again. The large speculators’ COT (hedge funds, managed futures, etc.) rose to 80% from 79%. Their long open interest jumped over 24,000 contracts but their short open interest also rose up roughly 4,500 contracts. We are getting into a bearish territory for the commercial COT but it can stay that way for some time—longer than the speculator bears can stay solvent.

If we have a concern about the recent jump to multi-year highs for gold it is that silver is lagging. For sure, silver was up this past week gaining 3.3% but that was behind gold’s 4.1% move. Silver is still down on the year, off 1.6%. Silver has further resistance up to $15.65 but above that, it should rise to $16-$16.20. We do note there was a huge upsurge in volume this past week so that was a positive development. Now we just need it to translate into higher prices. Silver should be leading, not lagging. At 91.5 we have never seen the gold/silver ratio so high. Even just to get it down to a decent level at 70 would put silver today at $20. If the gold/silver ratio was at the levels seen at the peak in 2011 silver would be trading at $44 today. We have a long way to go. Major resistance for silver remains at around $16.40. Silver’s rise is only negated under $14.80 although we’d be concerned if we went back under $15.25. We doubt it. The volume surge alone is suggesting higher prices.

It is no surprise that the commercials are getting shorter. The silver commercial COT fell to 42% this past week from 44% the previous week. It is still not in what we would consider bearish territory. But despite the fall long open interest rose roughly 4,500 contracts and short open interest was up 13,500 contracts. The large speculators’ COT jumped to 54% from 51%. Still not what we would consider hugely bullish.

Are gold stocks as represented here by the TSX Gold Index (TGD) suggesting a runaway move? The TGD rose 6.4% this past week while the Gold Bugs Index (HUI) was up a solid 9.4%. Both are now well into positive territory for the year with the HUI up 18.3% and the TGD up 16.7%. Both indices made new 52-week highs a positive development. Numerous individual stocks are also making fresh 52-week highs but many still lag and should soon catch up. Note the gaps on the chart. The initial gap, seen back on May 31, 2019, is what is known as a breakaway gap deriving its name by the fact that the market or stock gaps up (could be down as well) and the gap is never filled. Now, this past week the TGD gapped again to the upside. This may be what we call a measuring gap or a runaway gap. We prefer measuring but if suddenly there was a string of them it would be a runaway gap. These types of gaps usually occur roughly halfway through the move. If that is correct then the TGD has potential to rise to around 247 and even 250 another 13%+ from current levels. The all-time high for the TGD seen back in 2011 was at 455. Earlier we had suggested the potential to rise to around 230-235. If, however, the gap was filled and the TGD was to fall back under 210 and especially under 205 the technical pattern would be invalidated. We note volume is rising with the up move suggesting to us that this is a move to be taken seriously. The market is under-owned gold stocks and given that the gold stock market is not that big, it would not take a huge uptick in volume to move it higher quickly.

The Gold Miners Bullish Percent Index is now up to 56. It’s rising but it is still not oversold. Similarly, the Gold Miners new highs-new lows % Index is up to 16 well-off high-water marks seen in 2016. We view these sentiment indicators as neutral at this stage suggesting that the gold stocks still have further to rise before they would enter the dangerous bull territory. As we saw, however, in 2016, these sentiment indicators can rise quickly.

Given the tensions in the Gulf, oil prices leaped 9.4% this past week to over $57. That sparked energy stocks higher as the U.S. Oil & Gas Index (XOI) jumped 5% and the TSX Energy Index (TEN) was up 2.6%. Natural gas (NG), however, did not fare as well as prices fell 9.2%. With the jump this week WTI oil is fast approaching its first significant resistance zone at $58-$60. If a large triangle has formed as it appears on the chart, the breakout point is at $64. Based on the triangle once a firm breakout was in place oil could have the potential to rise to $100. Interim resistance would be seen around $75-$80. This scenario would be negated if tensions eased in the Gulf and oil fell back under $52. If that were correct the risk would shift to the downside. However, as we outlined last week, we believe oil prices made an important cycle low at $42 and even more importantly at $26 back in 2016. That suggested to us that we are now in the third year of the current nine-year cycle for oil prices. A triangle has also formed on the XOI with the breakout point at 1,300. That triangle suggests the potential for a move to 1,800. The breakdown is under 1,200.
Chart of the week

Everyone has a tendency to think of gold only in U.S. dollars. It is the base. But gold also trades in other currencies and it is here where things are actually interesting.
In U.S. dollars gold remains down roughly $500 from its all-time high of $1,923. It’s all-time high close was at $1,900. That’s still down roughly 27% from its all-time high close. Gold in other currencies has fared better.
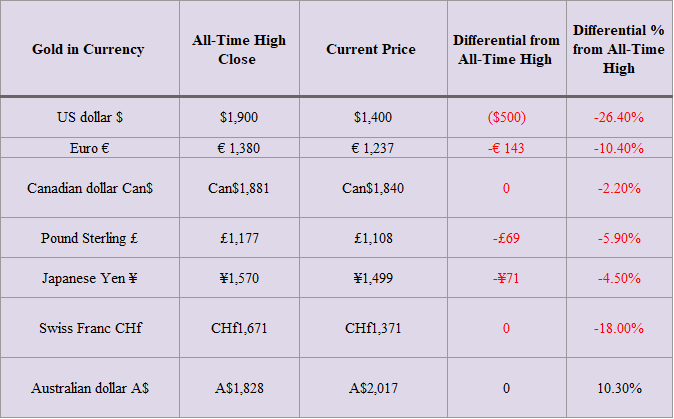
The star has been gold in Australian dollars (AUD$) as it has made a new all-time high close and is up 10.3% from that close. This is significant as most of the others—Cdn$, pound sterling, and Japanese yen—are within hailing distance of making new all-time highs as well. With the AUD$ leading the way it is telling us that they all should make new all-time highs with the US$ being the one most in doubt of achieving that lofty height. (see chart on next page)

(Featured image by DepositPhotos)
—
DISCLAIMER: David Chapman is not a registered advisory service and is not an exempt market dealer (EMD). We do not and cannot give individualized market advice. The information in this article is intended only for informational and educational purposes. It should not be considered a solicitation of an offer or sale of any security. The reader assumes all risk when trading in securities and David Chapman advises consulting a licensed professional financial advisor before proceeding with any trade or idea presented in this article. We share our ideas and opinions for informational and educational purposes only and expect the reader to perform due diligence before considering a position in any security. That includes consulting with your own licensed professional financial advisor.


Graph Therapeutics Secures $5M to Advance AI-Driven Precision Therapies
Biotechnology company Graph Therapeutics raised 5 million dollars in a funding round led by Daphni, with support from existing investors....


DEA Hearing Signals Historic Turning Point for U.S. Cannabis Policy
The DEA has begun a key hearing on reclassifying cannabis from Schedule I to Schedule III, following a recommendation from...


Italy Leads Europe in Digital Sustainability Reporting for SMEs, EFRAG Finds
Italy leads Europe in digital sustainability reporting tools for SMEs, according to EFRAG’s second mapping of VSME platforms. The ecosystem...

RLUSD Launch in Japan Amid XRP Price Decline and Uncertain Outlook
Ripple and SBI launched the RLUSD stablecoin in Japan after JFSA approval, signaling strong progress in tokenization. However, XRP fell...


Youth Cannabis Use in Colorado Is Falling — But the Full Story Is More Complex
The 2026 Colorado survey shows teen cannabis use fell to 10 percent in 2025, down from 21 percent in 2015....
 |
|
 |  |
 |
|
-

 Cannabis2 weeks ago
WNBA Removes Cannabis From Banned Substances List in New CBA
-

 Markets3 days ago
Cotton Market Weakness Persists Despite Brief Rebound
-
 Cannabis1 week ago
Trulieve NYSE Listing Signals New Era for Global Cannabis Industry
-
 Biotech19 hours ago
Graph Therapeutics Secures $5M to Advance AI-Driven Precision Therapies