Markets
Why a Potential Pivotal Week for the Markets Is Coming Up
Wednesday is the Federal Reserve interest rate decision and Friday is the U.S. January job numbers. Canada’s job numbers are out the following week. Expectation is the Fed will hold the line on interest rates so what is of interest is hints as to whether they will cut later and when. The BofC and the ECB both held rates steady this past week

Up, up, and away. Well, at least for the Dow Jones Industrials (DJI) and the S&P 500 (SPX). Yes, once again, the DJI and SPX made new all-time highs this past week. But once again no one else joined them. Well almost no one. The NASDAQ continues some 4% under its all-time high seen in November 2021. Thanks again to the Magnificent Seven for sending the NY FANG Index to all-time highs, which has helped the SPX but not the NASDAQ make new highs. The Dow Jones Transportations (DJT) continues to diverge with the DJI, as not only has it not made new all-time highs with the DJI, but it’s almost 13% under its all-time high seen in November 2021.
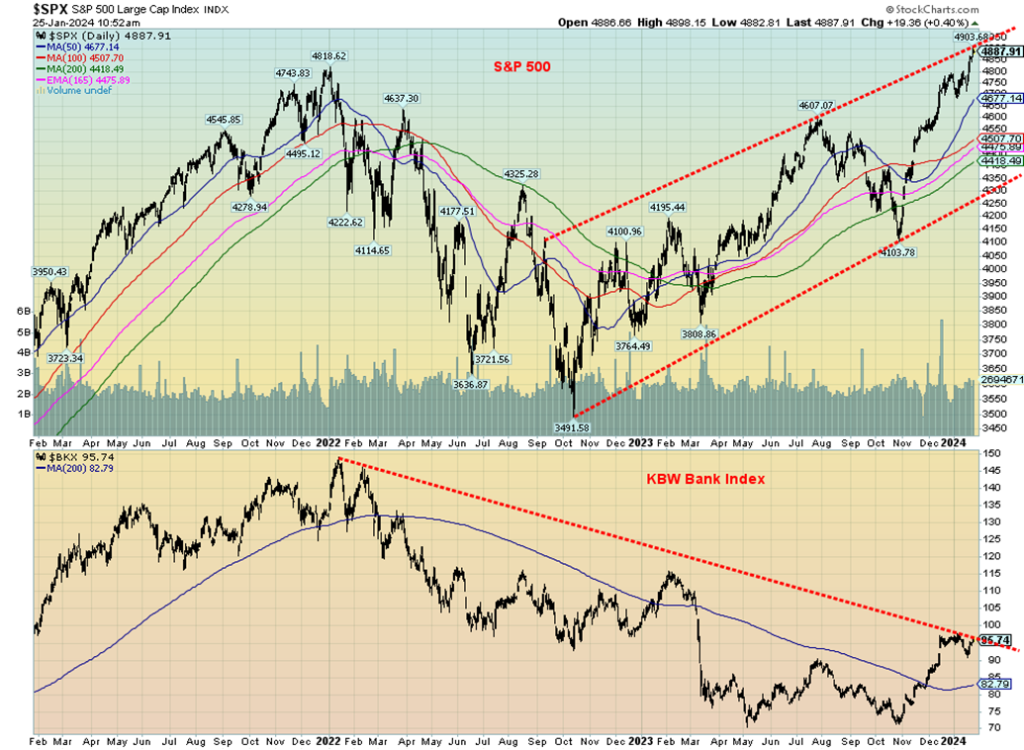
Yes, we did find some other indices making all-time highs: the Wilshire 5000, the NASDAQ 100 (but not the NASDAQ), and the Russell 1000 and 3000. They may be less followed than the DJI and SPX, but they are significant nonetheless. However, the key ones like the DJT and the NASDAQ are not. A significant divergence. Another area nowhere near its previous highs are the banks. Yet financials are a significant portion of the economy. It is estimated that banks made up some 56% of the U.S. economy in 2021. Probably not much different today. Banks are needed to facilitate monetary policy by helping the flow of money into the economy.
Our chart below of the S&P 500 vs. the KBW Bank Index (BKX) shows that, while the SPX makes new all-time highs, the BKX is nowhere near its high of January 2022. It is instead almost 36% below the high. The same holds true for the S&P Bank Index, the Dow Jones Bank Index, and the KBW Regional Bank Index (KRX), and the same holds in Canada. While the TSX Composite remains over 5% below its all-time high, the TSX Financials
Index (TFS) is almost 13% below its high. AI and high-tech trump banks, it seems.
So far, all we’ve had in terms of failures over the past year were three large regional banks: Silicon Valley Bank (SVB), Signature Bank, and First Republic. In the latter part of 2023, we added Heartland Tri-State Bank and Citizens Bank. No Canadian banks went under, although Laurentian Bank unsuccessfully tried to sell itself. HSBC Canada decided to leave Canada and sold itself to the Royal Bank. In the U.S., none were big enough to threaten the entire banking system as was the case in 2008 with the collapse of Lehman Brothers followed by the near collapse of American International Group (AIG) a large insurance company.
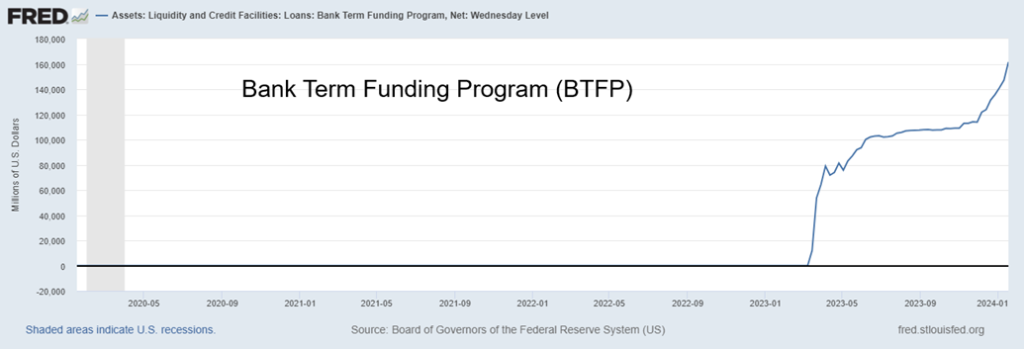
Against the backdrop of the bank failures in 2023, the Federal Reserve set up a generous loan program. The bank term funding programme (BTFP) was a loan program against the face value of treasury bonds. By that, the loan program lent $10 million against the face value of the treasury bonds of $10 million, even if they were trading at a significant discount; i.e. at a price of 80.0 the bonds are worth only $8 million. It was to compensate for the fact that higher rates had pushed bond yields higher (prices lower as yields are inverse to price).
The program has shored up the banks, but at what cost? It seems banks can borrow today at 4.8% but receive 5.4% on their cash balances at the Fed. An arbitrage play? Risk-free too. Unintended consequences? We guess we can’t blame the banks for an opportunity when it’s presented to them. The question is then, are there more banks out there that on a mark-to-market basis are actually under water? The answer is potentially yes.
BTFP 2020–2024
If banks are struggling, then it is a wonder that stock markets are printing new all-time highs? Banking crises dot the history of the U.S. and the world. Who can forget the Savings and Loans crisis of the 1980s and 1990s, the Asian financial crisis of 1997, the collapse of Long-Term Capital Management (LTCM) in 1998, along with the collapse of the Russian banks, the sub-prime collapse and financial crisis of 2007–2009, and the threat of a banking crisis in 2023? Fortunately, the latter never was fully realized.
Delayed reaction? But in each instance the Fed came to the rescue, providing liquidity. That was especially true after the 2007–2009 banking and financial crisis when we were introduced to a new term—quantitative easing (QE). Now we seem to have a hidden QE, called BTFP. Fortunately, using the facility can prove to be a bit embarrassing for the banks taking advantage of the arbitrage, but that hasn’t stopped the facility from growing, as the chart above shows.
Banks are also awaiting the full impact of Basel III. Basel III is an internationally agreed-upon set of measures set up by Basel Committee on banking supervision as a result of the financial crisis of 2007–2009. It is all conducted through the Bank for International Settlements (BIS), the central bank of central banks. It requires, amongst other things, minimum capital requirements, increased liquidity coverage, a more stable funding ratio, and a better regulatory framework for a more resilient banks and banking system. Some, it seems, are now balking because it could constrain profits.
The banking system is one of the most important cogs in the economy. Yet the charts are suggesting there may actually be a problem. So far, we’ve avoided another banking crisis. But will that hold true forever?
Yes, there is too much debt. But so far, no major blow-ups. Yes, there is deep polarization in a number of countries, especially the U.S. Interestingly, it is suggested that neither side may not accept the results of the November 5 election. Result, a constitutional crisis? Or worse? Global tensions remain with the wars in Russia/Ukraine and the now spreading war in the Middle East. And conflict remains between U.S./Russia, U.S./China, and U.S./Iran.
The rise of AI has the power to be both positive and negative. We are already seeing negative AI as fake photos and videos show up. Which one will prevail? And how might it impact elections? Given global conflict, supply chain disruptions, and the threat of war, interest rates are not likely to come down any time soon. Finally, extreme weather events are not going away. All we need now is a full, all-out banking crisis. It could be lurking.
Chart of the Week
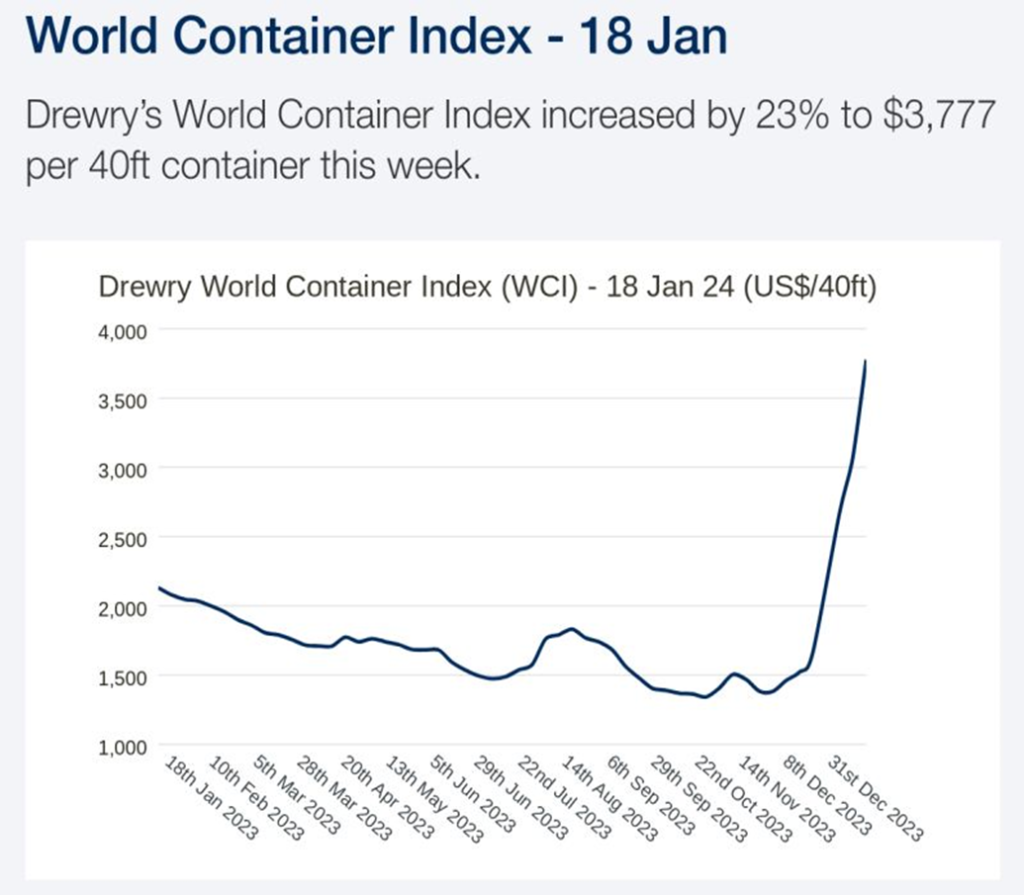
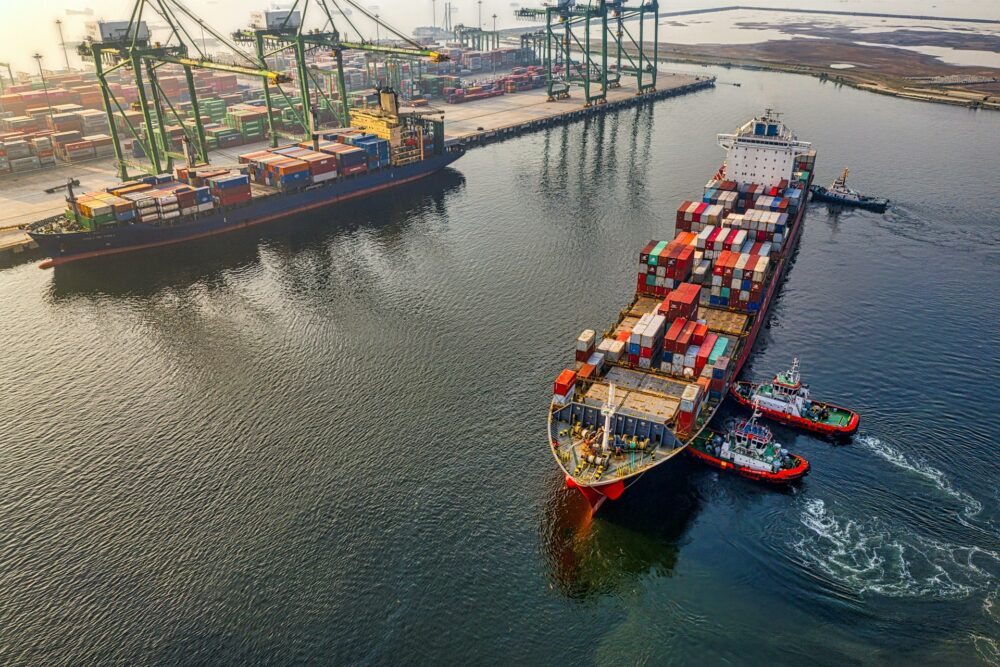
Container prices have been rising. Maybe that should be no surprise, given the ongoing conflict in the Red Sea/Straits of Bab-El-Mandeb, plus droughts in the Panama Canal that have slashed ship crossings by 36%. Add in potential trouble for the Straits of Hormuz, and freight and container prices probably only have one way to go: up. Since the beginning of 2024, the Drewry World Container Index has jumped 23% to January 18.
All this translates into global supply chains being disrupted. It takes 10–15 days longer to go around the Cape of Good Hope. Ships that normally go through the Panama Canal are facing the same problem. Add in the need for additional crew with some demanding double pay, higher insurance costs, and more, and you could see shortages develop for numerous goods and commodities. The Suez waterway normally carries 12% of global trade. Apparently, roughly a quarter of container ship capacity is being forced to re-route. Many are now planning for this to last months.
That in turn could translate into higher prices. The odds of inflation falling to 2% then become a dream. This is not dissimilar to what happened in 2020/2021 during the pandemic. (https://globalaffairs.org/bluemarble/oil-ikea-furniture-red-sea-conflict-and-panama-canal-drought-delay-shipments-and-could)
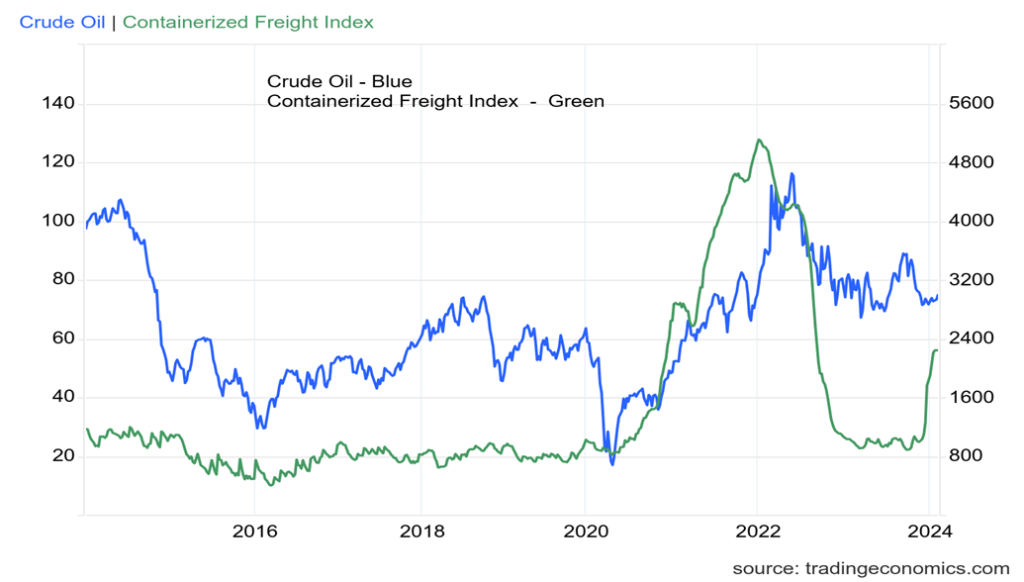
Below is another look at it using the Containerized Freight Index (CCFI), comparing it with crude oil. The CCFI is primarily a Chinese Index and it, along with the Shanghai Export Containerized Freight Index, have also been rising. The last time this was happening was during the pandemic of 2020 that sparked numerous shipping disruptions of world trade. Oil prices also rose, with the freight index peaking before oil prices peaked in 2022, just after the outbreak of the Russia/Ukraine war.
Containerized Freight Index and Crude Oil 2013–2024
There are numerous shipping indices, including the Baltic Dry Index (BDI), that we have shown a number of times. While the other indices are rising, the BDI is falling as its reflection is opposite to the others. Nonetheless, the result is the same. Freight costs are rising and delays are rising, which translates into higher prices and increased inflation. Numerous ports, including ones here in Canada such as Halifax, Nova Scotia are reporting delays in receiving ships and goods, along with higher costs.
There are numerous companies involved in global shipping. The largest is Maersk, a Danish company, followed by the Mediterranean Shipping Company (MSK), a Swiss company. Other large companies that may be familiar include Cosco Shipping out of China and Evergreen, a Taiwanese company best known for the container ship Ever Given that was stuck in the Suez Canal for six days in 2021. There are numerous shipping companies listed on the NYSE, but none that rank amongst the world’s largest. Some might be worth a look. (https://finance.yahoo.com/news/13-best-shipping-container-stocks-071944369.html)
Ocean shipping is a global enterprise and an important cog in globalization. Disruption due to war or drought can be very costly. We likely haven’t as yet felt the worst impact from the current disruptions in the Red Sea/Straits Bab-El-Mandeb and the Panama Canal, but they are coming.
Markets & Trends
| % Gains (Losses) Trends | ||||||||
| Close Dec 31/23 | Close Jan 26, 2024 | Week | YTD | Daily (Short Term) | Weekly (Intermediate) | Monthly (Long Term) | ||
| Stock Market Indices | ||||||||
| S&P 500 | 4,769.83 | 4,890.97 (new highs)* | 1.1% | 2.5% | up | up | up | |
| Dow Jones Industrials | 37,689.54 | 38,109.43 (new highs)* | 0.7% | 1.1% | up | up | up | |
| Dow Jones Transport | 15,898.85 | 15,901.12 | 2.0% | flat | up | up | up | |
| NASDAQ | 15,011.35 | 15,455.36 (new highs) | 0.9% | 3.0% | up | up | up | |
| S&P/TSX Composite | 20,958.54 | 21,125.28 (new highs) | 1.1% | 0.8% | up | up | up | |
| S&P/TSX Venture (CDNX) | 552.90 | 550.86 | (0.3)% | (0.4)% | up (weak) | down (weak) | down | |
| S&P 600 (small) | 1,318.26 | 1,290.07 | 1.6% | (2.1)% | up | up | up (weak) | |
| MSCI World | 2,260.96 | 2,229.83 | 1.8% | (1.4)% | up | up | up (weak) | |
| Bitcoin | 41,987.29 | 42,011.47 | 1.0% | 0.1% | up | up | up | |
| Gold Mining Stock Indices | ||||||||
| Gold Bugs Index (HUI) | 243.31 | 218.54 | flat | (10.2)% | down | down | down | |
| TSX Gold Index (TGD) | 284.56 | 260.89 | 1.0% | (8.3)% | down | down | down | |
| % | ||||||||
| U.S. 10-Year Treasury Bond yield | 3.87% | 4.14% | 0.2% | 7.0% | ||||
| Cdn. 10-Year Bond CGB yield | 3.11% | 3.52% | 0.6% | 13.2% | ||||
| Recession Watch Spreads | ||||||||
| U.S. 2-year 10-year Treasury spread | (0.38)% | (0.22)% | 15.4% | 42.1% | ||||
| Cdn 2-year 10-year CGB spread | (0.78)% | (0.54)% | 10.0% | 30.8% | ||||
| Currencies | ||||||||
| US$ Index | 101.03 | 103.47 | 0.2% | 2.4% | up | neutral | up (weak) | |
| Canadian $ | 75.60 | 74.41 | (0.1)% | (1.6)% | neutral | neutral | down | |
| Euro | 110.36 | 108.54 | (0.4)% | (1.7)% | down | neutral | down (weak) | |
| Swiss Franc | 118.84 | 115.77 | 0.5% | (2.6)% | neutral | up | up | |
| British Pound | 127.31 | 127.04 | flat | (0.2)% | up | Up | ||
| Japanese Yen | 70.91 | 67.53 | flat | (4.8)% | down | down | down | |
| Precious Metals | ||||||||
| Gold | 2,071.80 | 2,017.30 | (0.6)% | (2.6)% | down (weak) | up | up | |
| Silver | 24.09 | 22.87 | 0.7% | (5.1)% | down | down | neutral | |
| Platinum | 1,023.20 | 921.30 | 1.6% | (10.0)% | down | down | down | |
| Base Metals | ||||||||
| Palladium | 1,140.20 | 961.40 | 1.3% | (15.7)% | down | down | down | |
| Copper | 3.89 | 3.85 | 1.6% | (1.0)% | up (weak) | up (weak) | down (weak) | |
| Energy | ||||||||
| WTI Oil | 71.70 | 78.01 | 6.5% | 8.7% | up | neutral | neutral | |
| Nat Gas | 2.56 | 2.17 | (3.6)% | (15.2)% | down | down | down | |
New highs/lows refer to new 52-week highs/lows and, in some cases, all-time highs.
U.S. GDP Growth Rate, U.S. Leading Economic Index 2014–2024
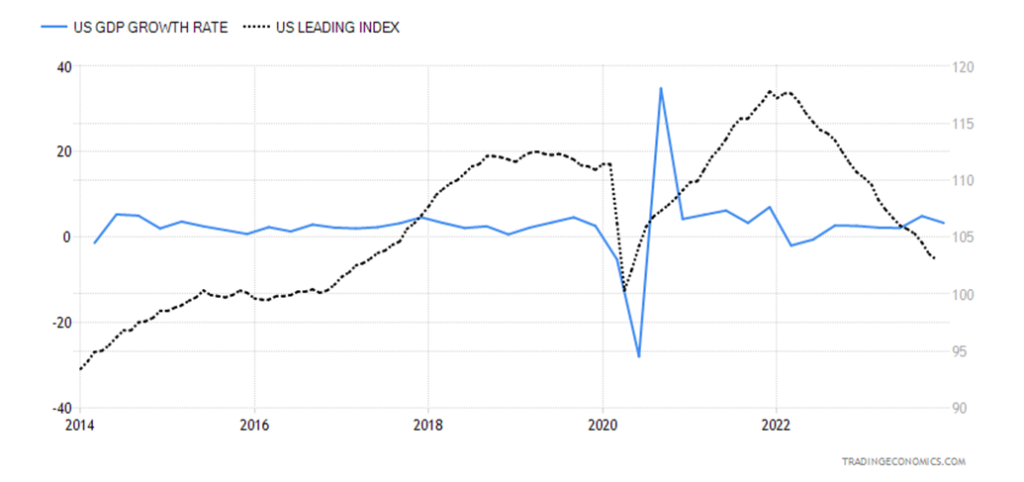
The U.S. economy surprised once again with an advanced GDP for Q4 of 3.3%. On the year, GDP was up 2.5% which beat 2022’s 1.9% growth. The market had expected 2.6%. Consumer spending was down but spending on services rose, more than offsetting the spending on goods. Inventories slowed. But exports rose as imports fell.
All this is against the backdrop of falling leading economic indicators (LEI). While we are not showing the full spectrum of GDP growth and the LEI, we do note that the LEI tends to fall in advance of a fall in GDP. Rarely is it simultaneous as was seen during the 2020 pandemic and recession. Something to consider going forward.
Nonetheless, the stronger than expected numbers add to hopes for a soft landing.
PCE Price Index, CPI 2014–2024
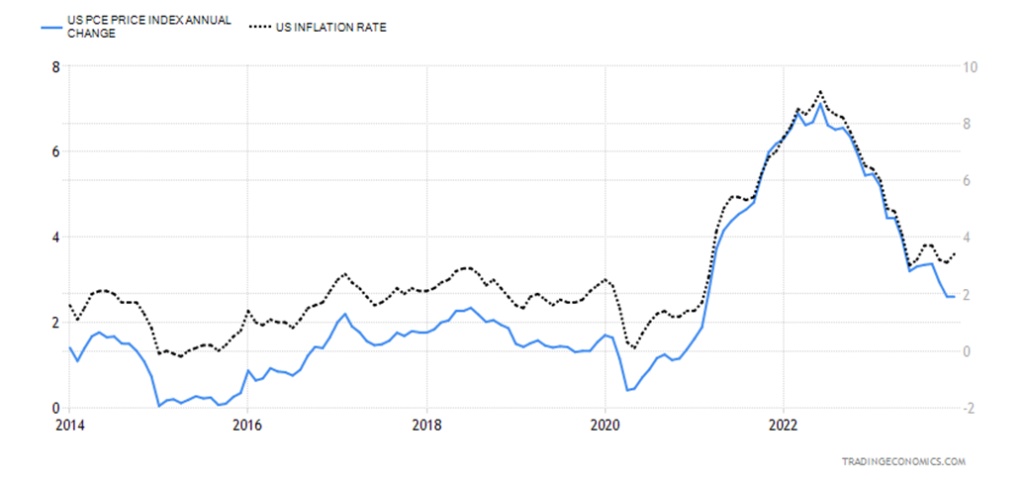
PCE prices came in lower than expected for December. The market had expected a year-over-year (y-o-y) gain of 2.7% and got 2.6% instead. The PCE Price Index is followed more closely by the Fed. The PCE refers to personal consumption expenditures, and it’s believed it more closely aligns with the reality on the street rather than the CPI.
The PCE index has been coming down just as the CPI is coming down. But the PCE dropped again, or at least held steady from November, whereas the CPI ticked upwards. What’s key now will be to see if next month’s PCE ticks up or not. While we are back at 2021 levels, we are not where we were during the 2010s and into the pandemic recession of 2020.
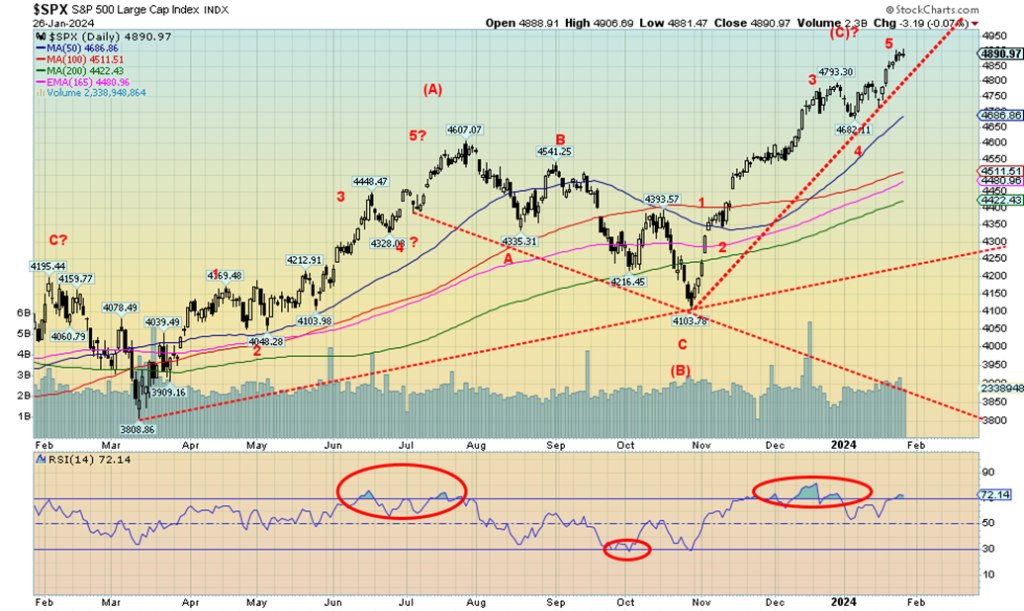
We started our main piece with up, up, and away and that is exactly what has been happening. It’s quite appropriate. The Dow Jones Industrials (DJI) and the S&P 500 both soared to new all-time highs once again this past week. As we noted, so did the Wilshire 5000, the NASDAQ 100, and the Russell 1000 and 3000.
But the divergences continue as the DJI and the Dow Jones Transportations (DJT) continue to diverge from each other, As well, the S&P 400 (Mid) and the S&P 600 (Small) along with the Russell 2000 are also diverging with the larger cap indices. As we noted before, the NYSE advance/decline line and the NASDAQ advance/decline are also diverging with the indices, as the indices make higher highs while the AD lines are below previous highs.
On the week, the S&P 500 was up 1.1%, the DJI was up 0.7%, the DJT gained about 2.0%, while the NASDAQ was up 0.9%. The S&P 400 gained 0.8% while the S&P 600 was up 1.6%. In Canada, the TSX composite also made new 52-week highs, up 1.1%, but the TSX Venture Exchange (CDNX) continues to struggle, down 0.3%. Bitcoin rebounded but remains below earlier highs. Bitcoin was up 1.0%.
In the EU there were gains as well. The London FTSE was up 2.3%, the EuroNext 100 gained 3.0% to just barely make new all-time highs, the Paris CAC 40 was up 3.6%, and the German DAX gained 2.5%. Both the CAC and the DAX fell just short of new all-time highs. In Asia, China’s Shanghai Index (SSEC) rebounded up 2.8%, the Tokyo Nikkei Dow (TKN) finally floundered, off 1.1%, while Hong Kong’s Hang Seng (HSI) jumped 4.2%.
Shanghai and Hong Kong were rebounding on hopes for a rebounding China economy. The MSCI World Index was up 1.8%.
With all the gains, overbought conditions are popping up once again. And this time with divergences as the indicators are not confirming the new highs. It is no surprise we are seeing once again RSIs over 70; however, this time they are below previous highs, even as the index makes new highs—a divergence. January concludes what is known as the best three months of the best six months. February is normally not a good month.
February is known as the weak link in the best six months. For the DJI it is the 8th best month and for the S&P 500 it is the 11th best month (2nd from bottom). For the NASDAQ it is the 9th worst month. The S&P 500 averages a loss of 0.8% since 1950 and in election years it averages a loss of 0.4%. None of this is to say February 2024 is going to be a bad month, but given the sharp rise since the October 2023 low, the odds are good that February may not be a very good month.
The first sign of trouble comes under 4,800. Under 4,680 a top is confirmed. Under 4,680 would give us a weekly sell signal. But we’d have to get under 4,100 to confirm a monthly sell signal. Under 3,700 we’d get a yearly sell signal. These are just zones to keep in mind on pullbacks.
The trend is up, but this week’s Fed meeting and January nonfarm payrolls could change the dynamic. The political front in the U.S. is as divided as ever, but it hasn’t caused any problems for the stock markets—yet.
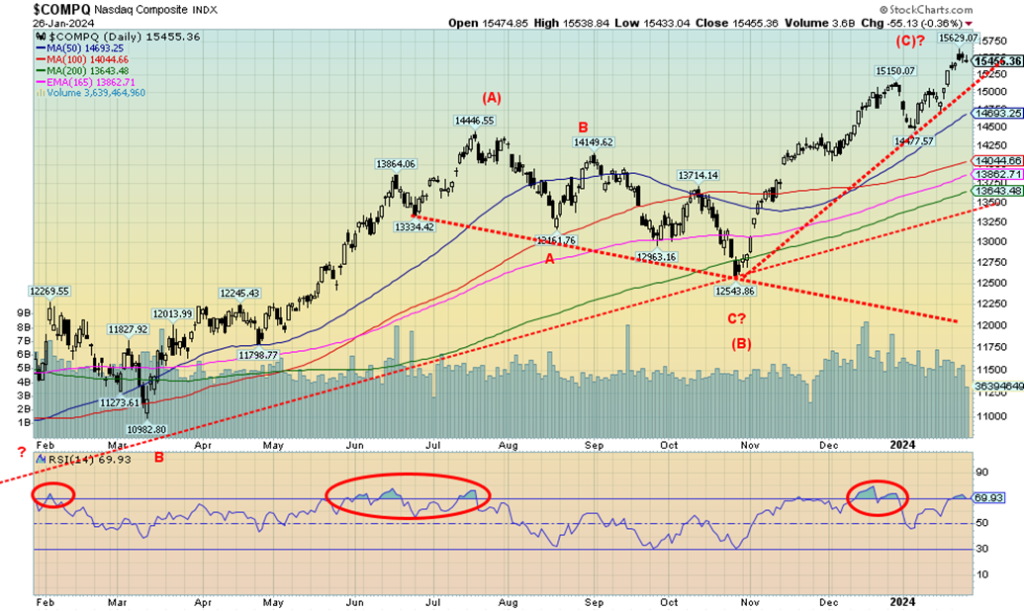
Thanks to the continued rise of the FAANGs, the NASDAQ soared once again to 52-week highs. The AI-driven NY FANG Index hit all-time highs once again. The NY FANG is driving the NASDAQ and the S&P 500 along with the NASDAQ 100 that hit new all-time highs once again this past week. The NASDAQ was up 0.9% this past week while the NASDAQ 100 gained 0.6%. Of the FAANGs, we saw some new all-time highs as well. Hitting all-time highs were Meta, Amazon, Netflix, Google, Microsoft, Nvidia, Advanced Micro (AMD), and Broadcom.
Everyone would be surprised to know that Berkshire Hathaway also hit new all-time highs. But one significant FAANG fell sharply. Yes, Tesla dropped 13.6% and Elon Musk slipped once again into second place as one of the richest men in the world. At the other end, Netflix gained 18.1%, thanks to a record-breaking signing up of new accounts. Netflix is ubiquitous in the world with over 200 million subscribers.
Have we topped out? We did pull back in the last two days and we are overbought with an RSI that went over 70 but diverged with the December highs. A break under 15,000 would suggest a high. A break under 14,475 would confirm the high. Otherwise, the trend is up.
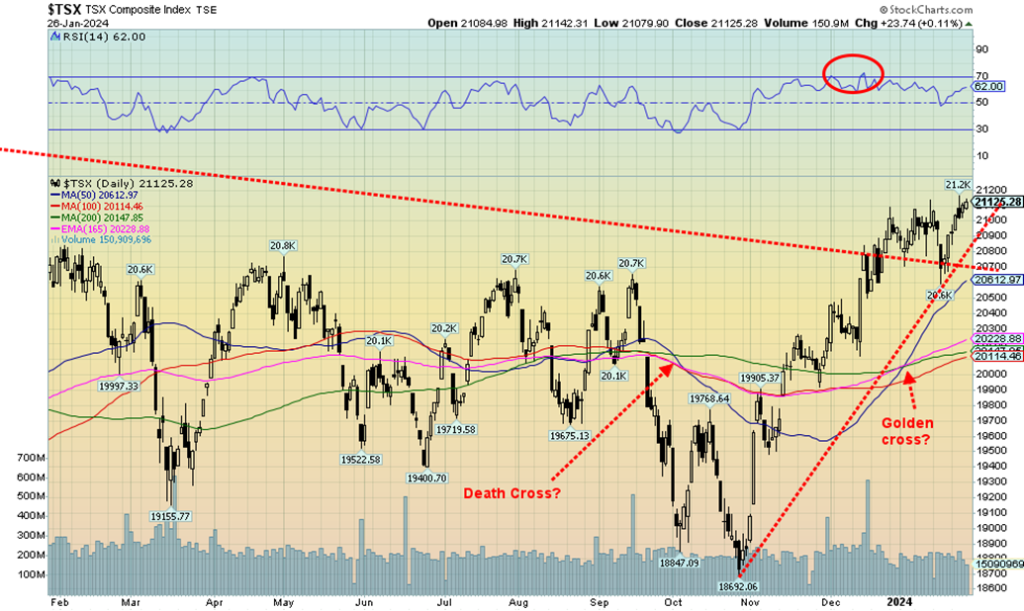
The TSX Composite jumped to new 52-week highs this past week but remains short of the all-time high of 22,200 set in early 2022. Only three of the 14 sub-indices were down on the week led by Telecommunications TTS, off 0.8%, and Health Care THC, off 0.7%. Leading the way up was Energy TEN, up 4.3%. Metals & Mining TGM was up 2.0%, the only other one to touch 2% or higher. Besides the TSX, the TSX 60 also made new 52-week highs, but barely.
Making new all-time highs were the Consumer Staples TCS and Industrials TIN. Information Technology TTK made 52-week highs. It is possible now that the TSX has broken out. We are only 88 points from the 2022 high. A move above 21,190 would suggest to us that new all-time highs are now in the crosshairs. We have a golden cross that the talking heads like to point out. So, we’ll mention it. With the new highs, we are making negative divergences on the indicators with earlier highs. No significant correction has taken place since the October 2023 low.
U.S. 10-year Treasury Bond/Canadian 10-year Government Bond (CGB)
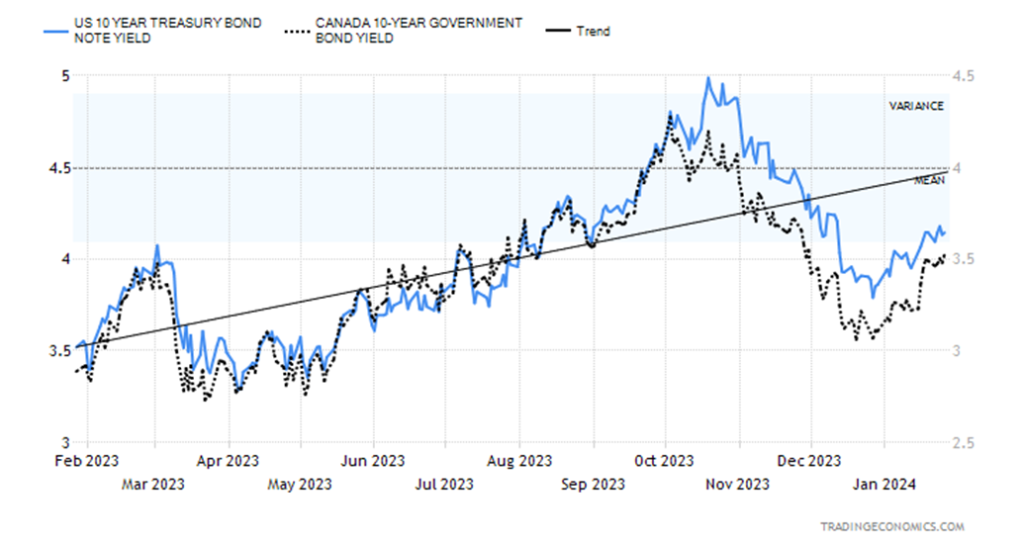
U.S. treasury notes and bonds continued to tick higher this past week with the U.S. 10-year treasury note rising to 4.14%, up a small 0.2%. In Canada, the Canadian Government 10-year bond (CGB) rose to 3.52%, up 0.6%. More noticeable was a further narrowing of the 2–10 spread. In the U.S. it fell to 22 bp from 26 bp and in Canada it dropped to 54 bp from 60 bp. As the 2–10 spread narrows down, it suggests to us that we are getting closer to a recession.
The Fed meeting this week on Jan 30–31 plus January’s nonfarm payrolls on Friday are the big events. No change is expected for the Fed; we expect it will be just like the Bank of Canada (BofC) and the ECB did this past week, leaving rates unchanged.
The U.S. economy continues to be resilient, as shown by the Q4 advance GDP up 3.3%, well above the expected 2.3%. But other signs were not as good. The Richmond Fed was negative 15, largely as expected, the global S&P manufacturing PMI was 52.3, just above the expected 50.3 and still positive, durable goods were flat, largely as expected, and initial jobless claims jumped back to 219,000, leaving last week’s drop look like an outlier.
The market had expected 192,000. Continuing claims were 1,833 thousand vs. expected 1,800 thousand. New home sales were 664,000 vs. expected 640,000. Personal income rose 0.3% as expected while personal spending was up 0.7%, well above the expected 0.3%. Pending home sales were y-o-y up 1.3% when they expected a decline of 3.4%. The U.S. economy remains surprisingly resilient, outpacing the EU, Japan, and Canada. PCE prices were up 2.6% vs. the expected 2.7%. All eyes this week are on the Fed and nonfarm payrolls, expected to be up 175,000 vs. December’s gain of 216,000.
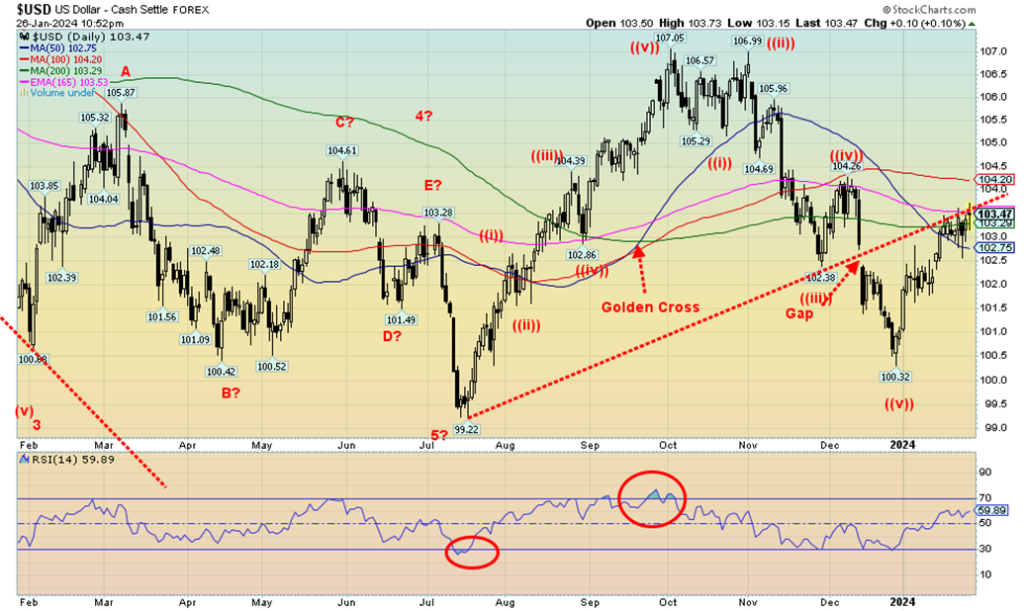
The currencies didn’t do much this past week. We suspect they are waiting for the Fed and nonfarm payroll on Friday. The US$ Index gained a small 0.2% this past week. The euro was down 0.4% but the Swiss franc was up 0.5%, while the pound sterling was flat as was the Japanese yen. Canada fell 0.1%. All in all, a pretty dull week.
As a result, we made no progress on 103.50 resistance. Have we topped? We can’t tell that as we are only testing that old trendline that was formed with the gap down in December. A burst above 103.50 most likely would take us to at least 104.20 resistance. A breakdown under 102.75 could suggest a top and under 102 a top is confirmed. Under 101, new lows below 100.32 are probable. The US$ Index will be driven by the Fed this week and nonfarm payroll. Signs of the Fed easing and weak job numbers could more likely spark a drop in the US$ Index.
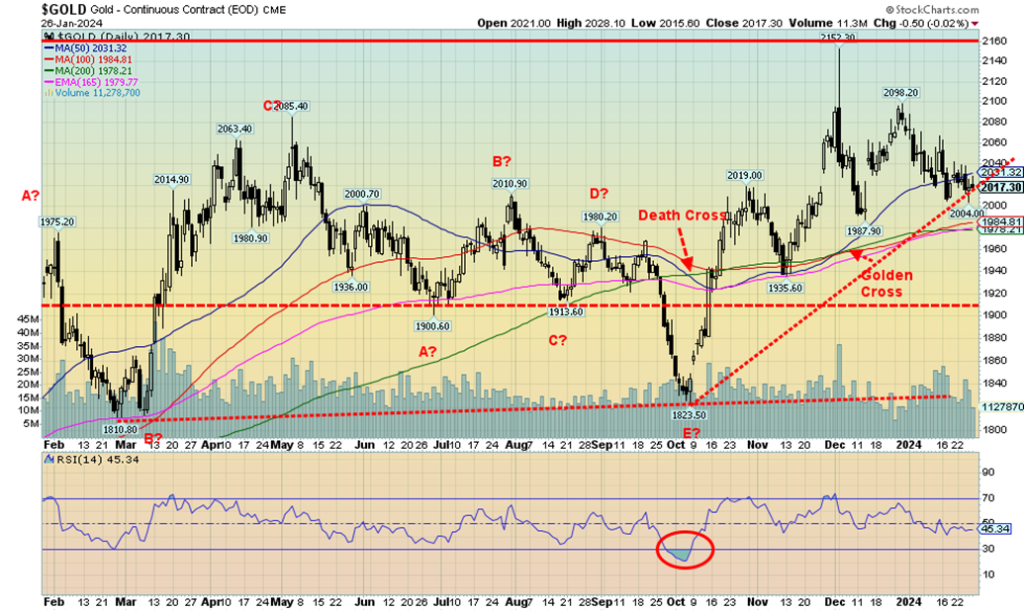
Gold did nothing this past week, even as the stock indices soared to new all-time highs. Gold finished the week with a small loss of $12 or 0.6%. With the Fed on Wednesday and nonfarm on Friday, the expectation is that gold will waffle into those numbers. Gold does not appear to be reacting much to the goings-on in the Red Sea/Straits Bab-El-Mandeb. Geopolitical concerns become gold’s concern only if things were to really heat up. So far, all sides merely exchanging bombs is not doing much for gold, even as oil prices are ticking up. Expectations of the Fed easing would help more. So would a poor jobs number this Friday.
With gold down, silver was up gaining 0.7%. For silver this is a win as, for the first time in a while, silver was leading. Can it continue? Platinum also rose 1.6% while the near precious metals (mostly industrial) saw palladium jump 1.3% and copper up 1.6%. Copper sometimes leads gold as well. The gold stocks didn’t do much as the Gold Bugs Index (HUI) was flat and the TSX Gold Index (TGD) was up 1.0%.
The commercial COT for gold was at 27% this past week, a slight improvement from the previous week. We’d feel better seeing it over 30%. We are working on a golden cross, so that is at least a positive for gold. However, on business networks like CNBC, MSN, or BNN, gold and gold stocks are barely mentioned, overshadowed by AI and soaring FAANG stocks. Is AI the new gold? Does AI take a hit on the revelation of pornographic pictures of Taylor Swift circulating on X, formerly known as Twitter? They were AI generated. With an election coming up, the danger is that AI will be used to smear political opponents.
Gold is holding a pretty shaky uptrend line. And we are holding above $2,000. At least that is positive. The gold bugs keep pounding the table that we are about to embark on the greatest gold bull market ever. However, reality belies their thoughts, at least for now. The pattern up from the October low of $1,823 appears to be corrective, so we are not yet ready to proclaim a great new bull market. Since that peak at $2,152, the pattern also appears to be an ABC correction. We could get a C wave up that takes us past $2,152, possibly even to $2,300. Correction or not, at least that would get the gold stocks moving higher.
The gold market could continue to waffle into the Fed, but if we start rising into the Fed and take out $2,060/$2,080, then the odds favour we’ll take out $2,100. Above $2,120 new highs above $2,152 become possible. A break under $2,000 is not good, but under $1,975 there’s a good chance we are headed lower. PDAC is early March and gold does have some record of rising into PDAC.
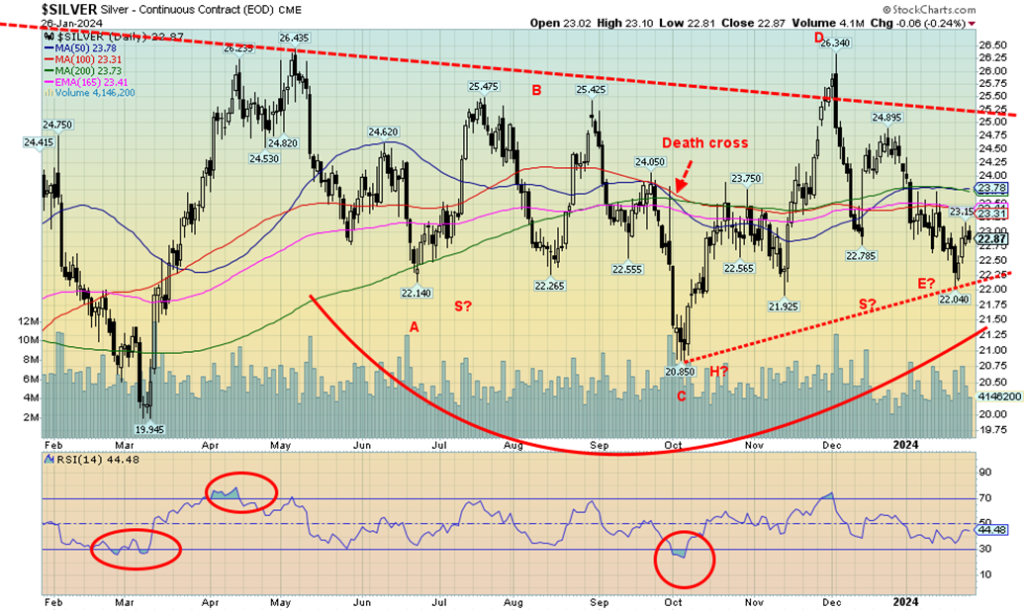
While gold prices waffled this past week, silver prices actually rose, although not by much. Silver gained 16 cents or 0.7%. It’s disappointing we didn’t cross through $23, an area that needs to be overhauled. A better breakout would occur over $24, but the ever-elusive $26/$27 remains the key zone that needs to be taken out if we are to have any thoughts of $30 or higher. Meanwhile, at least $22 held, for now. However, we have no sign of a budding uptrend. At least the commercial COT improved this week and now stands at 35.6%. We’d still like to see it over 40% to feel better that an up thrust is underway.
Nonetheless, for once silver led and it was the best week for silver in the past five weeks. We continue to believe we made a rather complex ABCDE-type correction from the May 2023 high of $26.44. If the run to $26.44 was the A wave out (or 1 wave), this is the B or 2 wave correction. The very awkward-looking head and shoulders pattern is more or less intact, but we are putting less stead in it.
A breakout of that pattern could project up to $31.60 but only becomes a possibility once we break out over $26. A breakdown under $22 would be negative and end any thoughts of a head and shoulder. Under 22 would suggest the October low of $20.85 could fall. This may yet be only a fourth wave down from the $26.34 top seen in December. That’s why we can’t begin to feel comfortable and confident for higher prices until we once again take out $26 and preferably $27.
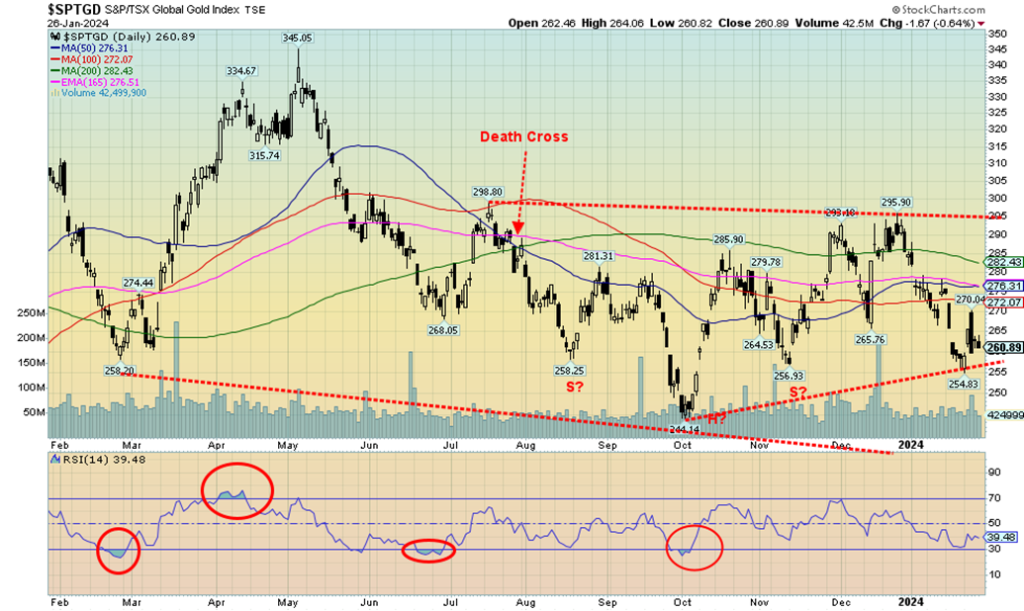
The gold stocks didn’t do much this past week, thanks to weak gold prices, even as silver rebounded slightly. The TSX Gold Index (TGD) was the best performer, up 1.0%. However, the Gold Bugs Index (HUI) did nothing, despite back-and-forth action, ending the week pretty well unchanged. For the TGD, resistance continues to appear at 272/282 but only above 295/300 do we break out.
We may be trying to form some sort of rising triangle (sometimes seen at lows) and, if that’s correct, a firm break over 295/300 could project the TGD up to at least 350 and the highs of May 2023. That would be a welcome relief for long-suffering gold stock holders. Risk remains below and a firm break of 255 could test the October low of 244 or even break it.
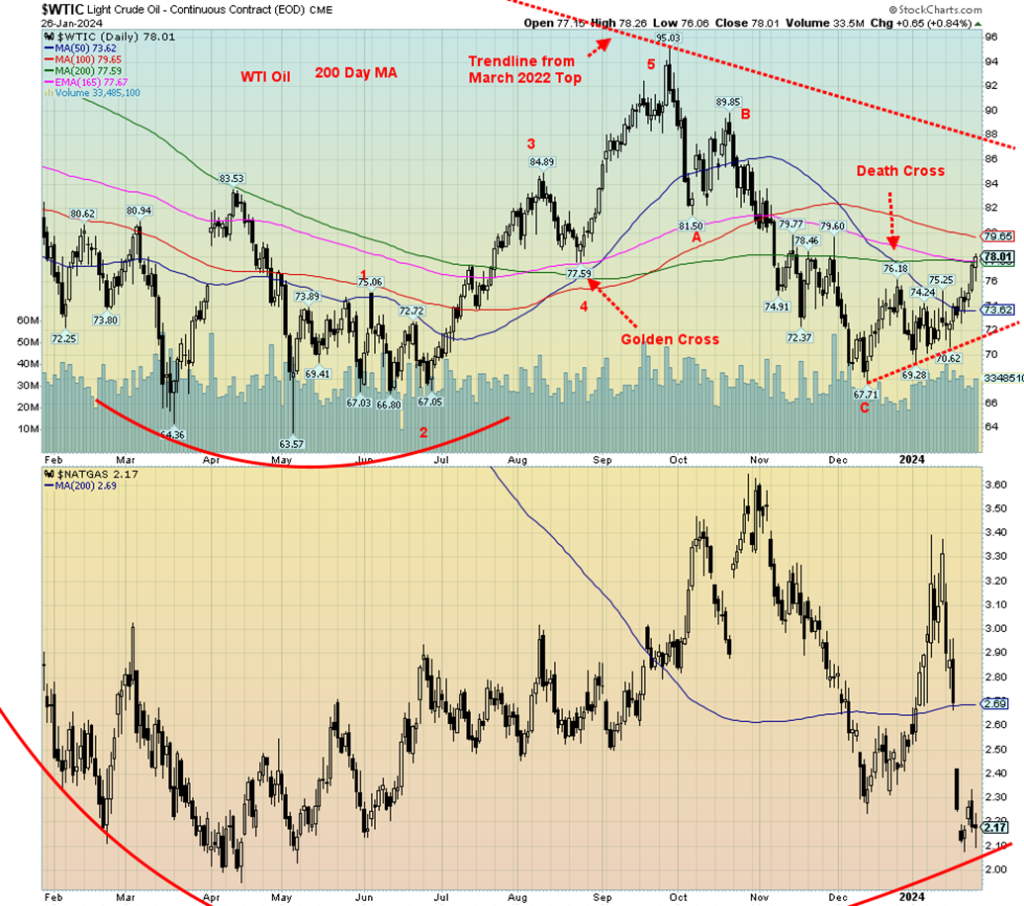
Oil prices jumped this past week, thanks to better than expected GDP numbers plus continual attacks in the Red Sea/Straits Bab-El-Mandeb/Gulf of Aden that saw an U.K. oil tanker on fire after being hit. A U.S. warship was also hit but no real damage. Two Maersk ships were also hit, despite having a U.S. warship escort. The U.S. is running around trying to talk China and others into reining in Iran and the Houthis. As well, we noted that the U.S. strategic reserves continued to fall.
Brent crude surged through $80, hitting a high over $83 and closing at $82.95. Brent was up 5.6% but WTI oil was up more, 6.5%. $80 was a bit of a psychological barrier for Brent. It is also a psychological barrier for WTI and we have consistently said we can’t confirm our low until we are through $80. We closed at $78.01.
Natural gas (NG) continued its woes due to warming weather. NG at the Henry Hub was down 3.6% while at the EU Dutch Hub NG fell 1.2%. Milder weather translates into lower demand. The energy stocks are, however, more driven by oil rather than NG. The result was that the ARCA Oil & Gas Index (XOI) was up 4.9% and the TSX Energy Index (TEN) rose 4.3%. With thoughts that WTI oil will burst through $80, the energy stocks are giving off buy signals. We are now getting buy signals on the energy indices.
Canada’s oil capacity is about to increase sharply with the opening of the Trans Mountain pipeline by April and a full capacity opening by December. That should help prices in Western Canada.
Technically, we can now identify a possible trendline forming from the December low at $67.71. It is only the first one, so we would prefer to see another eventually. But we still need to close over $80 to suggest a low. NG’s chart looks terrible, having gapped down. That’s quite a hole to fill, roughly between $2.40 and $2.60. The 200-day MA is around $2.70 so that will also act as a barrier.
Oil prices appear destined to go higher. That in turn will continue to lend a bid to the energy stocks. If NG bounces back, that will help even more.
Copyright David Chapman 2024
__
(Featured image by Sean Pollock via Unsplash)
DISCLAIMER: This article was written by a third party contributor and does not reflect the opinion of Born2Invest, its management, staff or its associates. Please review our disclaimer for more information.
This article may include forward-looking statements. These forward-looking statements generally are identified by the words “believe,” “project,” “estimate,” “become,” “plan,” “will,” and similar expressions. These forward-looking statements involve known and unknown risks as well as uncertainties, including those discussed in the following cautionary statements and elsewhere in this article and on this site. Although the Company may believe that its expectations are based on reasonable assumptions, the actual results that the Company may achieve may differ materially from any forward-looking statements, which reflect the opinions of the management of the Company only as of the date hereof. Additionally, please make sure to read these important disclosures.
David Chapman is not a registered advisory service and is not an exempt market dealer (EMD) nor a licensed financial advisor. He does not and cannot give individualised market advice. David Chapman has worked in the financial industry for over 40 years including large financial corporations, banks, and investment dealers. The information in this newsletter is intended only for informational and educational purposes. It should not be construed as an offer, a solicitation of an offer or sale of any security. Every effort is made to provide accurate and complete information. However, we cannot guarantee that there will be no errors. We make no claims, promises or guarantees about the accuracy, completeness, or adequacy of the contents of this commentary and expressly disclaim liability for errors and omissions in the contents of this commentary. David Chapman will always use his best efforts to ensure the accuracy and timeliness of all information. The reader assumes all risk when trading in securities and David Chapman advises consulting a licensed professional financial advisor or portfolio manager such as Enriched Investing Incorporated before proceeding with any trade or idea presented in this newsletter. David Chapman may own shares in companies mentioned in this newsletter. Before making an investment, prospective investors should review each security’s offering documents which summarize the objectives, fees, expenses and associated risks. David Chapman shares his ideas and opinions for informational and educational purposes only and expects the reader to perform due diligence before considering a position in any security. That includes consulting with your own licensed professional financial advisor such as Enriched Investing Incorporated. Performance is not guaranteed, values change frequently, and past performance may not be repeated.


Morocco’s Budget Execution June 2026: Deficit Narrows to 20.2 MMDH
Morocco’s Finance Law execution at end-June 2026 shows a reduced budget deficit of 20.2 billion dirhams, down from 24.9 billion...


Tilray Brands Hits Multi-Year Lows as Cannabis Investors Await Regulatory Clarity
Tilray Brands shares have fallen 57% this year amid cannabis sector weakness and uncertainty over US regulatory reform. While potential...


Ethereum Between ETF Inflows, Price Risks and a Strong July
Ethereum faces mixed signals as ETF inflows and a strong July performance support recovery, while technical resistance and downside risks...


Mercedes-Benz Accelerates EV Decarbonization With Recycled Aluminum
Mercedes-Benz expands its partnership with Hydro to accelerate supply chain decarbonization. Future electric vehicles will use Hydro CIRCAL aluminum containing...

Evotec and BioGaia Boost Biotech, while Vitrolife Disappoints
European stocks moved on earnings and broker actions. Evotec, BioGaia, Plus500, Pharming, Inwido, Amundi and Julius Baer rallied on upgrades,...
 |
|
 |  |
 |
|
-

 Fintech2 weeks ago
FinTech Matures as AI and Infrastructure Drive the Next Growth Phase
-

 Business2 days ago
BMW Hit by China Slowdown as Samsung Profits Soar and Adidas Gains World Cup Boost
-

 Cannabis1 week ago
Switzerland’s Medical Cannabis Reform Advances Access, But Barriers Remain
-
 Africa4 days ago
BMCE Capital Markets Launches Carbon Market Offering for Moroccan Transport Operators