Markets
Markets Were Universally Down, Except for Gold and Some Commodities
In markets we face risk constantly. Trying to figure out what the risks are and where we are in the cycle is the hard part. This week we attempt to lay them out using a template from The Economist. Risks abound. War, sharply rising interest rates, political dysfunction, extreme weather they appear to be at the forefront. And what are the impacts on markets and where are we in the cycle?

We spent a good portion of our career sitting on the dealer desks of large financial institutions. Following that, we made a career change and spent the latter part as a financial advisor/analyst. Our purpose in starting The Technical Scoop, which has been ongoing since around 1996, was to look at markets the way we did work for the large financial institutions where our job was primarily as risk managers.
Portfolios, whether they be stocks, bonds, derivatives, money markets, precious metals, or foreign exchange, face numerous risks. The Economic Intelligence Unit (EIU) of The Economist breaks down global risks into four main categories: political, military, economic, and environmental. Many of these risks are easily identifiable. We summarize below the EIU thoughts, plus a few of our own following on the next page:
- Political: shifting foreign policy that strains alliances and opens up new sources of conflict; the rise of AI with the use of doctored and fake videos that could undermine trust in political institutions; political polarization, which includes ideological divides (i.e., culture wars, climate change, political parties, science—for example, vaccines), that threaten to upset balance and social cohesion in many countries; rising commodity prices, supply chain disruptions, high prices due to global inflation, currency weakness resulting in lagging wages and leading to strikes
- Military: Russia/Ukraine war, which is a great power struggle between U.S./Russia; China/Taiwan which is a great power struggle between U.S./China; Israel/Hamas war that could escalate quickly into a broader regional war, encompassing the great powers U.S./Russia/China; numerous smaller conflicts where the combatants are supported by either of the U.S./Russia/China; Iran, North Korea; rising risk of global war—i.e., World War III
- Economic: persistent high inflation, leading to high-interest rates that could trigger rising unemployment and a global recession; increased controls from the state; subsidies, particularly in greening through electrification that could lead to increased trade wars; sanctions that have a negative impact, similar to trade wars and leading to increased efforts to avoid sanctions, along with many countries ignoring sanctions
- Environmental: increase in extreme weather events such as heat, floods, hurricanes, fires, drought, blizzards, extreme storms, and landslides that lead to increased deaths, increased costs, rising prices, and supply disruptions, often exacerbated by a lack of preparation
Global conflict, along with climate change, lack of economic opportunities, and political polarization has sparked a huge migration of refugees fleeing not just war but famine, disease, and disruption of services. The movement is from south to north. That in turn causes problems for the northern economies of the EU and the U.S. where migrants are not necessarily welcomed by all.
The question is, what does all this mean for the stock market, interest rates, gold, oil, and currencies? Any one of or all of these risks could have a negative—or positive—impact on markets.
In last week’s Technical Scoop (October 16, 2023), we covered the oil markets. Gold is covered in this week’s Chart of the Week. The stock market faces huge risks. Interest rates are at their highest since the Great Recession of 2007–2009, while investor confidence, which was very high going into the high of January 2022, has fallen. Business and consumer confidence is trending at its lowest levels since the Great Recession and the steep recession of 1980–1982. Wars are raising the level of risk as to what they might mean for supply chains, prices, and the ability to spread into other areas. Climate disasters are more frequent, widespread, and severe. The costs in terms of displacement, destruction, and death are rising.
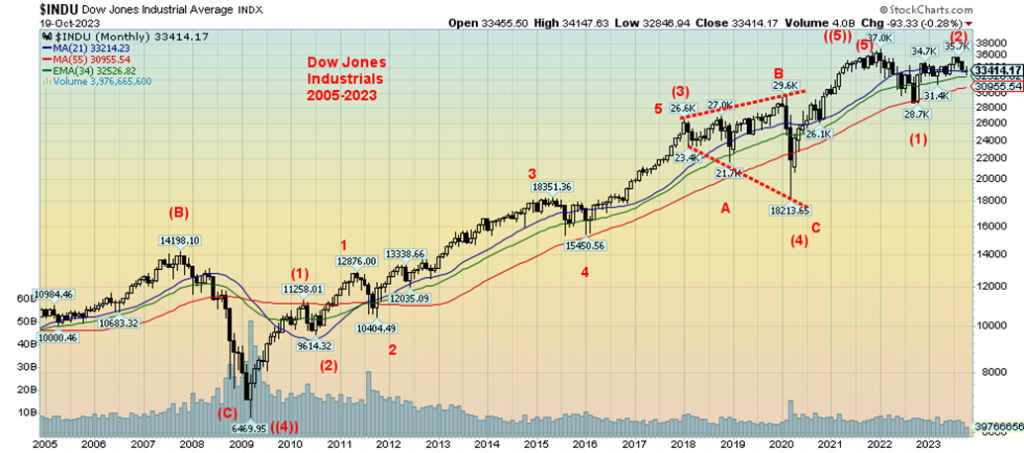
Below is a chart of the Dow Jones Industrials (DJI) from 2005 to the present. We have labeled the Elliott Waves based on those from Elliott Wave International (www.elliottwave.com). In Elliott Wave terms, advances are in five waves and corrections come in three waves (sometimes five, but as a consolidation or a zig-zag rather than a trend). Our chart of the DJI from the important DJI low in March 2009 shows how it rose in five waves to the peak in January 2022. We know it was the peak because the subsequent decline in 2022 took out a previous high seen in 2020 before the pandemic crash of March 2020. The DJI also fell over 22% into bear market territory. Other indices were down more; the NADAQ fell 38%. The subsequent recovery is our 2 wave or possibly a B wave to the upside. That wave may or may not make new highs but so far, we remain well short of the January 2022 highs. It is not unusual for B waves or a 2 wave to make new highs before falling sharply once again.
For the DJI, a breakdown under 31,400 and especially under 31,000 could signal we have begun the 3rd wave or C wave down that could take us to new lows below October 2022. Since it not as yet confirmed we are embarking on the down wave, new highs above 35,700 could keep this current rally alive.
Dow Jones Industrials 2005–2023
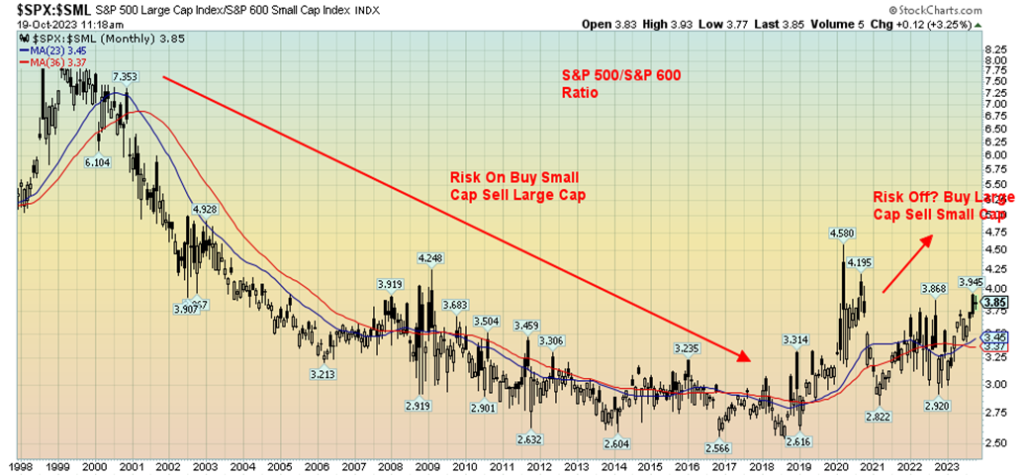
Second, we are witnessing a shift from small-cap stocks, as represented below by the S&P 600, to large-cap stocks as represented by the S&P 500. As the chart shows, except for some interruptions during the period of the financial crisis, small-cap stocks have mostly been in favor since 2000. The pandemic changed that as the rush was out of small caps into large caps.
Following the central banks’ decision to flood the markets with liquidity (quantitative easing or QE) and lower interest rates to unheard-of levels near or even below zero, small caps came into favor again. But interestingly, the ratio never made new lows, even as the S&P 500 and the S&P 600 soared to new all-time highs. The S&P 600 made its all-time high in November 2021 but made a much lower high in January 2022 when the S&P 500 made its all-time high. Now the ratio is rising once again in favour of large-cap stocks over small-cap stocks. The same phenomenon is occurring in the Canadian markets between the TSX Composite and the TSX Venture Exchange (CDNX).
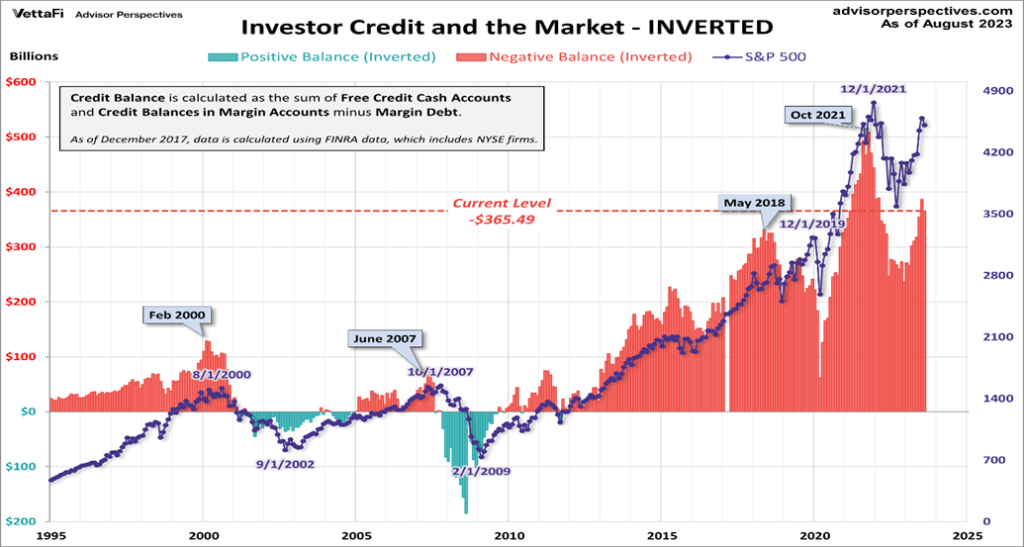
Surprisingly, investor sentiment remains high as measured by the Daily Sentiment Indicator and as we show below a chart of investor credit, including margin debt and the market, courtesy of Advisor Perspectives. While off the highs, it remains at levels high enough to suggest that it has further to fall. It is down from the highs seen in October 2021 before the market tops in November 2021 and January 2022. However, it is nowhere near the lows seen during the pandemic. During the 2008 financial crisis and the prior dot.com crash, investor credit actually went positive.
S&P 500/S&P 600 Ratio 1998–2023
Large Cap vs. Small Cap
On the economic front, things remain good in the U.S. Retail sales, weekly jobless claims, industrial production, building permits, and existing home sales all came in better than expected this past week. Housing starts were off. GDP growth rate for Q3 is now estimated to be 4%. That estimate, if correct, would leave other economies in the dust, including the EU, UK, and Japan. High growth rates are left for the second tier of countries that including India. That other parts of the world are not doing so well is not a surprise.
The EU is too close to and entangled in the Russia/Ukraine war, the U.K. has been in decline for some time, and Japan is perpetually an underperformer. China, the world’s second-largest economy, is burdened by the ongoing collapse in the real estate sector led by Evergrande and Country Garden, the two largest real estate companies. Both are bankrupt. Both have a global reach. China is held up through government support as they try and push for a more consumer-oriented society, services rather than manufacturing, plus the ongoing shift to urban from rural.
The Israeli economy is potentially poised to reel in their war with Hamas. To fill reservists’ positions, almost 400,000 men and women have been pulled out of the economy to serve in the military. Many are the backbone of its economy, including Israel’s valued high-tech industry. It includes IT-specialists, teachers, accountants, and more. Ultra-Orthodox men are excused for religious reasons, even as they make up a significant portion of the population. Israel has strong foreign reserves and receives aid, particularly from the U.S. The Tel Aviv stock exchange has fallen into bear territory.
Investment is fleeing. The shekel has been falling. The development of a natural gas field and hub has been put on hold. However, the economy has been stumbling since the election of the Netanyahu government and its attempts to overthrow the judiciary, sparking huge protests. They are also under review for a possible credit rating downgrade. As to the Palestinians? They are on life support, their economy is a basket case, they are a failed state.
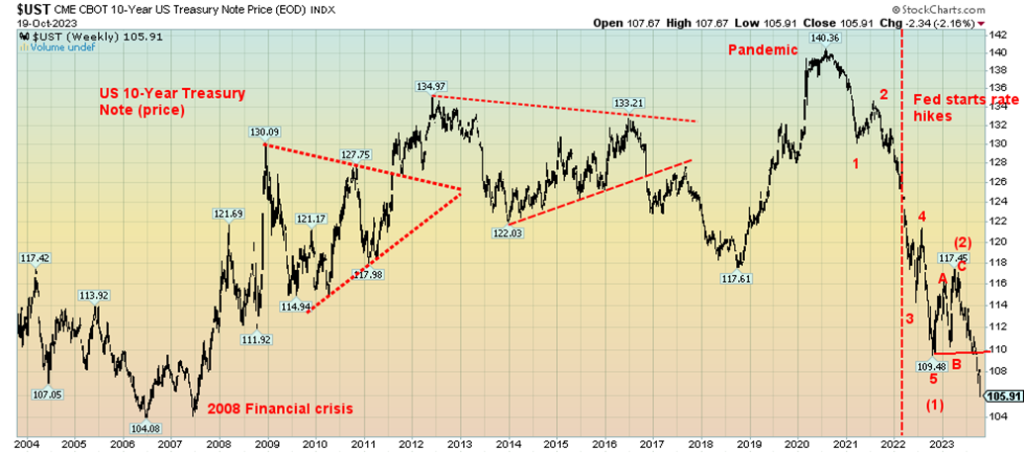
Bonds are starting to fall in a serious price decline (yields rise as prices move inversely to yields). The U.S. 10-year treasury note is in a bear market, having fallen some 25% from its highs in July 2020 during the COVID pandemic.
The chart below shows the U.S. 10-year treasury note. For a more dramatic picture of the bond bear, we note that the 30-year treasury bond has fallen 41% since its 2020 peak. This almost equals the price drop from 1977 to 1981 when the 30-year dropped 43%, marking one of the biggest bond bears ever. The current drop far surpasses bond bears in 1984 (down 25%), 1987 (down 24%), 1994 (down 25%), 2000 (down 22%), and 2018 (down 23%). Recent bond auctions have been messy, with buyers disappearing.
Included among the bond buyers no longer buying are the Fed, China, and Japan. The Fed is not buying because it has been conducting quantitative tightening (QT). Buying would send the message that QT is over. The Fed is allowing bonds to roll off as opposed to selling them outright. China, previously a big buyer, is not buying because of the ongoing conflicts with the U.S. over Taiwan and trade. Japan has a sinking Japanese yen to deal with. Slack has been picked up by some other central banks, notably the Bank of Canada, but also by intragovernmental agencies such as Fannie Mae and Freddie Mac. The result is that dealers are becoming stuck with an increasing number of bonds and they are having trouble selling them to their host of buyers, such as pension funds, mutual funds, and private equity funds. Previously dealers took down roughly 10/11% of the auction. Now it is up to 18% or more. That puts pressure on their inventories that need constant financing.
US 10-Year Treasury Note (price) 2004–2023
The U.S. 10-year note is rapidly approaching 5% while the 20-year bond and the 30-year bond now exceed 5%. That helps push up mortgage rates, which are now up to around 8%. In turn, that puts pressure on home buyers who need to remortgage. So far, the U.S. is not experiencing much weakening in economic numbers. There have been layoffs announced at some institutions, but we won’t see the impact until at least next month or December. Fed Chair Jerome Powell recent remarks indicated while there still might be a need for higher interest rates, he was less hawkish then in previous talks. Irrespective, the bond auctions have recently been poorly received. But stronger than expected economic numbers and inflation coming down reluctantly means that interest rates are likely to stay high for longer than many would like.
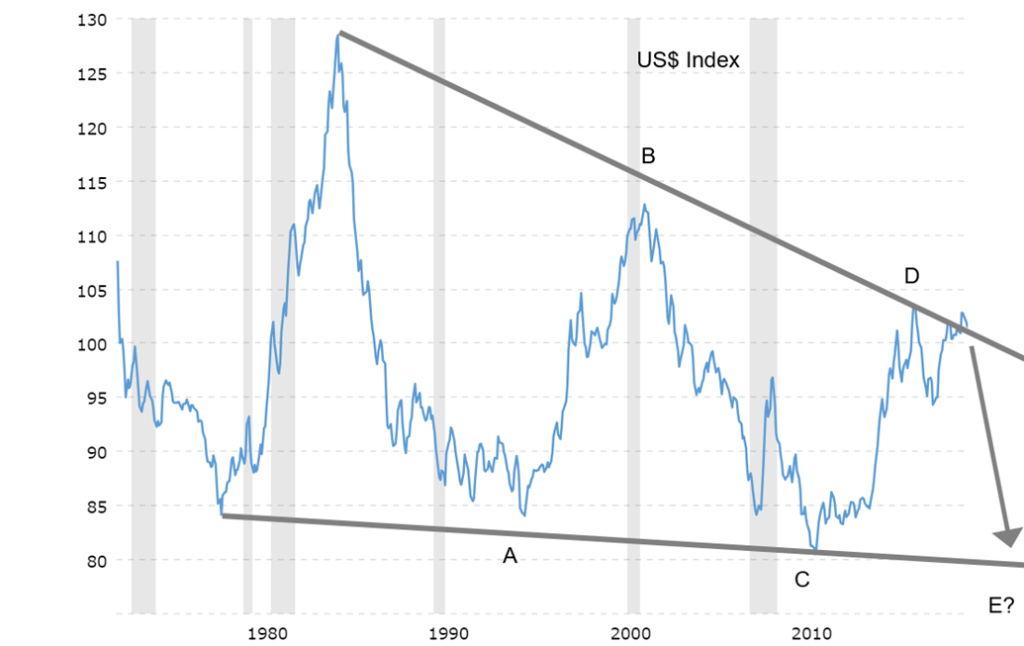
As to the US$ Index, it remains high but still well down from the high of October 2022. The US$ Index has been in a long downward trend since its peak in February 1985. The US$ Index has been in a long-term downtrend since the former U.S. president Richard Nixon took the world off the gold standard in August 1971. Our chart on the next page shows the long-term deterioration in the US$ Index.
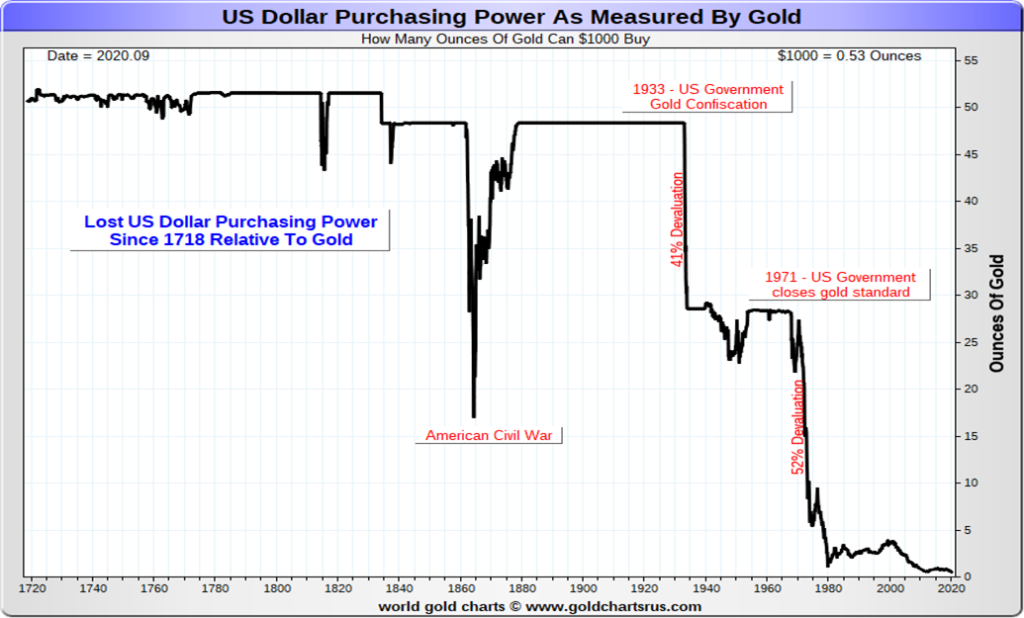
The result is that the purchasing power of the U.S. dollar has only fallen. Our favourite comparison is: what does it take to purchase an ounce of gold? Today, US$1,000 will only buy you roughly 0.50 ounces of gold. Back in 1971 before the gold standard ended, US$1,000 would get you 28.5 ounces of gold. Today, you’d need $57,000 to purchase that 28.5 ounces of gold. That’s inflation and huge loss of purchasing power.
US$ Index 1973–2023
During our 50 years in markets, we’ve been through a number of ups and downs: the inflationary 1970s, Watergate, the Arab oil embargo, the Iranian hostage crisis, the 1987 stock market crash, the invasion of Iraq (twice), the high-tech/dot.com bubble and bust, 9/11, housing bubbles 2004-2007 and again 2020-2022, the 2008 financial crisis, the pandemic, the stock market bubble after the pandemic, and now the Russia/Ukraine war and the Israel/Hamas war that could threaten to expand and destabilize the world. We’ve been through eight recessions. But throughout it all, markets kept going higher, despite the sideways markets of 1966–1982 and the bear markets of 2000–2009. Gold went through two bubbles: first in 1980, then again in 2011. Both were followed by a huge crash. Oil prices are heavily influenced by conflicts.
Risks abound and the current situation is as bad as any we have seen during our fifty years. In times of trouble, that’s when investors should be raising cash and buying gold. Equities and bonds should continue to be poor or, at best, mediocre performers.
If there is one constant, it is risk. But today risk is rising. Our final chart is one of price performance for selected assets since 2000. Gold has been the big winner and should continue to be.
Price Performance Selected Assets Gold, S&P 500, TSX, 10-year US, Oil 2000–2023
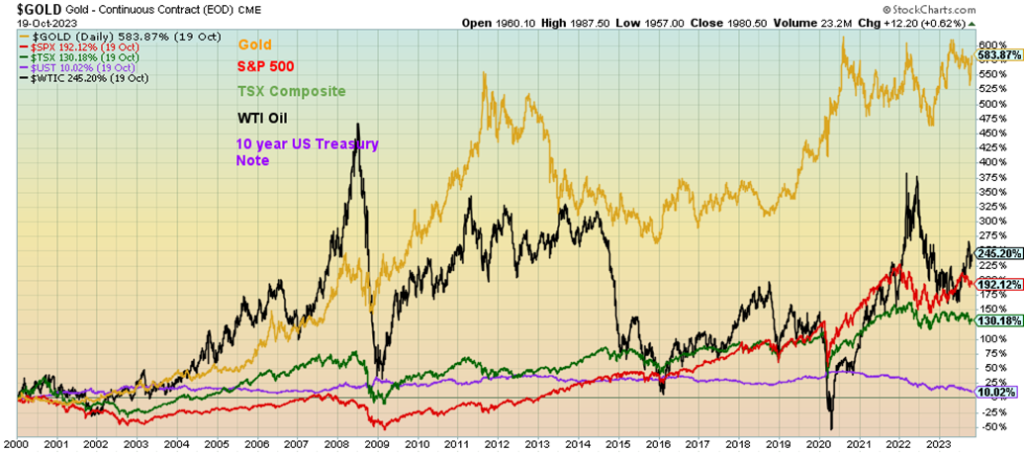
Chart of the Week
Gold Weekly 2018–2023
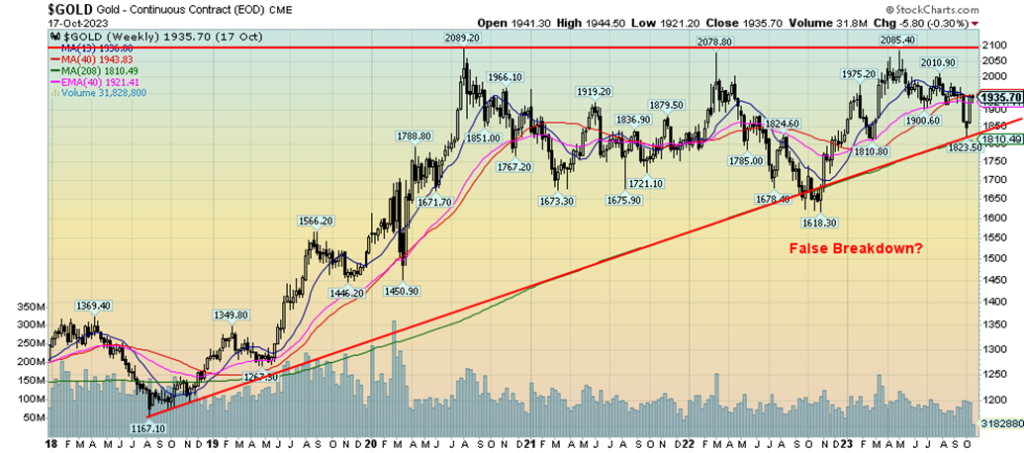
Gold, we believe, is getting ready for a multi-year breakout. The weekly chart above dating from an important low in 2018 shows a steady rising trendline. Now we are caught between the rising trendline and a fairly flat top pattern with important highs in August 2020 at $2,089, March 2022 at $2,078, and May 2023 at $2,085. What we appear to have is an ascending triangle, although admittedly not a classic one. What we do have is a long period of consolidation that was preceded by a sharp rise from the low in 2018 at $1,618 to the August 2020 top at $2,089. That has been followed by the consolidation with two more tops, roughly at the same price. That part is a classic ascending triangle.
The bottoms should be rising, but, instead, we got what appears to be a false breakdown in September/October 2022. The rebound took us right back into the consolidation pattern. In early October 2023, we appeared to be breaking down once again, but the upward sloping trendline held. Now we are rising once again, even as we have more work to do to make new all-time highs above $2,100. Measuring implications for the pattern suggests that gold could go as high as $2,500. Other measurements suggest up to $2,600. As we have noted previously, we need to get over $2,025 to suggest that the new highs above $2,100 are possible.
Gold has been making new highs in some other currencies. In major currencies, gold has recently made new all-time highs in Japanese yen and Australian dollars. These are the leaders. Others, such as the euro, the pound, the Swiss franc, and the Canadian dollar are not far behind. It seems now that gold in U.S dollars may also not be far behind. Could this fail? Yes. But we believe we’d need to break down under $1,800 to suggest that.
What is interesting is, as we have noted before, we have been looking for the 7.83-year cycle low last seen in December 2015 at $1,045, as well as the 23.5-year cycle low last seen with a double bottom in July 1999 and again in April 2001 at $251 and $255. But the last low before gold took off to the August 2020 high was seen in August 2018. What all that implies is that our low is now going to much higher than where it was in 2018 at $1,167. That leaves only the breakdown low at $1,618 seen in November 2022. That low is within the orb for the 7.83-year cycle which was due 2022–2024. For the 23.5-year cycle low the orb also goes from 2022–2025 although arguably it could be wider 2018-2028. All this appears to suggest that we have already seen our low in early November 2022. Confirmation comes with a move above $2,100.
Triple tops are extremely rare. And the forming ascending triangle suggests that we should break out to the upside.
As to gold miners and silver, both appear to be also moving higher. Gold miners, as we have noted, remain undervalued and under-owned. Doug Casey, founder and chairman of Casey Research, who has often written on gold says buying gold stocks is like trying to force the water behind the Hoover Dam through a garden hose. As for silver, is has also lagged considerably and, even as gold was making new highs, silver was nowhere near its all-time highs. The gold/silver ratio remains at very high levels as it is forming what appears to be a large top, meaning going forward silver prices should lead gold. Gold, unlike stocks, bonds, and even gold miners, has no liability. No wonder it has been around for thousands of years as a store of wealth and money.
Markets & Trends
| % Gains (Losses) Trends | ||||||||
| Close Dec 31/22 | Close Oct 20, 2023 | Week | YTD | Daily (Short Term) | Weekly (Intermediate) | Monthly (Long Term) | ||
| Stock Market Indices | ||||||||
| S&P 500 | 3,839.50 | 4,224.16 | (2.4)% | 10.0% | down | neutral | up | |
| Dow Jones Industrials | 33,147.25 | 33,127.28 | (1.6)% | (0.6)% | down | down (weak) | up | |
| Dow Jones Transport | 13,391.91 | 14,450.41 | (1.7)% | 7.9% | down | neutral | up | |
| NASDAQ | 10,466.48 | 12,983.81 | (3.2)% | 24.1% | down | up (weak) | up | |
| S&P/TSX Composite | 19,384.92 | 19,115.64 | (1.8)% | (1.4)% | down | down | neutral | |
| S&P/TSX Venture (CDNX) | 570.27 | 520.74 | (1.6)% | (8.7)% | down | down | down | |
| S&P 600 (small) | 1,157.53 | 1,093.47 | (1.7)% | (5.5)% | down | down | down | |
| MSCI World | 1,977.74 | 1,996.81 | (2.9)% | 1.0% | down | down | down (weak) | |
| Bitcoin | 16,531.31 | 29,576.50 | 9.9% | 78.9% | up | up | neutral | |
| Gold Mining Stock Indices | ||||||||
| Gold Bugs Index (HUI) | 229.75 | 228.65 | 2.3% | (0.5)% | up | down (weak) | down | |
| TSX Gold Index (TGD) | 277.68 | 281.19 | 2.5% | 1.3% | up | down (weak) | down | |
| % | ||||||||
| U.S. 10-Year Treasury Bond yield | 3.88% | 4.91% | 6.5% | 26.6% | ||||
| Cdn. 10-Year Bond CGB yield | 3.29% | 4.08% | 2.8% | 24.0% | ||||
| Recession Watch Spreads | ||||||||
| U.S. 2-year 10-year Treasury spread | (0.55)% | (0.16)% | (64.4)% | (70.9)% | ||||
| Cdn 2-year 10-year CGB spread | (0.76)% | (0.70)% | (21.4)% | (7.9)% | ||||
| Currencies | ||||||||
| US$ Index | 103.27 | 106.17 | (0.5)% | 2.8% | up | up | up | |
| Canadian $ | 73.92 | 73.04 | (0.4)% | (1.2)% | down | down | down | |
| Euro | 107.04 | 105.93 | 0.8% | (1.0)% | down (weak) | down | down | |
| Swiss Franc | 108.15 | 112.10 | 1.1% | 3.7% | up | neutral | up | |
| British Pound | 120.96 | 121.61 | 0.2% | 0.5% | down | down | neutral | |
| Japanese Yen | 76.27 | 66.74 | (0.2)% | (12.5)% | down | down | down | |
| Precious Metals | ||||||||
| Gold | 1,826.20 | 1,994.40 | 2.7% | 9.2% | up | up (weak) | up | |
| Silver | 24.04 | 23.50 | 2.6% | (2.3)% | up (weak) | neutral | neutral | |
| Platinum | 1,082.90 | 905.1 | 2.4% | (16.4)% | down (weak) | down | down | |
| Base Metals | ||||||||
| Palladium | 1,798.00 | 1,111.20 | (3.0)% | (38.2)% | down | down | down | |
| Copper | 3.81 | 3.56 | (0.3% | (6.6)% | down | down | neutral | |
| Energy | ||||||||
| WTI Oil | 80.26 | 88.08 | 0.4% | 9.7% | up (weak) | up | up | |
| Nat Gas | 4.48 | 2.90 | (10.4)% | (35.3)% | neutral | up | down (weak) | |
New highs/lows refer to new 52-week highs/lows and, in some cases, all-time highs.
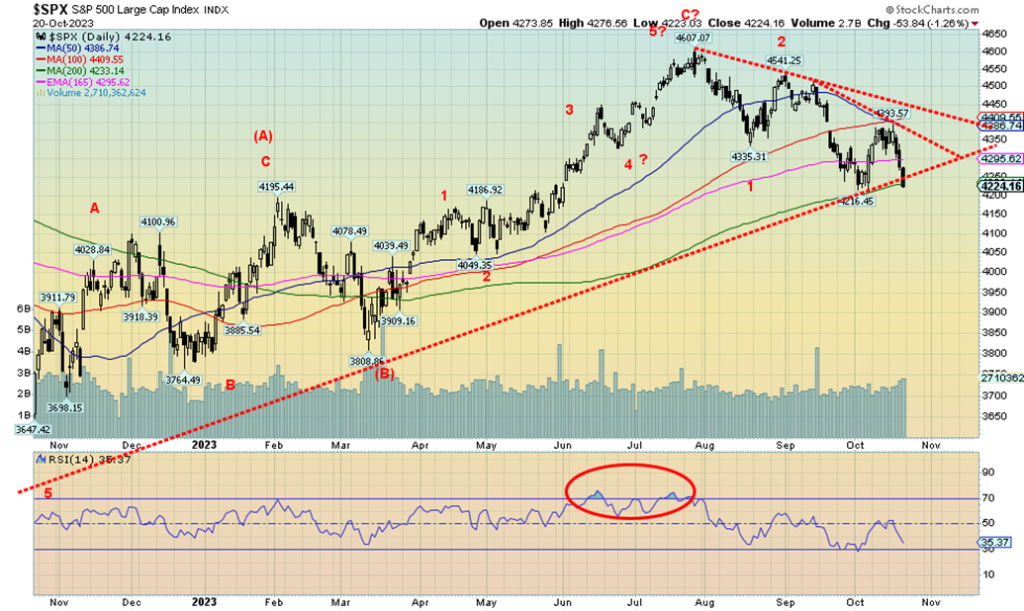
Middle East worries, chaos in the U.S. government, and rising bond yields are offsetting any good news on the economic front. Markets fell this past week. The S&P 500 appears to have penetrated that uptrend line coming from the October 2022 low. If that’s correct, it could signal that the rebound rally is over and we are in the throes of a new leg to the downside. If the downtrend from January 2022 to October 2022 was the A wave down, and the rally from October 2022 to the recent top in July 2022 is the B wave up, then a more devastating C decline could be underway. Note that the S&P 500 also fell to the 200-day MA this past week. A firm break under 4,200 could signal further declines ahead. We are currently down just over 8% from that July top.
On the week, the S&P 500 fell 2.4%, the S&P 500 Equal Weight Index was down 2.4%, the Dow Jones Industrials (DJI) dropped 1.6% and is now mildly negative on the year, off just under 0.1%, the Dow Jones Transportations (DJT) dropped 1.7%, while the NASDAQ fell 3.2%, led by a decline of 3.3% for the NY FANG Index. The S&P 400 (Mid) fell 2.0% and the S&P 600 (Small) dropped 1.7%.
Elsewhere, the TSX Composite was buoyed by golds and materials but still lost 1.8%, while the junior TSX Venture Exchange (CDNX) continued its woes, down 1.6%. In the EU, the London FTSE was down 2.6%, the EuroNext was down 2.7%, the Paris CAC 40 off 2.7%, and the German DAX dropped 2.6%. No joy in the EU. In Asia, China’s Shanghai Index (SSEC) fell 3.4%, the Tokyo Nikkei Dow (TKN) dropped 3.3%, while Hong Kong’s Hang Seng (HSI) fell 3.6%. The world MSCI World Index fell 2.9%. If there was a star on the week it was Bitcoin, up 9.9%. Bitcoin a safe haven?
We’ve seen a number of bulls around looking for the classic rally into year end. But we are not seeing that yet, as war wages, chaos continues in the U.S., and interest rates (long bonds) keep rising. The danger is that, instead of a rally, we have a crash. We passed the anniversary of the October 19, 1987 crash this past week, so far unscathed, but looming is the 94th anniversary of the October 28–29, 1929 crash. Two dates stood out: October 24, known as Black Thursday, and October 29, known as Black Tuesday. The crash got underway in earnest when the DJI broke the 200-day MA on October 21, 1929.
With sentiment still high despite the background of war, government dysfunction, and rising bond yields, we could be setting ourselves up for an unsettling couple of weeks. When the panic button is hit, it takes no prisoners. Good thing one can’t jump out windows like they did in 1929.
It will be interesting to see how the markets open Sunday night with the negatives noted hanging on. Watch that break of 4,200. But a return back above 4,300 would be good, and above 4,400 could end talk of a collapse.
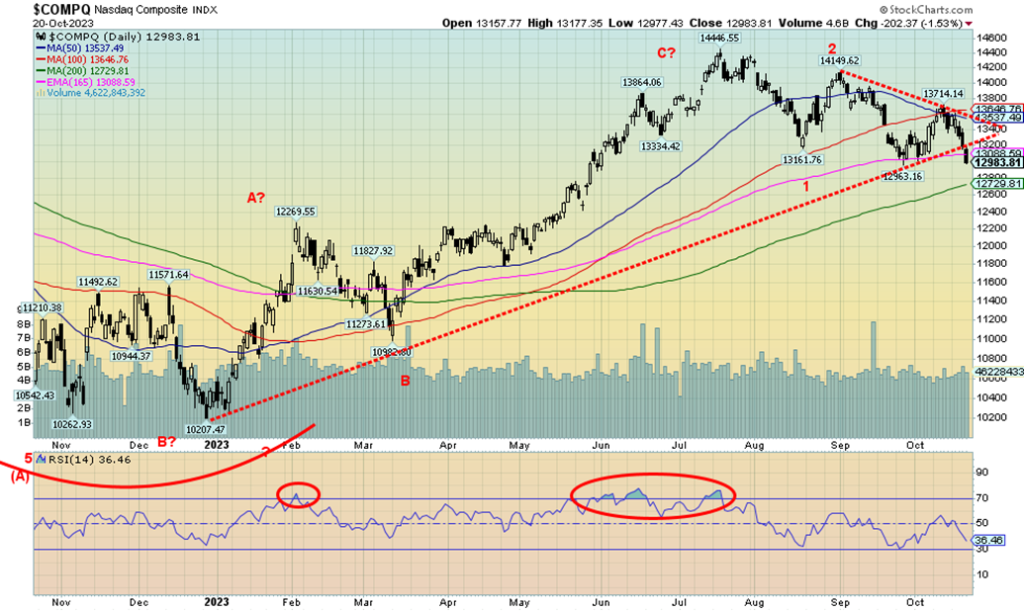
The NASDAQ took a hit this past week, falling 3.2% and breaking the uptrend line from the 2022 low. The decline in the NASDAQ was led by the FAANGs as the NY FANG Index fell 3.3%. Leading the way down for the FAANGs was Tesla, that dropped 15.6%. But Tesla’s decline was offset by a big jump for Netflix, up 12.7%. Other big losers were Baidu, down 15.0%, and former star Nvidia down about 9.0%. If the high tech is being sold, the market has serious problems. They were the leaders on the way up and may now be poised to lead the way down. The NASDAQ has also formed a downtrend line. The NASDAQ would have to break above 13,700 to suggest to us that the downtrend is over. In the interim, the 200-day MA looms at 12,730. Many talk about how, seasonally, stocks rally as we hit the best six months and buy when it snows, sell when it goes. But we also remember 2018 when the NASDAQ and other indices topped in early October, then promptly fell 24% into a Christmas 2018 low. Other indices did far better, but they all fell. For whatever reason, that 2018 mini-bear seems to be largely forgotten, as a year and bit later we had the even bigger pandemic collapse in March 2020. Nonetheless, all were merely part of the bull market that got underway in March 2009 and finally topped in January 2022. The recent low was 12,963 and we are close to that level. A break of it would confirm the current downtrend in play.
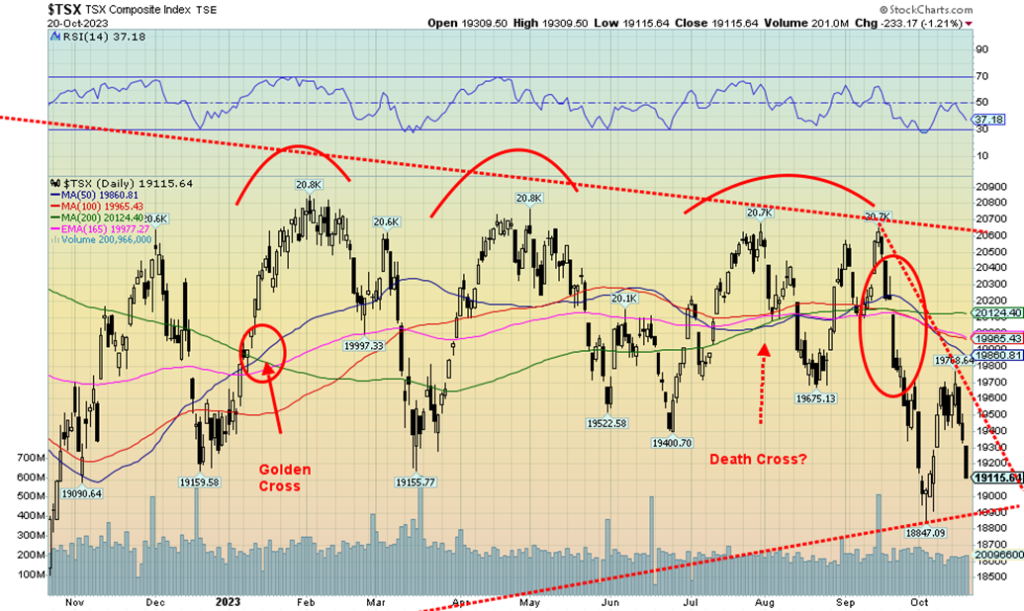
The TSX Composite followed the major U.S. indices lower this past week. Unlike the U.S. indices, the TSX was buoyed by a good performance from gold and materials. The TSX Composite lost 1.8% this past week and is now negative on the year by 1.4%. The junior TSX Venture Exchange (CDNX) continued its woes, falling 1.6%.
Only two sub-indices were up on the week. Golds (TGD) gained 2.5% while Materials (TMT) was up 1.5%. Energy (TEN) was effectively flat while Consumer Discretionary (TCD) was down 0.1%. Leading the way to the downside were Real Estate (TRE) off 7.9% and Income Trusts (TCM), down 5.3%. Utilities (TUT) dropped 4.9%, Telecommunications (TTS) fell 3.8%, and Financials (TFS) were down 3.6%. The signal, given all of them are influenced by interest rates, should most likely be avoided. Golds, materials, energy, and metals appear to be the safe place to be. Metals & Mining (TGM) did fall 1.0%.
The uptrend line is currently at 18,900 and a break of the level seems highly probable. The TSX is trading down only 8% from that high in January 2023, but we are also trading under all the moving averages, including the 200-day MA. We made the death cross several weeks ago. The all-time high was seen back in April 2022 and, while we are only down 14% from that high again, we note we are trading under all the key MAs, while both the short-term trend (daily) and intermediate trend (weekly) trends are pointed down. The long-term trend (monthly) is currently neutral. Choose your sector carefully. And golds, metals, materials and energy continue to appear to be the best ones to be in.
U.S. 10-year Treasury Bond/Canadian 10-year Government Bond (CGB)
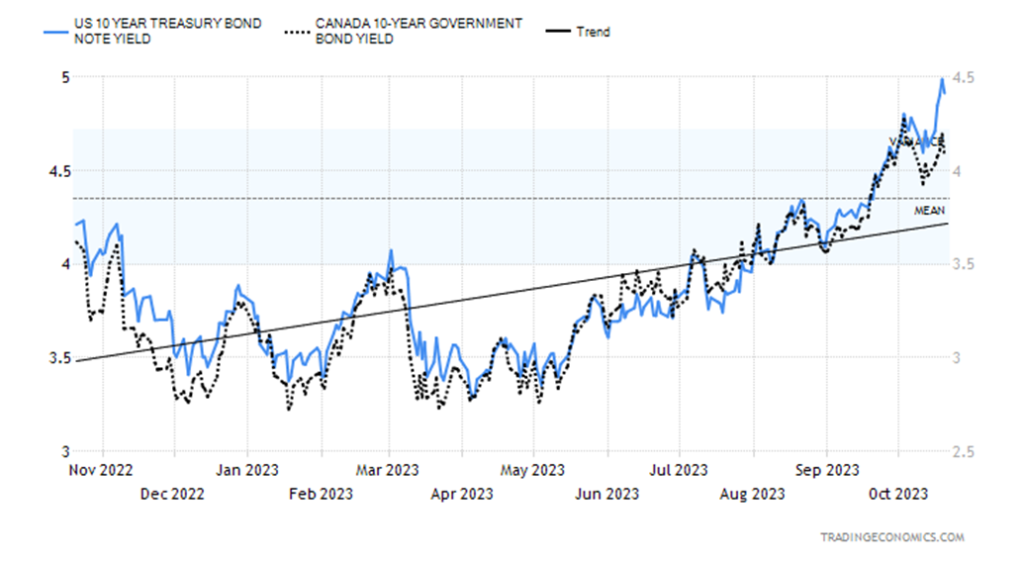
The U.S. 10-year treasury bond hit 4.99% this past week, the highest level since 2007. The U.S. 20-year and 30-year both went over 5%. The last two bond auctions have been notoriously sloppy as demand has dried up, with previous large buyers such as China and Japan not participating. The Fed, which has led quantitative tightening (QT), has also not participated, leaving it to intragovernmental agencies and others to pick up the slack. The big dealers, whose takedown is normally around 10–11%, took down 18–20%. That’s a lot of inventory for them to get rid of and finance. The closely-watched 2-year–10-year spread fell to negative 16 bp from negative 45 bp. The 3-month–10-year spread was at negative 65 bp vs. negative 99 bp a week ago. What that does is signal to us is that we are getting closer to the start of a recession, even as we are seeing only limited signs. But layoffs at high-tech firms and financial institutions are picking up. The next employment numbers are not out until November 3 and would not include layoffs in the latter part of October.
The Canadian 10-year Government of Canada bond (CGB) also jumped this week to 4.08% up from 3.97%. The 2–10 spread wasn’t as dramatic as the U.S. falling to negative 70 bp from negative 89 bp. Still, the direction is telling as the long end of the curve rises, even as the short end is now relatively stable.
Rising bond yields are eventually negative for the stock market. If the 10-year starts going above 5%, it could signal further declines in the stock market.
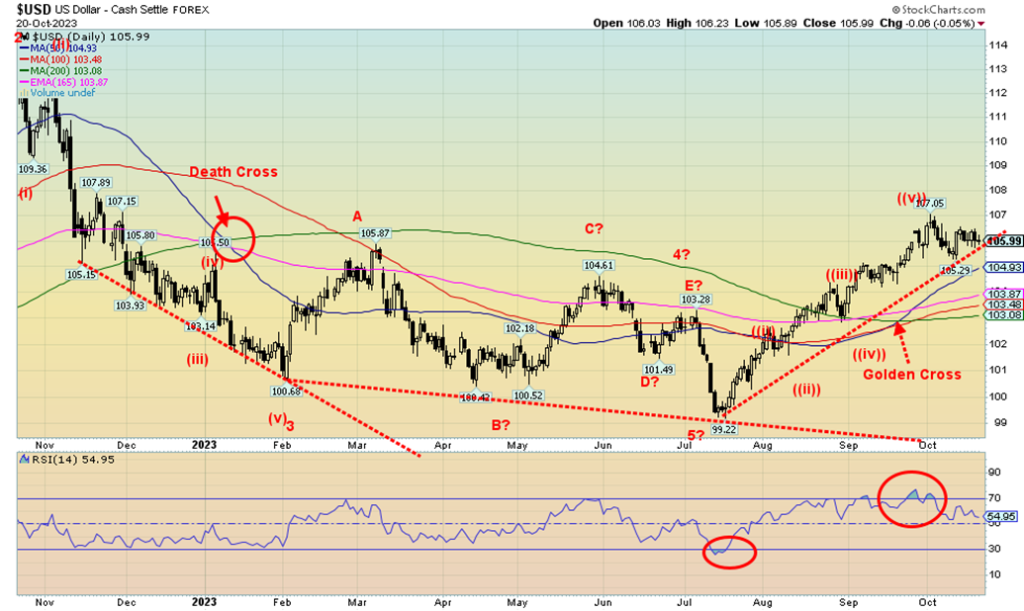
The US$ Index moved mostly sideways this past week with a small loss of 0.5%. The big winner of other currencies was the Swiss franc, which jumped 1.1%. The oversold euro was up 0.8%, pound sterling rose 0.2%, the Japanese yen fell 0.2%, and the Canadian dollar was down 0.4%. The Swiss franc is being perceived as a safe haven currency because of Switzerland’s long history of neutrality and secretive banks. The question, of course, is: has the US$ Index topped? As the Middle East conflict continues and the U.S. becomes more engrained in the conflict, the real risk is the U.S. becomes a part of the conflict, given attacks on it in Syria and Iraq. As well, the chaos in Congress over the election of a speaker highlights the growing dysfunction of the U.S. government. The U.S. dollar has been buoyed by the conflict in Russia/Ukraine, a stronger economy then its peers, with conflicts elsewhere encouraging capital to flee into the U.S. dollar and higher interest rates. A breakdown now under 105 could begin to confirm a top in the US$ Index. Under 103 a more serious decline could get underway. Only new highs above 107 would keep the uptrend alive.
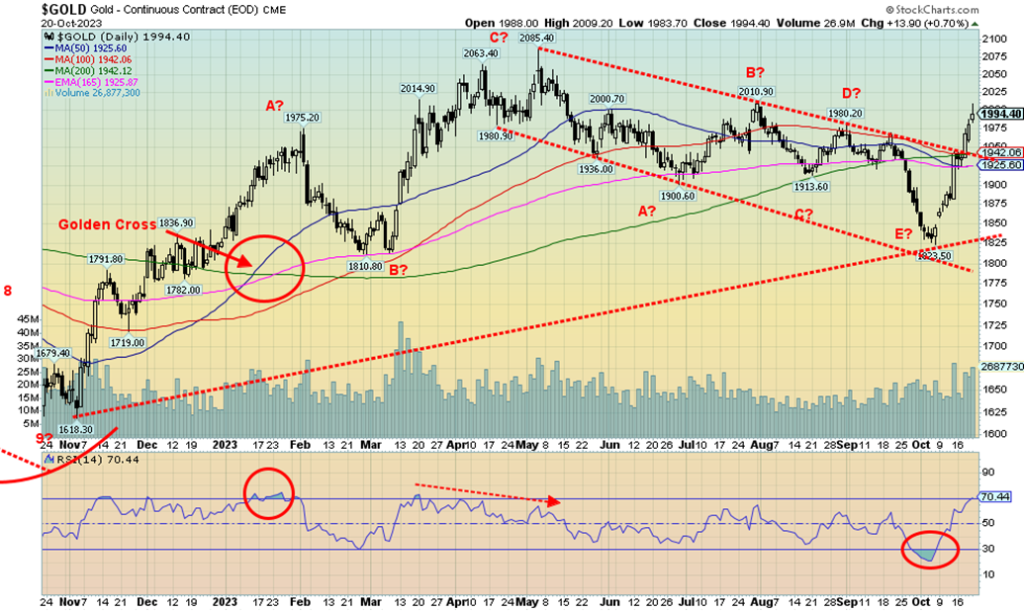
For the second week in a row, turmoil in the Middle East due to the Israeli/Hamas war pushed gold higher. The chaos and dysfunction in the U.S. over the election of the Speaker also played a role. And with given clashes between Hezbollah and attacks on U.S. bases in Syria and Iraq, plus rockets fired from Yemen, the risks of an even larger regional war are growing. In behind is Iran. War with Iran could engulf even more players.
Gold is seen as a safe haven from the ravages of war and government dysfunction. Gold set aside the still-strong US$ Index and rising interest rates at the longer end of the curve. Gold also set aside statements from Fed Chair Jerome Powell that indicated further interest rate hikes might be in store. However, he offset it by emphasizing the risks in further rate hikes. Gold is viewing all this as having the potential for chaos and is acting accordingly. As we note with our next chart, gold is beginning to make new highs in other currencies. Gold in U.S. dollars cannot be far behind. Once we are making new all-time highs in all currencies, a strong rally could get underway.
Gold briefly broke above $2,000 on Friday, a level we consider critical to see gold making new all-time highs. We noted that this level would be resistance and for the moment it is. We expect we could see it fall this coming week. Support now could be down to $1,980 and even down to $1,970. Only under $1,925 would we consider this bull move over. The commercial COT is at about 32%, not bearish, but not overly bullish either.
Above, besides resistance at $2,000 we see further resistance at $2,025, $2,050 and $2,075. But, once we break out over $2,100, potential targets are as high as $2,500/$2,600. It is becoming essential to own a bit of gold as a safe haven. Central banks are buying gold and that is the ultimate statement on gold.
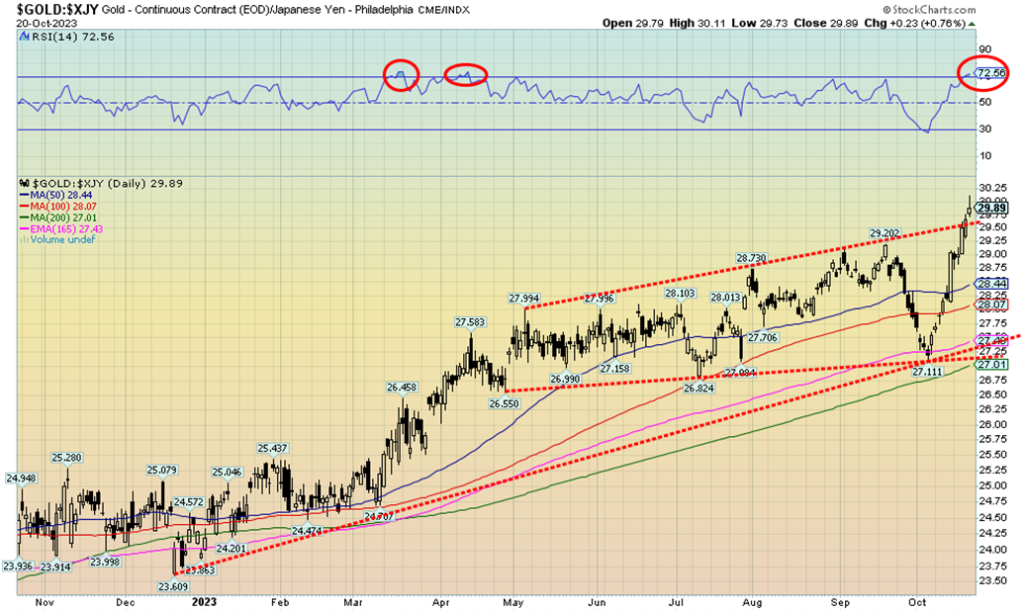
Gold in Japanese yen has broken out to new all-time highs. A rising or ascending triangle preceded the breakout. The potential target is 32.2 another 7.5% from current levels. The yen is not the only one to be making new all-time highs. The euro also did this past week, but so far it is barely new all-time highs. Follow-through this coming week would be important. The only other one of note is the Australian dollar, which is also making new all-time highs. The Canadian dollar, the pound sterling, and the Swiss franc still lag. Gold in Chinese yuan broke out this past week, but remains just short of all-time highs set back in 2020. Numerous lesser currencies are also seeing new all-time highs for gold. When gold is making all-time highs in all currencies, a major bull market would be underway. Gold in yen is a bit overbought, as seen by an RSI at 72.5, but if a strong market is underway, it can remain that way for some time.
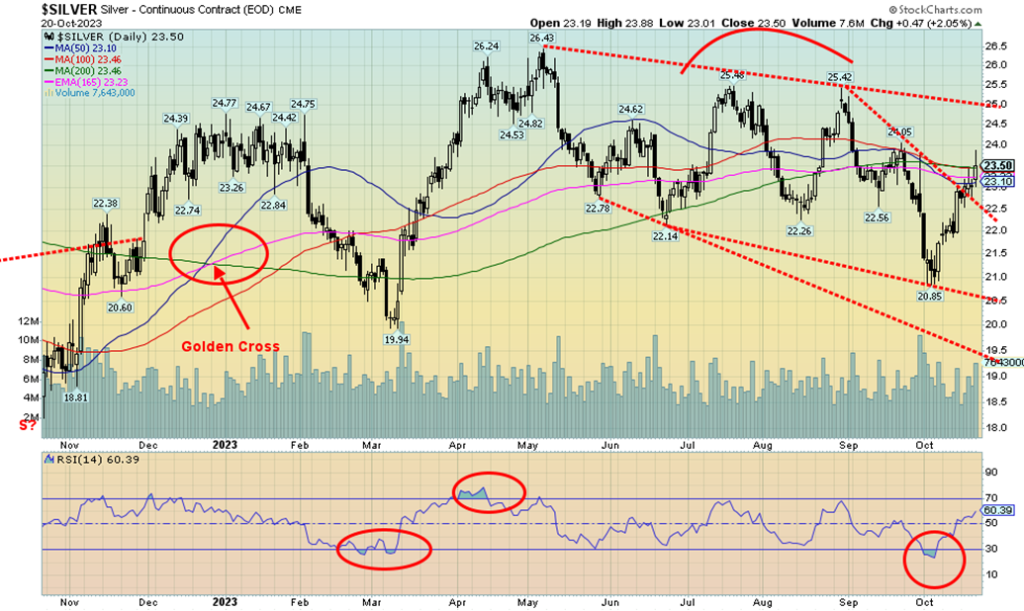
Silver enjoyed a good up week, gaining 2.6% and for a change outperforming gold (slightly). But silver ran into resistance at the 200-day MA near $23.50. We expect that we should break over that level this coming week. We did break over the downtrend line from the August high. We still have a lot of work to do. Silver, unlike gold, never made new all-time highs. The high was $30.35 back in February 2021 vs. the all-time high at $48.70 back in January 1980. It was almost equaled in April 2011. The 1980 high remains the landmark. Our breakout trendline is now at $25, but we’d feel better over $26. Once over $25 the odds of new highs above $26.43 in July become probable. The commercial COT for silver is reported at 35%, about the same as the previous week. Not super bullish but positive nonetheless. Only a return now back under $22.50 would get us worried that the rally is over. It would be reinforced under $22.
Uranium 1998–2023
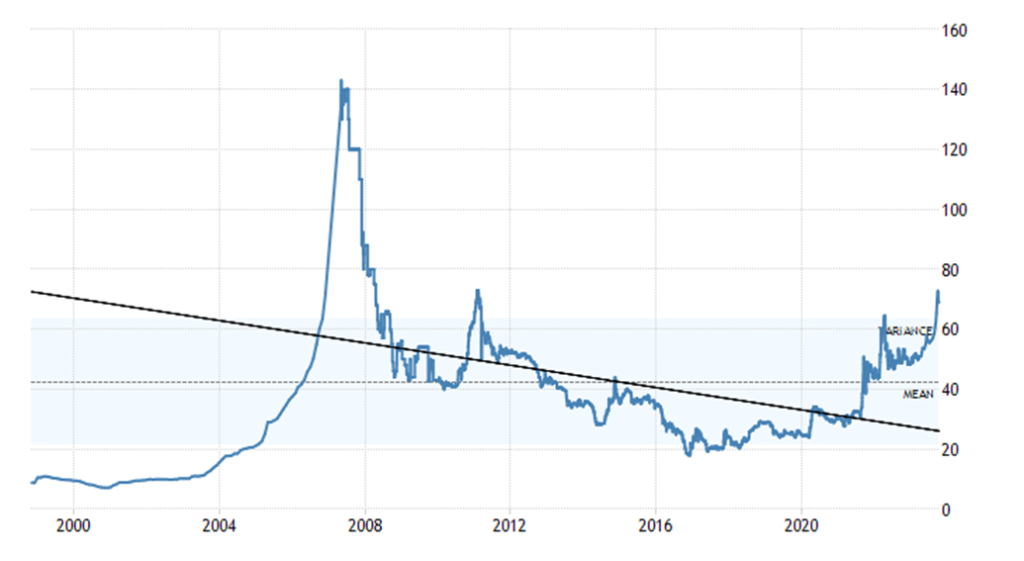
Uranium prices have broken out to new highs, hitting at one point over $70 before settling back. Uranium is up over 41% thus far this year due to low inventories, threats to supplies, and increased demand as countries are switching to building nuclear plants. China alone is poised to build at least 32 and Japan is restarting a number. Both the largest producer and reserves in the world are in Australia. Canada is a significant producer #2 and reserves #3. Russia is also high as is a Russian satellite Kazakhstan. Numerous uranium stocks are up on the year and with uranium prices poised to move higher, the stocks should do well. The all-time high was seen back in 2007 at over $140.
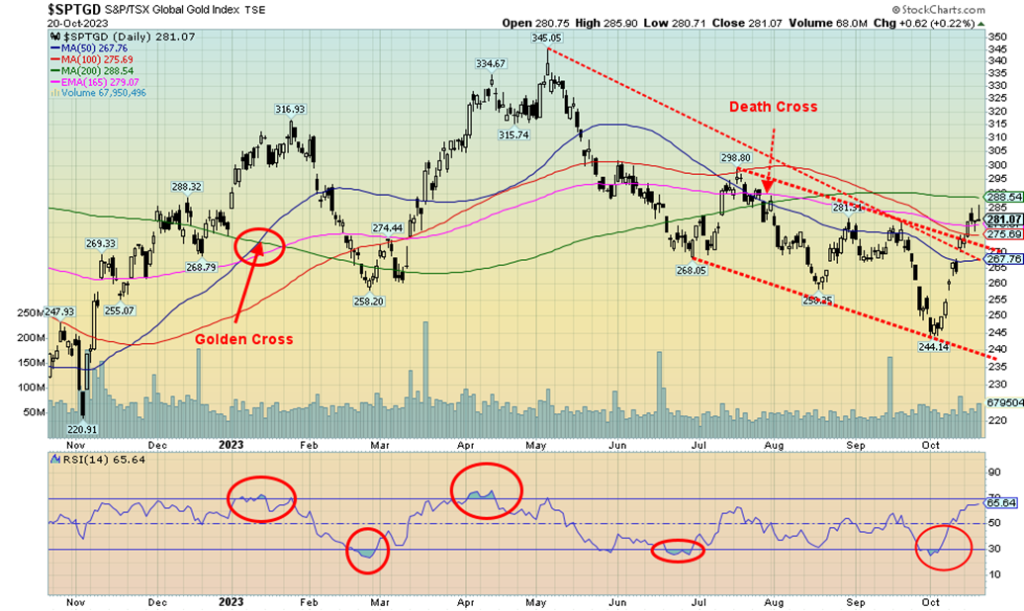
Given good performances from both gold and silver, we’d have hoped the gold stocks would have performed better. But then we did run into technical resistance, some profit-taking, and weakness in the broader market. Still, the gold stocks were one of the few bright spots this past week. The TSX Gold Index (TGD) gained 2.5% while the Gold Bugs Index (HUI) was up 2.3%. The TGD broke out over its downtrend from the May high. The pattern formed has the look of an incomplete descending wedge triangle. If that’s correct, then the measuring implications are for a move back towards the May high at 345. The all-time high set in 2011 remains elusive at 455. The TGD jumped higher from oversold levels and the Gold Miners Bullish Percent Index (BPGDM) has improved to about 18% up from about 11%. That tells us we still have considerable room to move higher before we are anywhere near overbought. The RSI at 65.5 is high but has room to move higher. However, resistance lies just above at the 200-day MA near 288.5. Once over 300, the rally should get going in earnest. Over 320 new highs above 345 become highly probable. The message appears to be to buy gold stocks. The short-term trend has turned up, but both the intermediate and long-term trends remain down, although the intermediate is weakening.
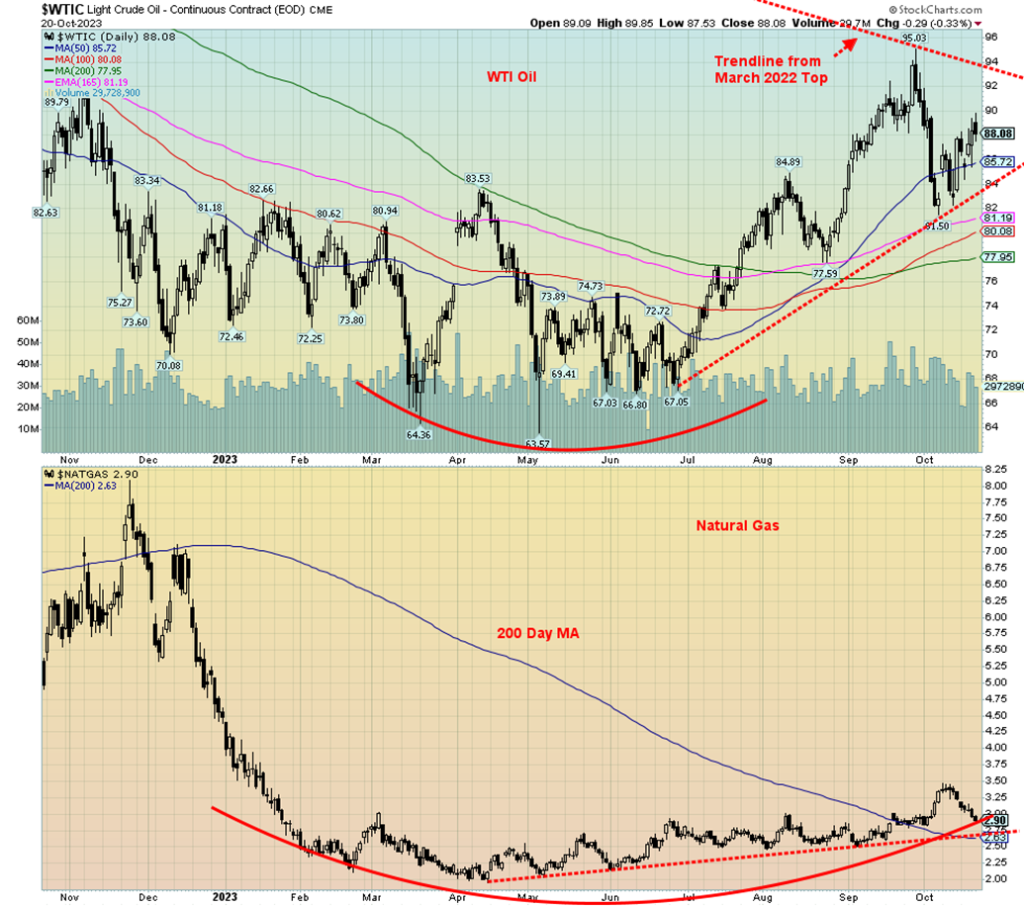
Considering everything that is going on, oil is up but we’re surprised it wasn’t up more this past week. The U.S. lifted some sanctions on Venezuela this past week, which helped keep a lid on prices. It was, however, offset by the U.S. announcing it would be refilling its Strategic Petroleum Reserves (SPR). However, tension remains high as the U.S. intercepted missiles from Yemen directed at Israel. As well, U.S. bases in Syria and Iraq faced some attacks. All of this is stoking fears of a wider regional war that could include dragging the U.S. into the war. Sitting in the background is Iran with its connections to Syria, Iraq, Yemen, and Hezbollah in Lebanon. As well, it is widely understood that Iran also backed Hamas. As has been noted many times, Iran sits adjacent to the Straits of Hormuz, through which upwards of 30% of the world’s oil passes through. Whether they’d be successful in blocking the straits is open to question, given the proximity of the U.S. 7th fleet in Bahrain. Nonetheless, that would widen the war considerably, possibly even dragging in Russia and China that would back Iran.
WTI oil rose 0.4% this past week while Brent crude was up 1.2%. Natural gas (NG) floundered as the Henry Hub NG fell 10.4% while the EU Dutch Hub was off 5.3%. NG is being helped by forecasts that we could be facing a mild winter, not only in North America but also in Europe. European storage is estimated at 98% full so it lessens the need, even as a gas field was shut down off of Israel because of the war. Production has been high in North America as well. Despite that, NG is maintaining an upward trend with support down to the 200-day MA currently near $2.63.
The energy indices both made fresh all-time highs this past week but both reversed on Friday and closed lower, signaling a possible top of at least a temporary nature. The ARCA Oil & Gas Index (XOI) rose 0.9%, but the TSX Energy Index (TEN) fell a small 0.1%.
What’s key going forward for oil prices is the ongoing war in the Middle East. If the U.S. becomes involved and clashes intensify with other players in Syria and Iraq, the potential for Iran to become involved rises. That in turn could send oil prices well past $100. The uptrend line comes in around $84 and if that broke, then at minimum a temporary top would be in.
Copyright David Chapman 2023
__
(Featured image by Adam Nowakowski via Unsplash)
DISCLAIMER: This article was written by a third party contributor and does not reflect the opinion of Born2Invest, its management, staff or its associates. Please review our disclaimer for more information.
This article may include forward-looking statements. These forward-looking statements generally are identified by the words “believe,” “project,” “estimate,” “become,” “plan,” “will,” and similar expressions. These forward-looking statements involve known and unknown risks as well as uncertainties, including those discussed in the following cautionary statements and elsewhere in this article and on this site. Although the Company may believe that its expectations are based on reasonable assumptions, the actual results that the Company may achieve may differ materially from any forward-looking statements, which reflect the opinions of the management of the Company only as of the date hereof. Additionally, please make sure to read these important disclosures.
David Chapman is not a registered advisory service and is not an exempt market dealer (EMD) nor a licensed financial advisor. He does not and cannot give individualised market advice. David Chapman has worked in the financial industry for over 40 years including large financial corporations, banks, and investment dealers. The information in this newsletter is intended only for informational and educational purposes. It should not be construed as an offer, a solicitation of an offer or sale of any security. Every effort is made to provide accurate and complete information. However, we cannot guarantee that there will be no errors. We make no claims, promises or guarantees about the accuracy, completeness, or adequacy of the contents of this commentary and expressly disclaim liability for errors and omissions in the contents of this commentary. David Chapman will always use his best efforts to ensure the accuracy and timeliness of all information. The reader assumes all risk when trading in securities and David Chapman advises consulting a licensed professional financial advisor or portfolio manager such as Enriched Investing Incorporated before proceeding with any trade or idea presented in this newsletter. David Chapman may own shares in companies mentioned in this newsletter. Before making an investment, prospective investors should review each security’s offering documents which summarize the objectives, fees, expenses and associated risks. David Chapman shares his ideas and opinions for informational and educational purposes only and expects the reader to perform due diligence before considering a position in any security. That includes consulting with your own licensed professional financial advisor such as Enriched Investing Incorporated. Performance is not guaranteed, values change frequently, and past performance may not be repeated.


Morocco’s Budget Execution June 2026: Deficit Narrows to 20.2 MMDH
Morocco’s Finance Law execution at end-June 2026 shows a reduced budget deficit of 20.2 billion dirhams, down from 24.9 billion...

Tilray Brands Hits Multi-Year Lows as Cannabis Investors Await Regulatory Clarity
Tilray Brands shares have fallen 57% this year amid cannabis sector weakness and uncertainty over US regulatory reform. While potential...


Ethereum Between ETF Inflows, Price Risks and a Strong July
Ethereum faces mixed signals as ETF inflows and a strong July performance support recovery, while technical resistance and downside risks...


Mercedes-Benz Accelerates EV Decarbonization With Recycled Aluminum
Mercedes-Benz expands its partnership with Hydro to accelerate supply chain decarbonization. Future electric vehicles will use Hydro CIRCAL aluminum containing...

Evotec and BioGaia Boost Biotech, while Vitrolife Disappoints
European stocks moved on earnings and broker actions. Evotec, BioGaia, Plus500, Pharming, Inwido, Amundi and Julius Baer rallied on upgrades,...
 |
|
 |  |
 |
|
-

 Crowdfunding5 days ago
Japanese Crowdfunding Platform Ubugoe Faces Payment Crisis After Withholding Funds
-

 Impact Investing2 weeks ago
Ecobnb Turns Sustainable Tourism Into Measurable Impact
-
 Crypto2 days ago
Ethereum Between ETF Inflows, Price Risks and a Strong July
-
 Crowdfunding1 week ago
The Italian Crowdinvesting Market Faces Sharp Decline in 2026