Markets
Stock Markets Wobbled, Ending Mixed. Does History Repeat?
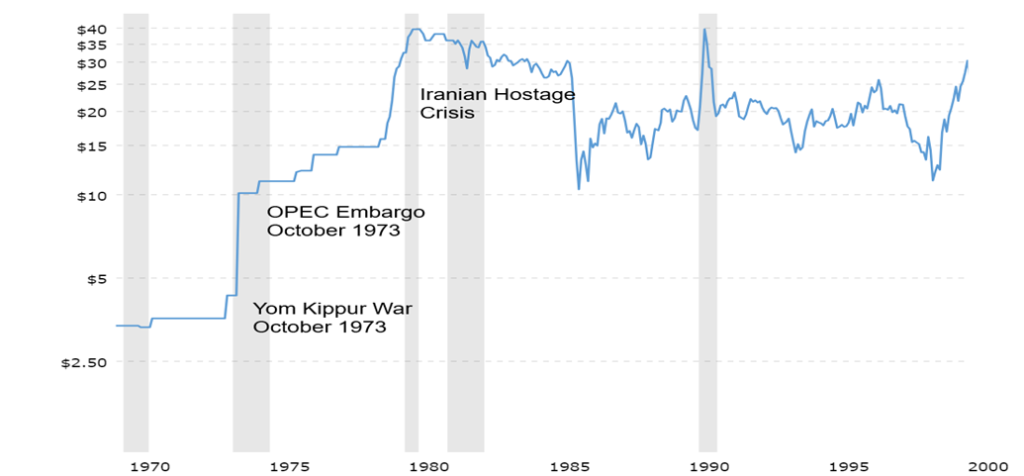
Our chart of the week looks at oil over the past 70 years. Periods of spiking oil prices, triggered by war, are often followed by spiking collapses. Oil is crucial to the global economy even as its share of the economy is not what it was during the 1970’s. Gold’s rally was safe haven buying but U.S. treasuries also rallied (prices rose, yields fell) as they too are a safe haven.

Mark Twain once said that “history never repeats itself, but it does often rhyme.” We are reminded that the Hamas attack on Israel came 50 years almost to the day after the surprise attack by Egypt and Syria against Israel in what became known as the Yom Kippur War (October 6–25, 1973). Today, like then, there was a massive failure of Israeli intelligence to warn them of the attack, even though warnings came from Egypt and apparently the U.S. that something was going to happen. Then Israel moved its Gaza border troops to the West Bank to quell uprisings there. The result was there was little help for the Israeli villages along the Gaza border and the people who lived there.
Since the Israeli War of Independence in 1947–1949, there have been at least sixteen significant clashes between Israel and Arab/Palestinians. Since the Six-Day War of 1967, Israel has occupied Arab/Palestinian lands, including the West Bank and the Golan Heights. The Sinai was later returned to Egypt while Israel withdrew from its occupation of Gaza. A blockade was put in place in 2007 following the Hamas takeover of the Gaza Strip. The tension and disputes have remained and, since then, numerous conflicts have continued.
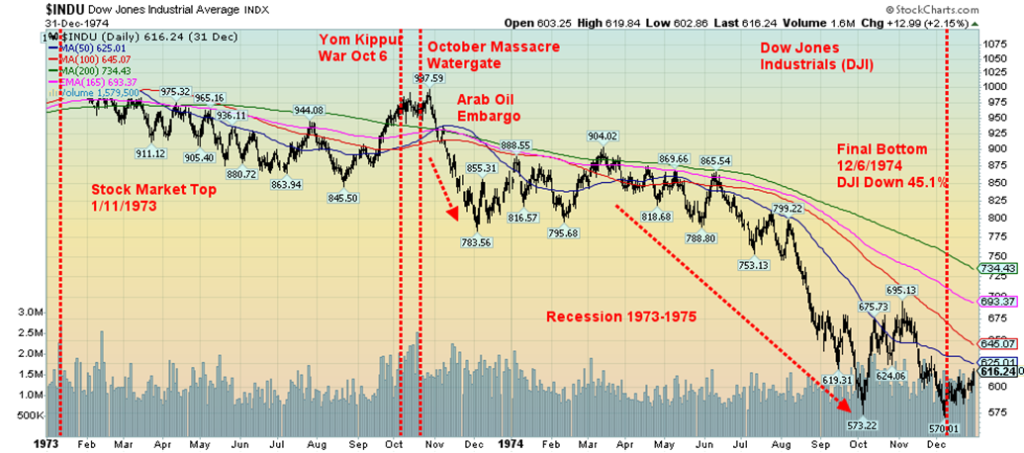
Fifty years ago, the Yom Kippur War sparked a major global crisis. We looked at the numerous clashes between Israel and Arab/Palestinians over the past 76 years, and the Yom Kippur War appears to be the only one that sparked a stock market collapse and global recession. What happened? The U.S. at the time decided to supply Israel. In response, OPEC, dominated by Saudi Arabia, embargoed oil shipments to the U.S. in protest. As a result, oil shot up from roughly $2.90/barrel to over $11/barrel, an over three-fold increase in a matter of months. Anyone who was around then remembers the long lineups at the pumps. It sparked a stock market collapse that saw the Dow Jones Industrials (DJI) fall some 45% from an original top in January 1973.
The stock markets actually topped on October 29, 1973, and by December 1973 the DJI had fallen over 21%. The embargo sparked oil prices to rise everywhere. As a result, inflation shot up and shortly after the world was plunged into a global recession 1974-1975. Inflation was soon replaced by what was a new term—stagflation. Others have observed this phenomenon, notably in an article from John Rapley in The Globe and Mail, Report on Business, October 11, 2023 (“Fifty years ago, war in Israel upended the world economy. Now it barely registers”).
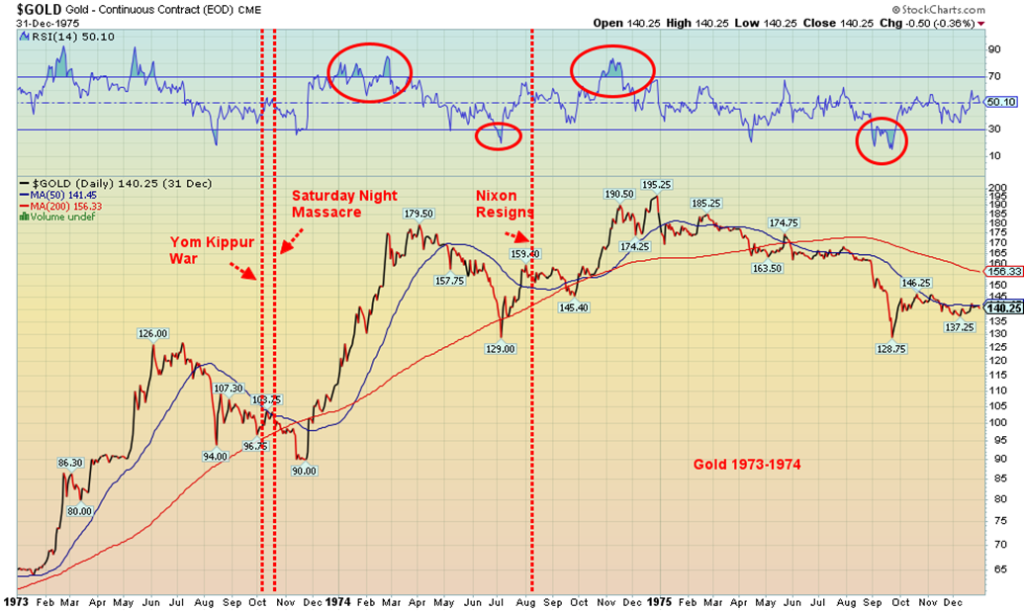
The Arab/Israeli War and the oil embargo were but two events that occurred then that helped spark the recession (1973–1975). Bretton Woods had ended by then, which was also disruptive to the global economy. The collapse of Bretton Woods started when former president Richard Nixon took the world off the gold standard in August 1971. But it was really finished when currencies were allowed to float against the U.S. dollar in 1973. That ushered in a period of soaring gold prices and a falling U.S. dollar which was grossly overvalued at the time.
The debts of the Vietnam War that the U.S. had accumulated were also a factor. Another factor was the ongoing Watergate crisis that culminated on October 20, 1973 in what was known as the Saturday Night Massacre. When the dust had cleared, President Nixon’s Attorney General Elliot Richardson resigned. The replacement, Assistant Attorney General William Ruckelshaus, also resigned because of their refusal to fire the special Watergate prosecutor Archibald Cox. The Solicitor General of the Justice Department Robert Bork carried out the dirty work. Ten days later, the impeachment process against Richard Nixon was underway.
October 1973 was a turning-point month. Does history repeat itself? Or just rhyme?
WTI Oil 1969–2000
Oil wasn’t the only thing that shot higher. Gold, after initially falling found its footing and over the next several months into December 1974 more than doubled from $90 in November 1973 to a peak of $195 in December 1974.
The month hasn’t played itself out as of yet. The war could spread. Already, there are reports of clashes with Hezbollah with rockets fired from Lebanon, continued unrest in the West Bank, and, apparently, rockets fired from Syria. We’ve also learned Israel bombed the Damascus airport. Could other players be drawn in, such as the U.S. or Iran? Back in 1973, oil was a much bigger part of the global economy than it is today.
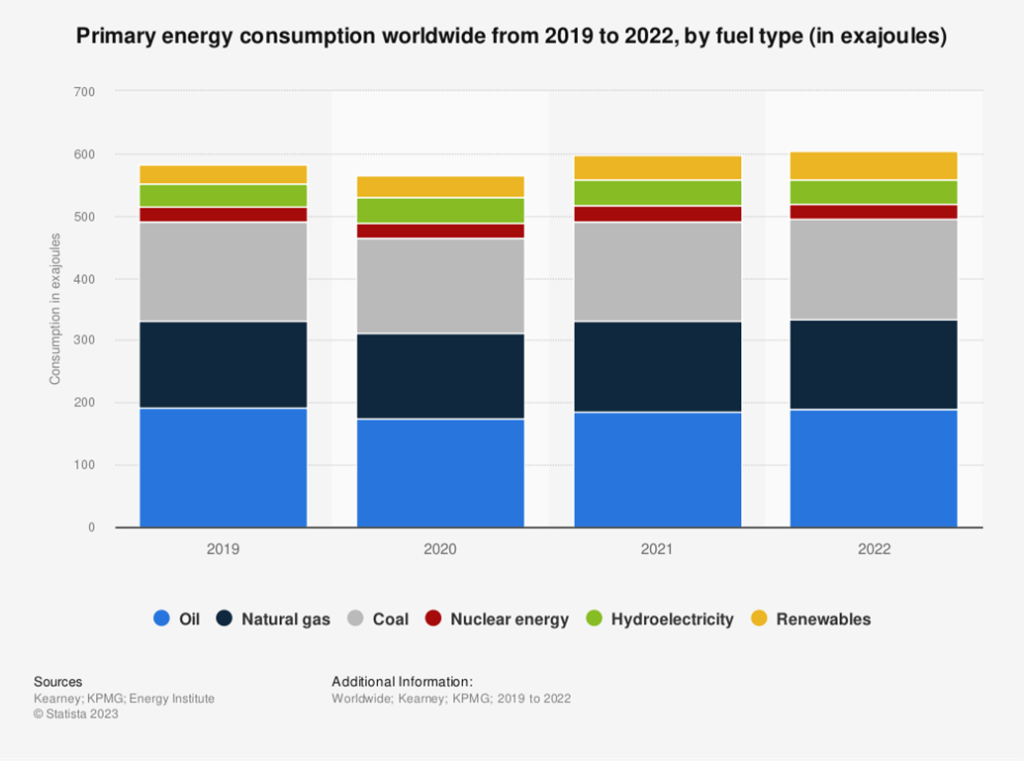
Today, at $84/barrel, it is the equivalent of about $12.15 in 1973 dollars or slightly higher than oil prices were after the Saudi oil embargo. But given oil’s smaller share of the global economy, it does not have the same impact. In 1973, oil represented roughly 44% of global energy needs. Today it is roughly 31%. Two of the more famous failures during that time period were the near-bankruptcy of New York City and the collapse of Franklin National in October 1974. At the time Franklin was the U.S.’s 20th largest bank. The Lehman Brothers moment at the time.
Dow Jones Industrials 1973–1974
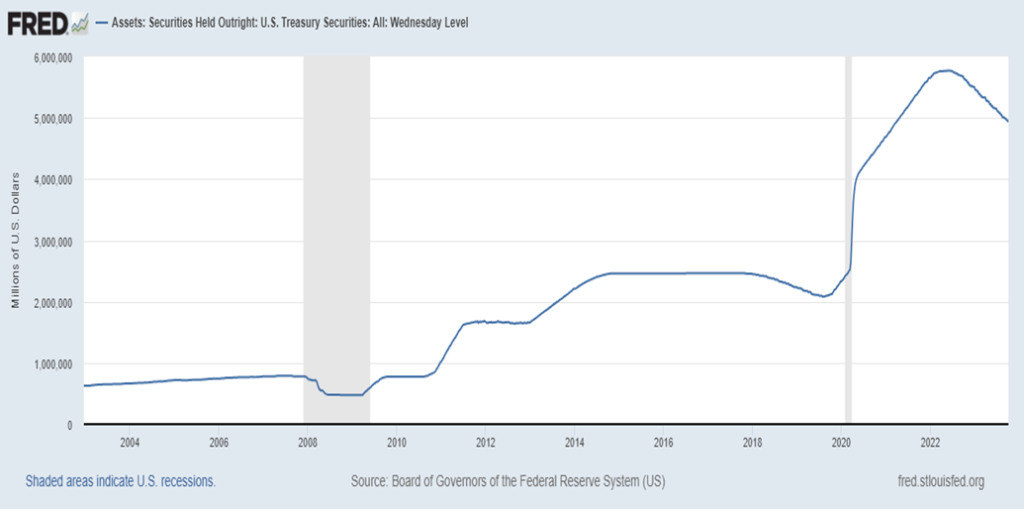
So, will there be a Lehman Brothers moment today? Could the outbreak of war in the Middle East be our black swan event? It becomes more serious only if it spreads. While the outbreak of war could be a turning event, there may be more black swans to come. Debt is a time bomb waiting to happen. Yes, we’ve talked about it before, but the situation only becomes more concerning. U.S. federal debt just crossed over $33.5 trillion. U.S. total debt (governments, corporations, households) is now over $103 trillion. The U.S. alone represents roughly one-third of global debt. Two of the biggest buyers of U.S. federal debt have been pulling back their purchases of U.S. treasuries: the Federal Reserve and China. We should add Japan as well, as their sinking yen is prompting them to sell U.S. treasuries to buy yen in order to shore it up.
The Fed has seen its holdings of U.S. treasuries fall some $840 billion over the past year. In May 2022, they reported they held $5.8 trillion. Today, it sits at $4.9 trillion. China is down some $117 billion over the past year. Japan is also down $117 billion. None of them are buying U.S. treasuries these days. The Fed is conducting quantitative tightening (QT). However, the Fed is not really selling securities; they are just letting them roll off and not buying new ones.
China has a falling yuan and growing problems in its real estate sector, with Evergrande going under as is Country Garden. Fears about Evergrande even sparked a bank run. They are the two biggest real estate players in China and both have a significant global reach. The real estate market in the U.S. and Canada is also precarious at best. Numerous banks are reported to have problems. Rumours persist that Bank of America (BOA) has major problems. Their bond portfolio alone has lost some $118 billion over the past year. All this is conspiring to help push bond yields higher.
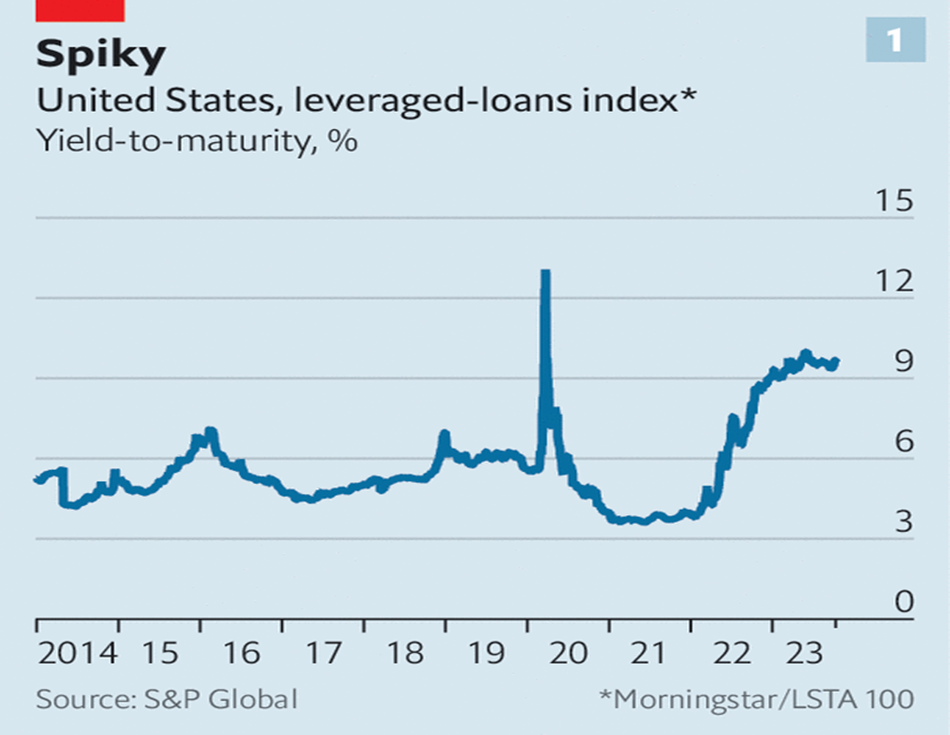
As The Economist has correctly noted, there are trillions of dollars of debt in the U.S. priced on a floating rate basis. That means their interest rate changes every one to three months, rarely longer. With interest rates poised to stay higher for longer, this could spell significant trouble for both financial and non-financial corporations, many of which are over-leveraged. (The Economist – Corporate America faces a trillion-dollar debt reckoning – https://www.economist.com/finance-and-economics/2023/10/12/corporate-america-faces-a-trillion-dollar-debt-reckoning). The Economist asks “How bad will things get? And who exactly will lose out?”
The Hamas/Israel war is threatening to spread. A debt time bomb is waiting to happen. Yes, oil may not be as crucial to the global economy today as it was in 1973. Petroleum as a share of energy peaked in the 1970s. But it is still significant. A sharp rise in prices could still be upending. However, debt is the real worry. It remains the potential source of our next black swan.
Fed Reserve Board Holdings of U.S. Treasuries 2002–2023
China Holdings of U.S. Treasuries 2022–2023
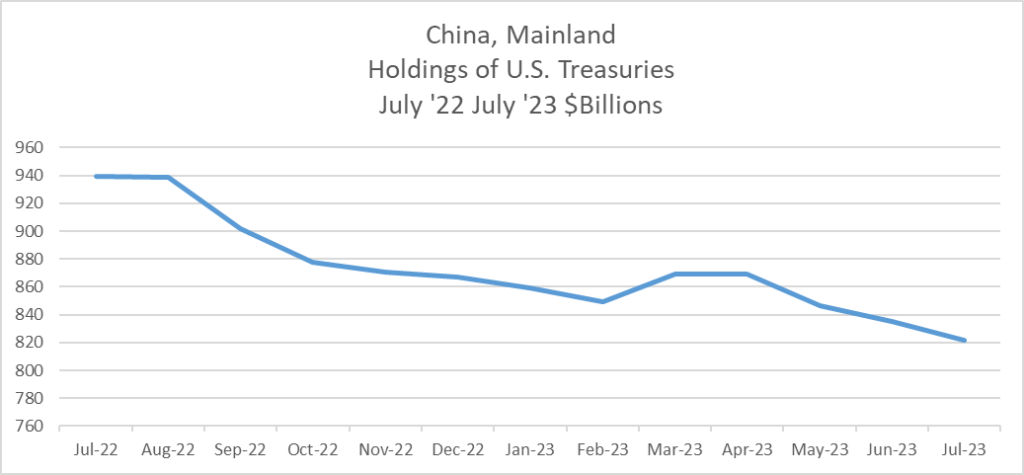
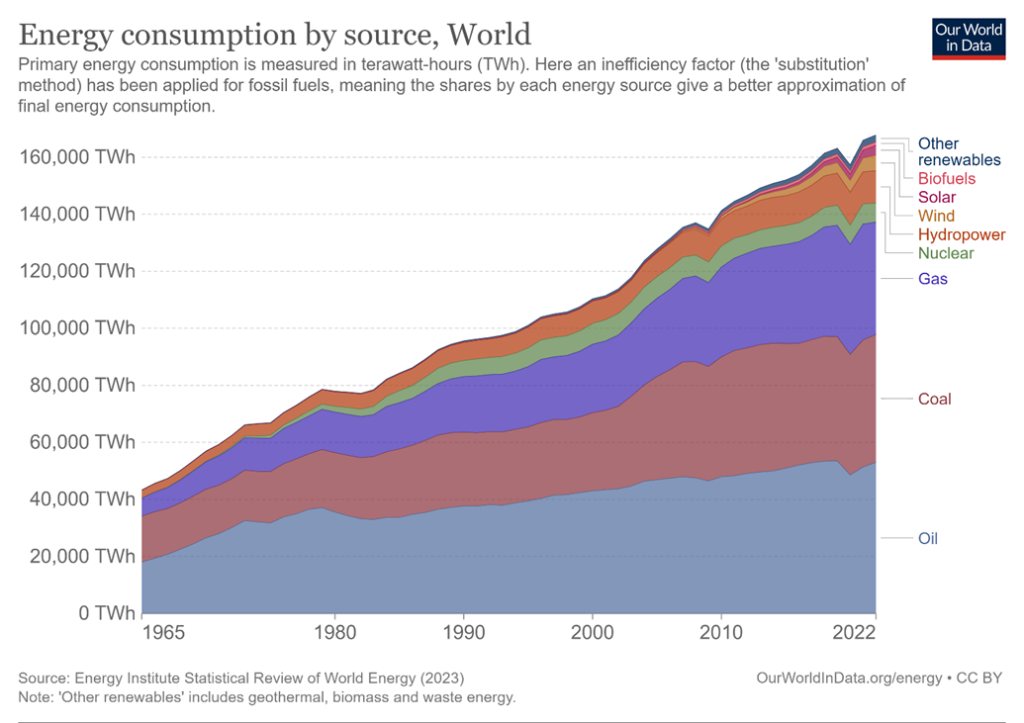
Chart of the Week
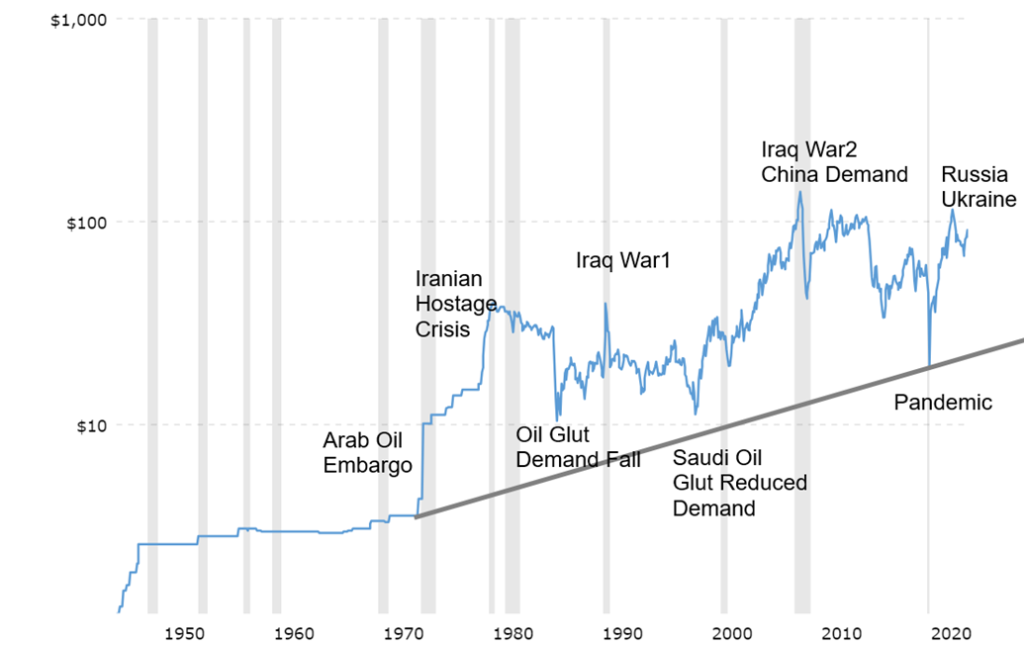
Oil, the lifeblood of the world. But, undoubtedly, the most political commodity. We have already noted that oil plays a lesser role in the world economy than it did back in the 1970s. Back then, oil made up some 44%/45% of the world’s energy needs. Today, that percentage has dropped to around 31%. Coal remains the next largest source of energy, followed by natural gas (NG). Nuclear, hydro, and renewables are smaller but renewables are growing, together making up about 18% of needs. While an oil embargo, blockade, or war would have a negative impact on the global economy, it wouldn’t be quite the same as what happened in the 1970s with the Arab Oil Embargo of 1973–1974 and the Iranian hostage crisis of 1979–1980. Other significant events that helped spike the price of oil were Iraq Wars 1 and 2 along with the surge in Asian demand led by China in the 2000s and finally the Ukraine/Russian war.
But that is not to dismiss the potential impact. Oil still plays a huge role in the global economy and a sharp price rise would have a negative impact. As it was, the outbreak of hostilities between Israel and Hamas spiked oil higher by $4 immediately on October 7, the day of the outbreak of hostilities. Oil subsequently pulled back, but the risk of higher prices remains. On Friday, October 13 oil spiked $5. Scary?
The danger is that the Israel/Hamas war spreads and, as a result, upends global energy security. An ongoing war with Hamas alone upends Israel’s plans to develop huge gas resources lying off the coast in the Mediterranean. Some of those sources lie adjacent to Gaza, with both Israel and Gaza claiming them. Besides oil prices jumping, NG prices also jumped, particularly at the Dutch Hub in the EU. Israel was forced to shut down the Tamar offshore field which produces half of Israel’s needs as well as needs for Egypt and Jordan. The fear was Hamas rockets could reach the platforms. This might be temporary, but if the war becomes prolonged then maybe not.
However, the biggest worry is Iran as it has been for years. Iran is adjacent to the Straits of Hormuz where it is estimated that some 20% to 30% of the world’s oil supply passes through. Iran is also a major oil and gas producer as well as holding some of the largest reserves of oil and gas in the world. Iran ranks fifth in oil production and holds the world’s fifth-largest reserves of oil. Iran is the world’s third-largest producer of natural gas and holds the world’s second-largest reserves behind Russia. Despite sanctions, Iran still exports a lot of its oil and gas with a major destination being China. Tightening the screws on Iran through sanctions has the unintended effect of hiking oil prices. The world’s largest consumer of oil and gas: is the USA.
Currently, observers including the U.S. are saying there is no evidence of any direct Iranian involvement in the war. However, that may not stop an attack on Iran.
Oil is a political commodity. It is difficult to predict where the Israel/Hamas war will go. Already we are seeing some potential to involve Hezbollah in Lebanon to the north of Israel. Rockets have been fired from Syria and, according to reports from Syrian media and reported by Al Jazeera, Israel has struck the Damascus and Aleppo airports, rendering them at least temporarily inoperable. Could another, more dangerous front open that eventually drags in the U.S. and Iran?
There are numerous conflicts in the world that involve U.S./Russia/China to some extent. These conflicts are:
Russia/Ukraine, Israel/Hamas, Azerbaijan/Armenia, Kosovo/Serbia, China/Taiwan, Iran, Yemen/Saudi Arabia, Ethiopia/Tigray/Eritrea, Democratic Republic of Congo, the Sahel – Burkina Faso, Niger, Mali, Haiti, Syria/Turkey, Turkey/Kurds, Pakistan, India – separatist movements, Kashmir, Myanmar. One could also include Mexican cartels, and, Colombian rebels. Separately, they don’t appear to be much, but taken together one often finds the great powers U.S./China/Russia involved in some form or other. Add in the EU, the U.K. and France alongside the U.S. and the potential for global conflict grows.
The Great Game continues. Seemingly separate, disparate conflicts also occurred before World War I and World War II. Energy was a weapon that led to the U.S.’s entry in World War II as they had cut off Japan’s supply lines of oil. And Germany invaded Russia as supplies of oil to Germany, crucial for the Nazi war machine, were being blocked from Russia. Oil is a political commodity. Without it, the Western economies could collapse.
Markets & Trends
| % Gains (Losses) Trends | ||||||||
| Close Dec 31/22 | Close Oct 13, 2023 | Week | YTD | Daily (Short Term) | Weekly (Intermediate) | Monthly (Long Term) | ||
| Stock Market Indices | ||||||||
| S&P 500 | 3,839.50 | 4,327.78 | 0.5% | 12.7% | down (weak) | up (weak) | up | |
| Dow Jones Industrials | 33,147.25 | 33,670.29 | 0.8% | 1.6% | down | neutral | up | |
| Dow Jones Transport | 13,391.91 | 14,699.43 | (0.7)% | 9.8% | down | neutral | up | |
| NASDAQ | 10,466.48 | 13,407.23 | (0.2)% | 28.2% | down (weak) | up (weak) | up | |
| S&P/TSX Composite | 19,384.92 | 19,462.68 | 1.1% | 0.4% | down | down | up | |
| S&P/TSX Venture (CDNX) | 570.27 | 529.13 | (0.8)% | (7.2)% | down | down | down | |
| S&P 600 (small) | 1,157.53 | 1,112.76 | (1.0)% | (3.9)% | down | down | neutral | |
| MSCI World | 1,977.74 | 2,055.67 | 2.9% | 3.9% | down (weak) | down | neutral | |
| Bitcoin | 16,531.31 | 26,910.18 | (3.9)% | 62.8% | neutral | neutral | neutral | |
| Gold Mining Stock Indices | ||||||||
| Gold Bugs Index (HUI) | 229.75 | 223.56 | 8.6% | (2.7)% | neutral | down | down | |
| TSX Gold Index (TGD) | 277.68 | 274.41 | 8.0% | (1.2)% | up | down | down | |
| % | ||||||||
| U.S. 10-Year Treasury Bond yield | 3.88% | 4.61% | (5.1)% | 18.8% | ||||
| Cdn. 10-Year Bond CGB yield | 3.29% | 3.97% | (6.6)% | 20.7% | ||||
| Recession Watch Spreads | ||||||||
| U.S. 2-year 10-year Treasury spread | (0.55)% | (0.45)% | (73.1)% | 18.2% | ||||
| Cdn 2-year 10-year CGB spread | (0.76)% | (0.89)% | (36.9)% | (17.1)% | ||||
| Currencies | ||||||||
| US$ Index | 103.27 | 106.68 | 0.5% | 3.3% | up | up | up | |
| Canadian $ | 73.92 | 73.30 | flat | (0.8)% | down | down | down | |
| Euro | 107.04 | 105.07 | (0.7)% | (1.8)% | down | down | down | |
| Swiss Franc | 108.15 | 110.84 | 0.9% | 2.5% | down (weak) | down | up | |
| British Pound | 120.96 | 121.38 | (0.8)% | 0.4% | down | down | neutral | |
| Japanese Yen | 76.27 | 66.87 | (0.2)% | (12.3)% | down | down | down | |
| Precious Metals | ||||||||
| Gold | 1,826.20 | 1,941.50 | 5.2% | 6.3% | neutral | down (weak) | up | |
| Silver | 24.04 | 22.90 | 5.4% | (4.7)% | down (weak) | down | neutral | |
| Platinum | 1,082.90 | 884.20 | 0.3% | (18.4)% | down | down | down | |
| Base Metals | ||||||||
| Palladium | 1,798.00 | 1,145.20 | (1.5)% | (36.3)% | down | down | down | |
| Copper | 3.81 | 3.57 | (1.6)% | (6.3)% | down | down | neutral | |
| Energy | ||||||||
| WTI Oil | 80.26 | 87.69 | 5.9% | 9.3% | neutral | up | up | |
| Nat Gas | 4.48 | 3.24 | (3.1)% | (27.7)% | up | up | down (weak) | |
New highs/lows refer to new 52-week highs/lows and, in some cases, all-time highs.
Stock markets wobbled and turned down this past week as the Hamas/Israel war spread, with a planned ground invasion and potential openings of new fronts on the northern border with Lebanon, and as clashes broke out in the West Bank. Also at risk is Syria as Israel bombed the Damascus airport, disabling it at least temporarily. There is also fear of the war widening to encompass Iran, which in turn would bring in the U.S.
On the week, the S&P 500 rose 0.5%, the Dow Jones Industrials (DJI) was up 0.8%, while the transportation-driven Dow Jones Transportations (DJT) fell 0.7% as oil prices soared. The tech-driven NASDAQ fell 0.2%, but the S&P 400 (Mid) fell 0.5% and the S&P 600 (Small) dropped 1.0%. The S&P 500 Equal Weight was up 0.2% while the NY FANG Index dropped 0.6%. Bitcoin fell 3.9% and back under $27,000.
In Canada, the TSX Composite rose 1.1%, thanks to Materials and Energy, while the junior TSX Venture Exchange (CDNX) continued its misery, down 0.8%. In the EU, the London FTSE was up 1.5% but the Paris CAC 40 fell 0.8% and the German DAX was off 0.3%. The EuroNext was up 0.3%, leaving the EU zone (and UK) rather mixed. In Asia, China’s Shanghai Index (SSEC) was down 0.7%, the Tokyo Nikkei Dow (TKN) was up 4.3% while Hong Kong’s Hang Seng (HSI) was up 1.9%. Could the latter two be viewed as safe havens?
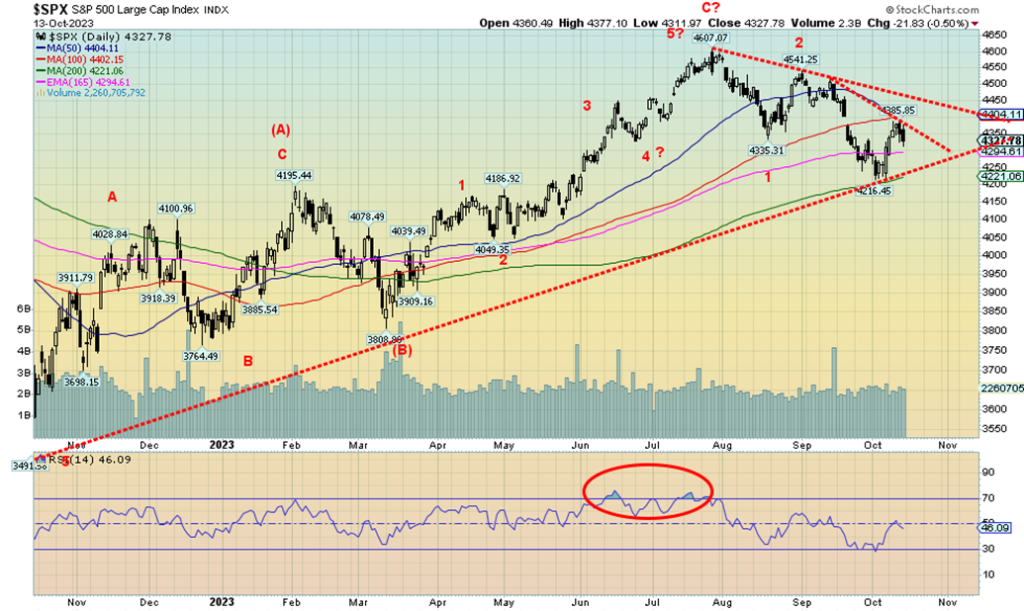
One thing that strikes us is that the SPX failed at the gap. That is usually a negative sign. If we had filled the gap and broken out above 4,475, we’d feel confident that we were headed higher. Not so much anymore. As the war intensifies and other players come in, the odds favor a more prolonged, complicated conflict that could draw in even more players. If the ground invasion grinds and a massive humanitarian crisis takes hold in Gaza, that could also intensify things. The death toll in Gaza is already rising, with upwards of one-quarter of the casualties being children. A number of foreign nationals are trapped there, as are an unknown number of hostages. Things could also become heated on the street as protests by both sides intensify in North America and the EU. As well, some EU countries such as Germany and France have large Muslim populations. The Arab Street could also intensify things against their own governments. But would the Great Powers get involved, such as the U.S., Russia, and China? Evidence suggests they already are, particularly the U.S., in supporting Israel. All in all, it remains a potentially destabilizing event in a part of the world that is already unstable and holds some of the world’s largest oil and gas reserves. We have called this a black swan event that could destabilize the entire world.
Next week will be key. If we can recover and jump over 4,475, we’d have no doubt we are headed higher. But a breakdown under 4,200 would seal a potential downward collapse.
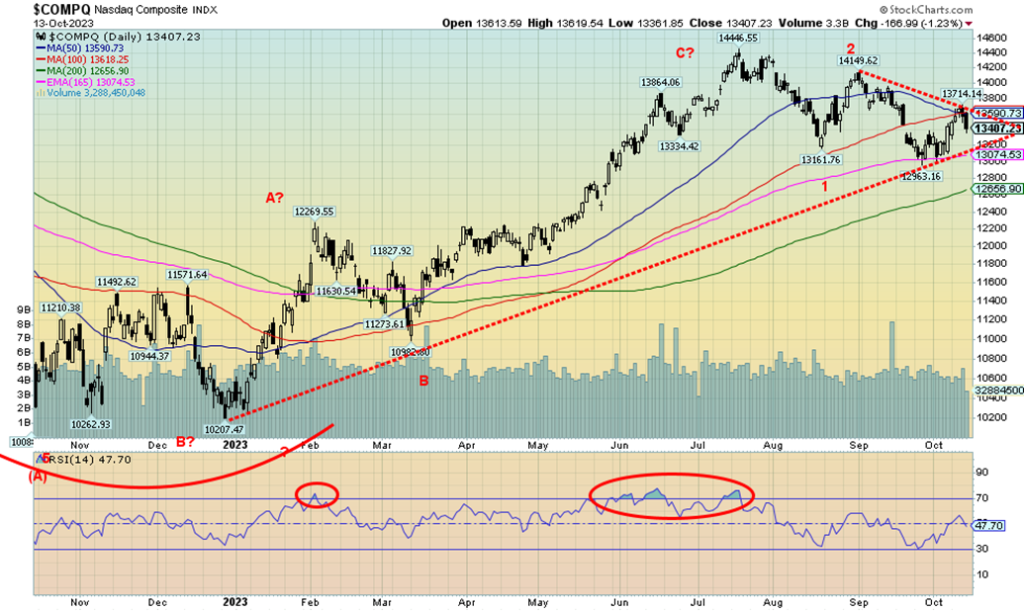
The NASDAQ fell 0.2% this past week as the war in the Middle East weighed on stock investors. The speculative NY FANG Index fell 0.6%. A big loser was Netflix, down 6.8%. China’s Baidu fell 7.1% while Tesla was off 3.6%. Amazon at +1.4% and Apple at +0.8% helped keep the index afloat. The NASDAQ failed at the 50-day MA as the 50-day was falling under the 100-day by the week’s end, a negative development. We filled that gap, but it doesn’t appear to be holding. A break now under 13,050 could start a sharper decline. New highs above 13,800 would keep the rally going, but Friday’s drop and fears that the Israeli ground invasion could run into trouble, along with new fronts opening up on the Norther Lebanon border and in the West Bank, keeps stocks on edge. The 200-day MA is down at 12,650 and a solid break under that level would set up the next bear drop.
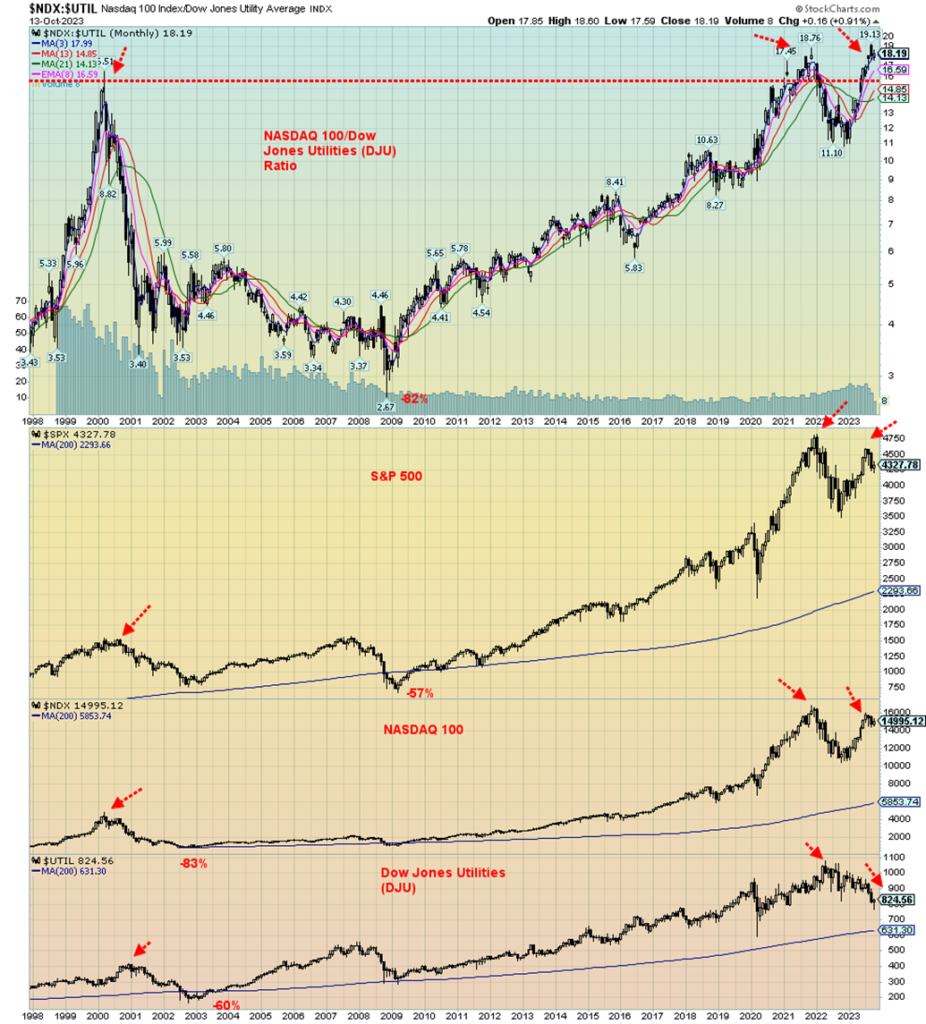
The chart on the previous page, drawn by ourselves but courtesy of Elliott Wave International (www.elliottwave.com), shows a comparison between the NASDAQ 100/Dow Jones Utilities (DJU) ratio and the S&P 500, the NASDAQ 100, and the DJU. The NASDAQ 100/DJU ratio is considered to be a speculative (NDX) vs. conservative (DJU) sentiment indicator. The NDX is stuffed full of speculative stocks in high tech vs. the DJU holding conservative, dividend-paying stocks. What the index is saying is that sentiment remains very speculative. The NDX/DJU ratio has set all-time highs, taking out the high seen back in 2000 when the dot.com bubble topped not once but twice. And, on the second go-around to all-time highs, the NDX/DJU ratio soared to higher highs. Meanwhile, the SPX, the NDX, and DJU were trending lower with either lower highs or, in the case of the DJU, just going lower. What it is telling us is that speculation remains rife, which in turn spells trouble for the NDX going forward.
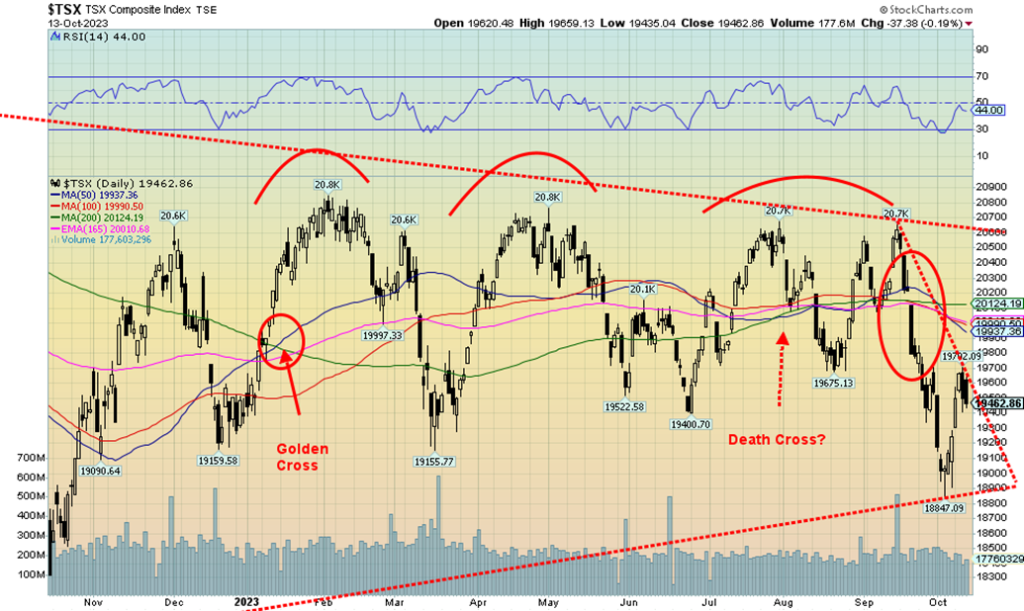
Thanks to the materials sector, which includes golds and metals, the TSX Composite enjoyed an up week, gaining 1.1%. The junior TSX Venture Exchange (CDNX) wasn’t so lucky as it lost 0.8%. Misery continues on the CDNX and we read stories of miners that dominate the exchange having problems raising cash. That’s not surprising when the index is down 52% from the 2021 highs and down 84% from its all-time high set back in 2007. An excellent article on the subject can be found in the October 14, 2023, Globe and Mail: “Canada wants to be a global leader in critical minerals. Why is Australia eating our lunch” www.theglobeandmail.com/business/article-canada-critical–mining-australia/
Of the 14 sub-indices, seven were up and seven were down. The leaders to the downside were Health Care (THC) down 3.2% and Information Technology (TTK), off 2.5%. Generally, the ones hit were the income-producing sub-indices such as Income Trusts -1.9%, Real Estate (TRE) -0.7%, and Utilities (TUT) -0.8%. Also hit was Consumer Discretionary (TCD) -0.4%. Financials (TFS) gained 0.3%. The big winners were Energy (TEN) +6.4% and Golds (TGD) +8.0%. Materials (TMT) +3.5% and Metals & Mining (TGM) +2.1%.
Nonetheless, the TSX fell on Friday 0.2% but it was a day that opened better and then closed down. The chart now looks negative and the gap down that occurred on September 21 appears distant. A breakdown now under 19,300 suggests we could soon fall to the recent low near 18,850. The entire pattern is now suggesting lower.
The only saviour would be if we could fill that gap and move above 20,300. That appears remote at this time.
The sectors to own are Gold, Metals & Mining, Materials, and Energy.
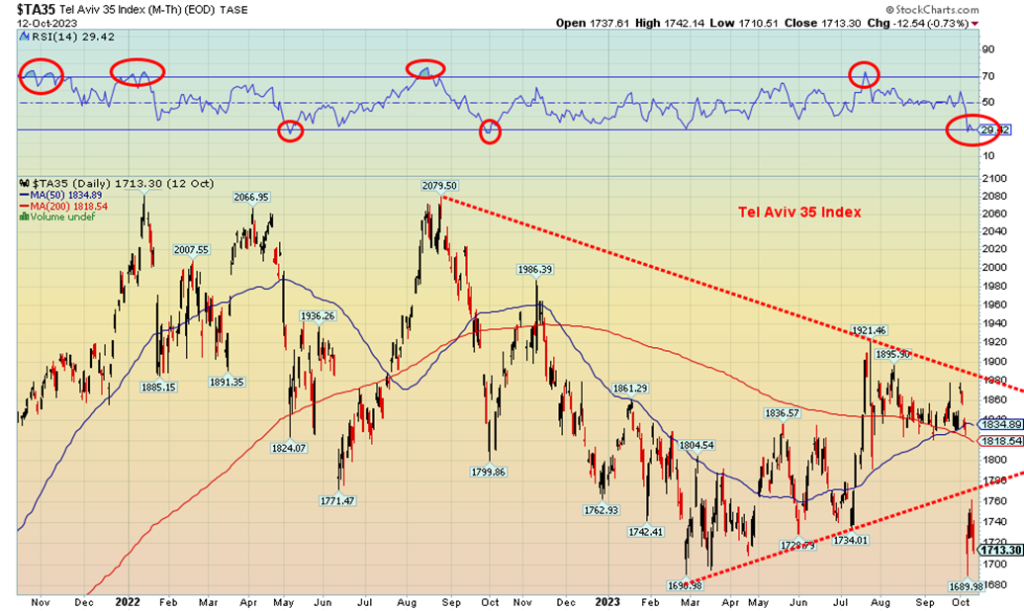
It is probably no surprise that the Tel Aviv Index was hit following the outbreak of hostilities between Hamas and Israel. The prime blue-chip Tel Aviv 35 Index just gapped down, as did the broader Tel Aviv 125 Index. Israel has a highly developed high-tech sector which is now being disrupted because of the war. With thousands called up as reservists, it is estimated that over 300,000 have been pulled out of the economy to participate in the war. How much economic damage that does depends on how long they are out. Israel was already seeing some slowing of growth. The thriving tourist industry will undoubtedly collapse as well. Furthermore, the humanitarian crisis will also have a negative impact. There will also be a negative impact on the global economy, depending on how long this continues. If the war opens on other fronts, the potential for economic damage would grow.
The Tel Aviv 35 just gapped down when war broke out. Following a very short respite, selling resumed into Friday. The triangle that formed before the drop suggests targets could potentially be down to 1350–1400, a 22% drop from current levels. So far, the index is down 42% from the high seen in August 2022. With the potential target, that would imply a 55% drop from the August 2022 high. Currently, it is somewhat oversold, but oversold levels can remain with us for some time. Israel’s credit rating remains so far at A+.
U.S. 10-year Treasury Bond/Canadian 10-year Government Bond (CGB)
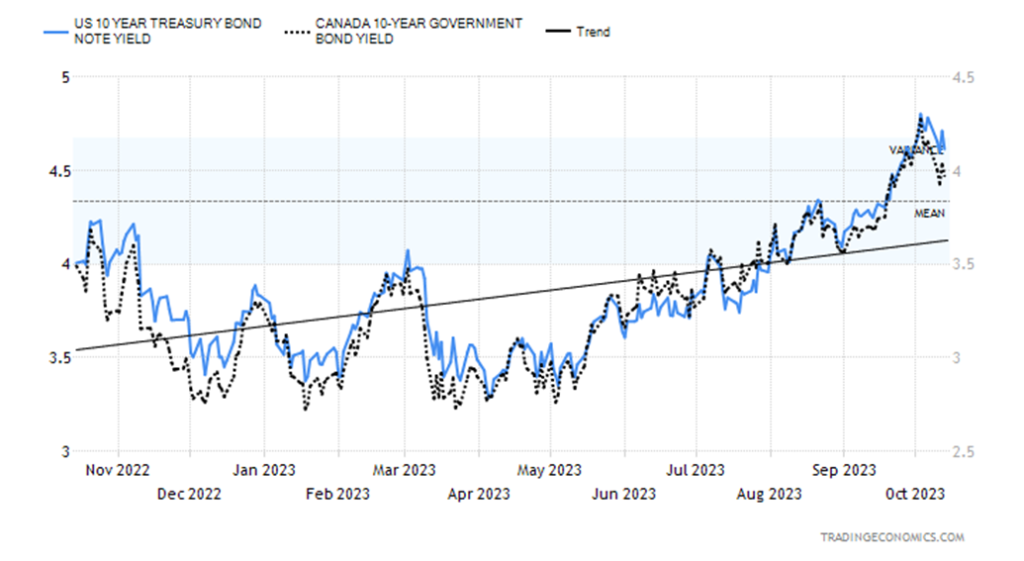
U.S. Treasury yields fell this past week (prices rose, as prices move inversely to yield) as a result of safe haven buying due to the outbreak of war in the Middle East. The 10-year U.S. treasury note fell to 4.61% from 4.86% the previous week. The Canadian Government 10-year bond (CGB) also dropped to 3.97% from 4.25%. Helping push yields lower was the lower-than-expected University of Michigan Sentiment Index (see next chart). As one pundit commented, the goal was to obtain a safe asset in the event the Israeli ground invasion bogs down and additional fronts open up, as they appear to be doing. As one stated, “everything that’s going on in the Middle East is getting more and more unfortunately depressing and seems to have the potential to get worse.” Along with U.S. treasuries, other safe havens were found in gold.
Despite U.S. treasuries rallying, recent auctions including this past week, have not gone well. Investor demand has tailed off and dealer buying has gone up. So, will the rally this past week be short lived? The rally thus far is inconclusive that we have made a top (yield) or bottom (price). New highs would end that discussion.
The closely watched recession spreads widened out. The U.S. 2–10 spread rose to 45 bp from 26 bp while the Canadian 2–10 spread was up to 89 bp from 65 bp. The 3M–10 spread in the U.S. backed up to 99 bp from 85 bp, while the Canadian 3M–10 spread was at 119 bp vs. 89 bp. So, is the recession off? Hardly, as we suspect that this is merely a pullback correction. The short rates of 3 months and 2 years will fall only if the perception becomes that the Fed and the BofC will cut rates in response to clear signs of a recession, or a major bankruptcy that threatens the financial system.
Of other major numbers this past week, the U.S. CPI for September came in up 0.4% vs. 0.6% in August but above expectations of up 0.3%. The year-over-year (y-o-y) CPI was up 3.7%, unchanged from August but again above consensus of 3.6%. Weekly initial claims were unchanged at 209,000, slightly under the consensus of 210,000. However, continuing claims leaped to 1,702,000 up from 1,672,000 and above consensus of 1,680,000. That showed some weakening. Canada reports its inflation numbers on Tuesday, October 17. In the U.S., watch retail sales also on Tuesday, expected to be up only 1.5% y-o-y vs. up 2.5% the previous month. Housing starts are on Wednesday, expecting 1,400,000 vs. 1,283,000 in August.
Bonds look stronger if they fall under 4.50% and Canada under 3.50%. We believe, at minimum, a rebound rally has developed for bonds but are not sure how long it will last.
Michigan Consumer Sentiment Index 1950–2023
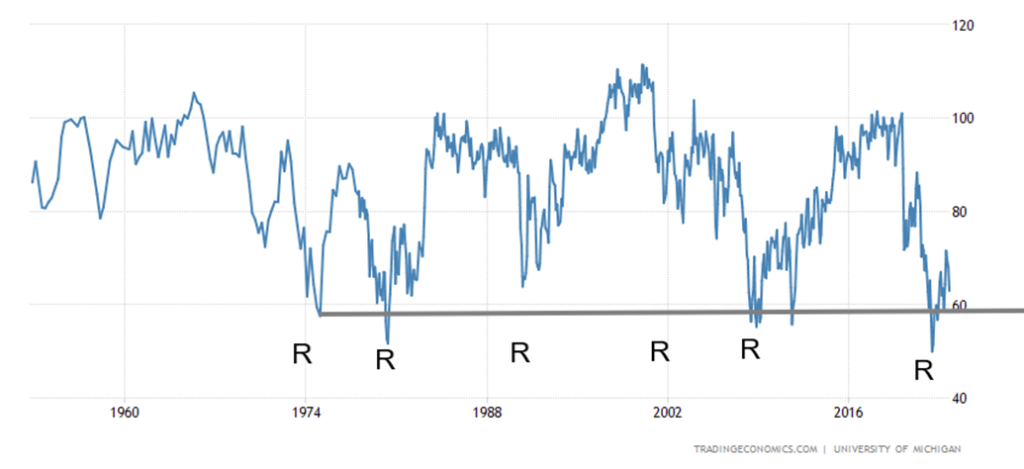
R – Denotes Recession
The latest University of Michigan Consumer Sentiment Index fell to its lowest level in five months, with a reading of 63 vs. 68.1 in September. It also missed estimates of 67.2. These are preliminary estimates. Other indicators such as future expectations and current conditions also fell below expectations. The index continues to hover around the lowest levels seen since the 2007–2009 recession and the 1980–1982 recession. Yet the economy is not yet in a recession. All this is occurring despite near-record holdings of cash as a percentage of disposable income by consumers. That suggests that they are holding on to their funds. With wars raging, inflation still a problem, and a potential recession looming, consumers are not in a very good mood.
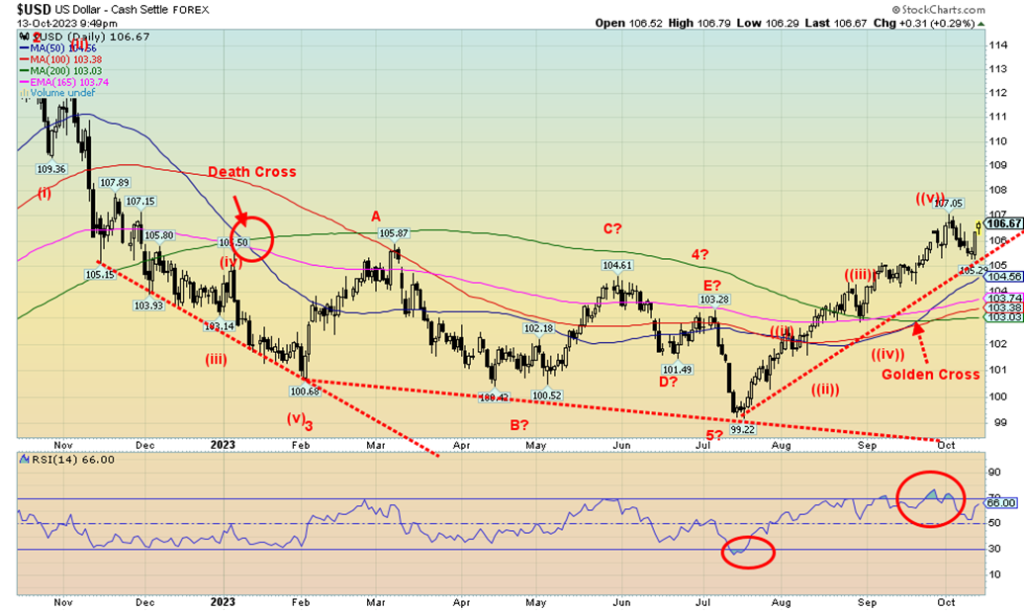
The US$ Index continues to rise with a gain of 0.5% this past week. With the gain, it was definitely a surprise that gold leaped over 5% or almost $100 on the week. The two usually are inverse to one another. However, the outbreak of hostilities in Israel sent gold and oil sky rocketing. And the US$ Index rose as well. Why? Some reasons are the comparatively stronger U.S. economy, higher interest rates in the U.S. than elsewhere, particularly the EU, UK, and Japan, and, the fears concerning trade, given the ongoing war between Russia/Ukraine and now the outbreak in Israel which threatens to spread. The disarray in Congress is largely a non-factor in the US$ Index. The euro fell 0.7% but the Swiss franc, which can also act as a safe haven currency, rose 0.9%. The pound sterling fell 0.8% while the Japanese yen dropped about 0.2%. The Canadian dollar was flat. The US$ Index found support near 105 but remains shy of recent highs at 107.05. The odds appear to favour new highs. Breakdown is at 105, but the index is not in serious trouble until it drops under 103. Indicators remain positive and the recent pullback eased some of the overbought conditions. People still view the U.S. dollar as one of the safest currencies in an increasingly unstable world.
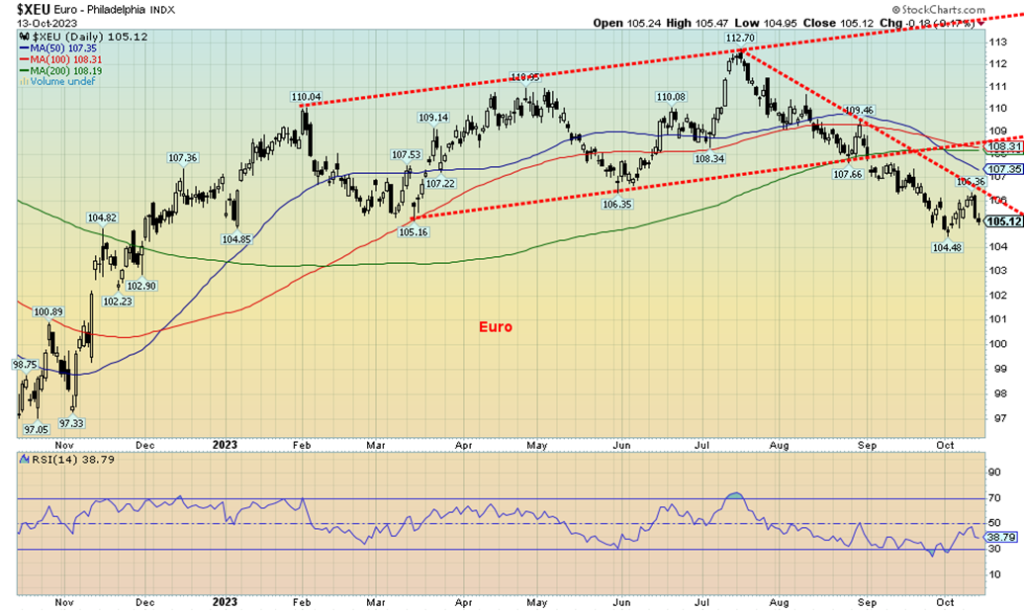
The euro is sinking and we don’t see any formation of a bottom. The eurozone is also sinking, led by Germany which is already in recession. Overall growth in the eurozone was last at 0.5%, barely staying above water. The U.K. is in the same boat. The Russia/Ukraine war is taking its toll. Now with the outbreak of hostilities in Israel, the large Muslim populations in Europe and the U.K. are restless and supportive of the Palestinians. That particularly impacts France and Germany. Germany, the eurozone’s largest economy, is already in a recession, albeit a mild one so far. Funds have been flowing out of the zone into the U.S. because of interest rate differentials and the ongoing Russia/Ukraine war. Targets on the euro are potentially down to 100 or par with the U.S. dollar.
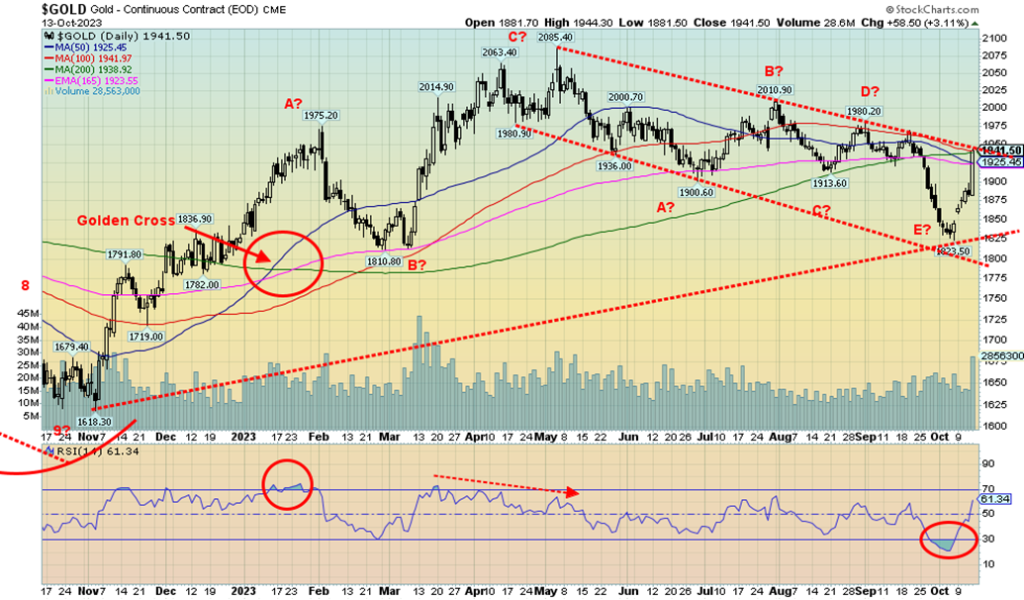
There is nothing like conflict in the Middle East and total disarray in the U.S. government to get gold prices to spite the rising US$ Index and leap upwards themselves. It was a stellar week for gold, silver, and gold stocks. Safe-haven gold that has no liability leaped $96 this past week or 5.2%. That included the amazing $58.50 jump in gold prices on Friday the 13th. For gold, it was the best move since March 2023. We also can’t remember too many $60 days. Silver jumped 5.4%, but platinum was up only 0.3%. Palladium didn’t fare well, falling 1.5%, and copper lost 1.6%. We like to see copper rise with gold. The Gold Bugs Index (HUI) was up 8.6% while the TSX Gold Index (TGD) gained 8%. That gold stocks are leading is a positive sign.
Besides the clashes in the Middle East, a weaker-than-expected Michigan Sentiment Index also helped. It has been a pretty straight-up move from the low of $1,823. We are now up over 6% from that low. But we have a long way to go. Resistance is seen at the downtrend line and at $1,950. Once above $1,950, we focus on the next resistance zone of $1,980/$2,000. Breaking above that level will be more important. Above $2,025, new highs above $2,085/$2,089 become possible. Above $2,100 would be good start to confirm that our 7.83-year cycle and 23.5-year cycle lows are in. While it was early, the November 2022 low of $1,618 stands as the trough of our cycle thus far.
The commercial COT for gold showed improvement this past week, rising to 37%, the best level we’ve seen in some time. Longs jumped over 10,400 contracts while shorts fell over 7,000 contracts. The previous week it was around 30%.
The rise for gold was all the more impressive considering the rise in the US$ Index this past week. What’s key now for gold is that the $1,823 low remains in place. Above $1,950 would confirm the low and above $1,980/$2,000 would solidify thoughts we are headed for new all-time highs. As well as rising in the face of a rising US$ Index, gold rose as U.S. treasury yields fell. For the week, it was a pretty bullish move topped by the big up day on Friday the 13th.
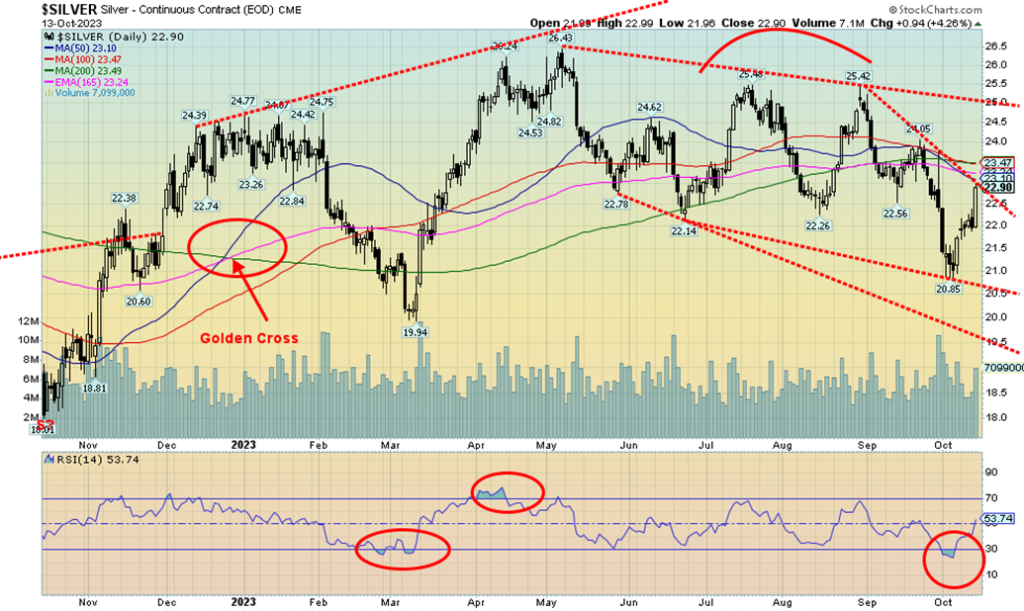
Silver enjoyed a stellar week, leading gold as it was up 5.45% vs. gold up 5.2%. It was a solid week for the junior metal. However, all we did was run into resistance of the downtrend line from the August high of $25.42. We did manage to close nicely over $22, but more resistance lies above. First, it will be important to take out the downtrend line this week; second, we need to break out over $24; and, third. we need to break out over $26. Once new highs are seen above the May high of $26.43, we can look up at the February 2021 high of $30.35. We’ve always been bothered by gold making new highs. but silver not confirming, coming nowhere near its high seen in 1980 and again in 2011. Although the real high was 1980 as on an inflation-adjusted basis. the 2011 high was lower.
While it is important that silver takes out the points noted to the upside, silver must remain above the spike low of $20.85. A break of that level would signal we are headed much lower. Targets that we had down to around $18.25 were not fulfilled. That’s a good sign. But breaking above $23.50 and staying above that level would confirm the low. We are not quite there, yet.
The commercial COT for silver by our calculation is at 38%. The silver COT improved from roughly 36% the previous week. New longs were added while shorts fell.
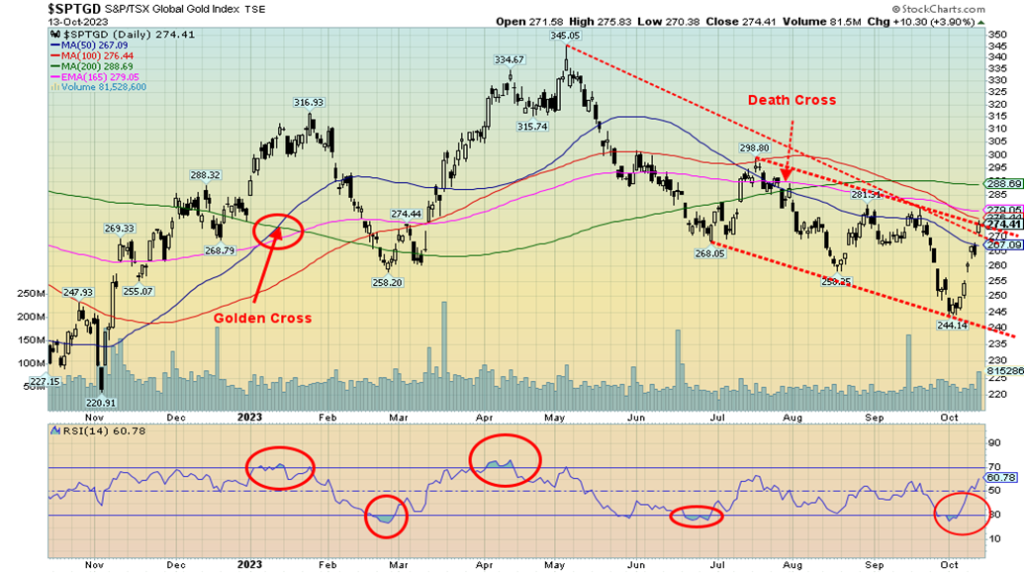
Thanks to the Middle East turmoil and gold leaping almost $100 on the week, the gold stocks enjoyed a banner week. But before everyone gets too excited, we note that we remain well down from the early May highs. The TSX Gold Index (TGD) rose 8.0% this past week while the Gold Bugs Index (HUI) was up 8.6%. It is interesting to note that the TGD above gapped higher almost every day of the week this past week. After hitting a low of 244 earlier in the month, the TGD is now up 12%. It is also down 20.5% from its May high and down 40% from its all-time high seen in 2011. While gold has performed well this century, gold stocks remain unloved and under-owned. It is even worse for the junior gold miners who trade mostly on the TSX Venture Exchange (CDNX).
The good news is that the TGD is nowhere near overbought, yet. But it has run into a downtrend line and resistance of 100-day MA. The 200-day MA remains above at 288. It is essential we take out that level and move above 300 to tell us that we have made our bottom. Above 320, new highs are probable. It is difficult to fathom that the TGD will move as well this coming week as it did this week, but given the turmoil, owning gold becomes a must-have as a safe haven and a hedge against the turmoil. That translates into the gold stocks being bought, but a reminder that gold stocks are merely a leveraged way of owning gold. However, the risks are much higher owning gold stocks than in owning gold itself. Gold has no liability. Gold stocks do. The gold/HUI ratio did improve in favor of the HUI, but the ratio was down only 3%, which was roughly the difference between the rise in gold prices this past week vs. the rise in the HUI 5.9% vs. 8.6%.
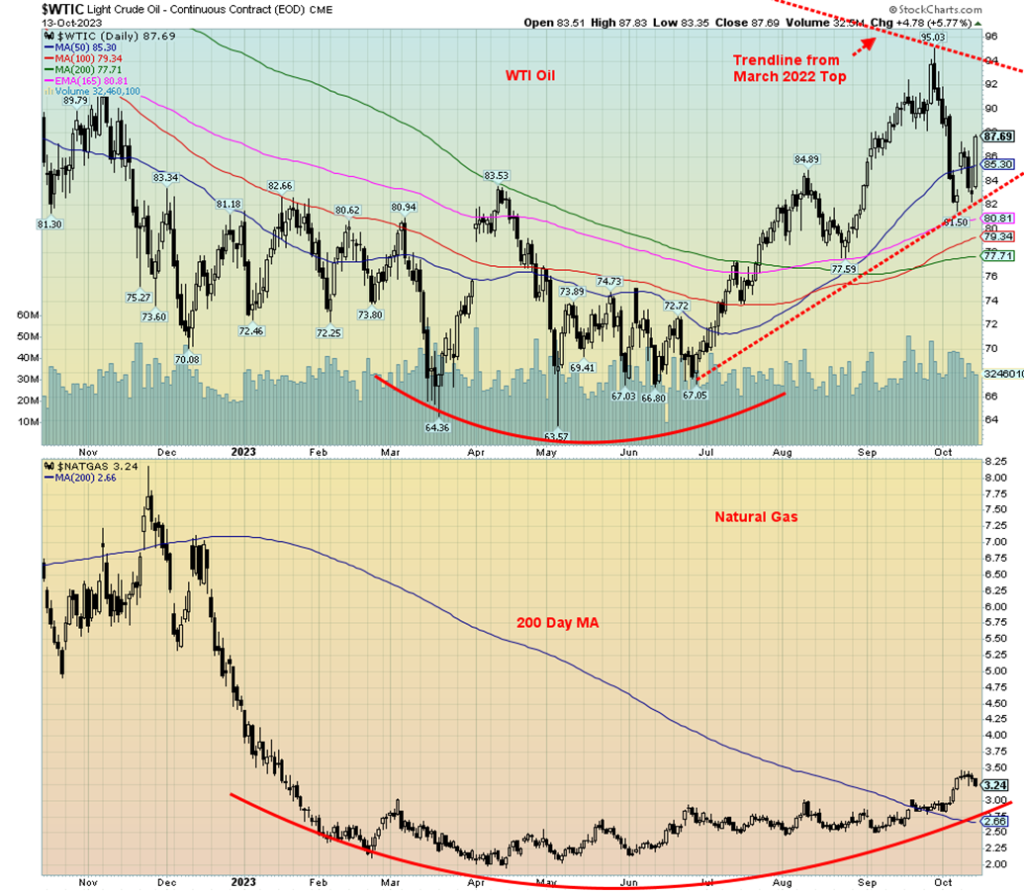
Just as everyone thought we were safe from rising oil prices after that swift decline from $95 to $81.50, in a matter of days we were jolted back to reality with the outbreak of hostilities in the Middle East. As that wasn’t enough, the U.S. announced a step-up in sanctions against two of the world’s largest oil producers, Russia and
Iran. As geopolitical risks rise, so do oil prices. The focus, of course, is on Iran. If, somehow, they were to enter the outbreak between Hamas/Israel, oil prices would, as some have predicted, soar toward $150. The question is, what are the odds that Iran could get involved in the war? At this point it’s slim, but that could change as the war spreads to more fronts—on the north with Lebanon and Hezbollah, on the west with the West Bank, and further west in Syria where Israel has just bombed the Damascus airport, making the airport disabled, at least for the moment. Some believe that Iran’s entry into this war is almost inevitable. And if that does happen, the world becomes an extremely dangerous place and, given a sharp rise in oil prices, that could crash the global economy.
With Iran bordering the crucial Straits of Hormuz where upwards of 30% of the world’s oil passes, everyone knows that Iran might try to block the straits, irrespective of the U.S.’s 7th fleet stationed in Bahrain. It would also bring the U.S. into the war, which in turn could bring in both China and Russia. China gets oil from both Iran and Saudi Arabia as well as Russia. China is the world’s second-largest consumer of oil behind the U.S.
WTI oil jumped 5.9% this past week, the bulk of it on Friday when oil leaped 5.8% or $4.78. Brent crude jumped to $91 up 8.0% on the week. Natural gas (NG) prices also jumped this past week. While Henry Hub NG actually fell 3.1%, NG at the EU Dutch Hub leaped 41.2%. NG fell in the Americas because of warmer weather, slowing demand, and reduced exports to Mexico. Not so in the EU as supplies were spooked by the thoughts of the geopolitical risks, ongoing strikes at LNG plants in Australia, a shutdown by Israel of a major gas field, and a leak in a Baltic’s pipeline. Forecasts of cooler temperatures didn’t help.
The energy stocks enjoyed the turmoil as the ARCA Oil & Gas Index (XOI) leaped 6.0% and the TSX Energy Index (TEN) jumped 6.4%. Given we have taken out the high of a week ago, the odds now favor a further rise in WTI towards the earlier high of $95. War in the region where over 31% of the world’s oil supply is produced will have that effect. The U.S. added to its strategic reserves this past week, but, overall, they remain well below peak levels.
__
(Featured image by Markus Spiske via Unsplash)
DISCLAIMER: This article was written by a third party contributor and does not reflect the opinion of Born2Invest, its management, staff or its associates. Please review our disclaimer for more information.
This article may include forward-looking statements. These forward-looking statements generally are identified by the words “believe,” “project,” “estimate,” “become,” “plan,” “will,” and similar expressions. These forward-looking statements involve known and unknown risks as well as uncertainties, including those discussed in the following cautionary statements and elsewhere in this article and on this site. Although the Company may believe that its expectations are based on reasonable assumptions, the actual results that the Company may achieve may differ materially from any forward-looking statements, which reflect the opinions of the management of the Company only as of the date hereof. Additionally, please make sure to read these important disclosures.
Copyright David Chapman 2023
David Chapman is not a registered advisory service and is not an exempt market dealer (EMD) nor a licensed financial advisor. He does not and cannot give individualised market advice. David Chapman has worked in the financial industry for over 40 years including large financial corporations, banks, and investment dealers. The information in this newsletter is intended only for informational and educational purposes. It should not be construed as an offer, a solicitation of an offer or sale of any security. Every effort is made to provide accurate and complete information. However, we cannot guarantee that there will be no errors. We make no claims, promises or guarantees about the accuracy, completeness, or adequacy of the contents of this commentary and expressly disclaim liability for errors and omissions in the contents of this commentary. David Chapman will always use his best efforts to ensure the accuracy and timeliness of all information. The reader assumes all risk when trading in securities and David Chapman advises consulting a licensed professional financial advisor or portfolio manager such as Enriched Investing Incorporated before proceeding with any trade or idea presented in this newsletter. David Chapman may own shares in companies mentioned in this newsletter. Before making an investment, prospective investors should review each security’s offering documents which summarize the objectives, fees, expenses and associated risks. David Chapman shares his ideas and opinions for informational and educational purposes only and expects the reader to perform due diligence before considering a position in any security. That includes consulting with your own licensed professional financial advisor such as Enriched Investing Incorporated. Performance is not guaranteed, values change frequently, and past performance may not be repeated.


Tilray Brands Hits Multi-Year Lows as Cannabis Investors Await Regulatory Clarity
Tilray Brands shares have fallen 57% this year amid cannabis sector weakness and uncertainty over US regulatory reform. While potential...


Ethereum Between ETF Inflows, Price Risks and a Strong July
Ethereum faces mixed signals as ETF inflows and a strong July performance support recovery, while technical resistance and downside risks...


Mercedes-Benz Accelerates EV Decarbonization With Recycled Aluminum
Mercedes-Benz expands its partnership with Hydro to accelerate supply chain decarbonization. Future electric vehicles will use Hydro CIRCAL aluminum containing...

Evotec and BioGaia Boost Biotech, while Vitrolife Disappoints
European stocks moved on earnings and broker actions. Evotec, BioGaia, Plus500, Pharming, Inwido, Amundi and Julius Baer rallied on upgrades,...


BMW Hit by China Slowdown as Samsung Profits Soar and Adidas Gains World Cup Boost
BMW faces falling profits due to China’s auto market crisis, while cutting costs. Lufthansa competes for a stake in Portugal’s...
 |
|
 |  |
 |
|
-

 Crowdfunding4 days ago
Japanese Crowdfunding Platform Ubugoe Faces Payment Crisis After Withholding Funds
-

 Impact Investing2 weeks ago
Ecobnb Turns Sustainable Tourism Into Measurable Impact
-
 Crypto1 day ago
Ethereum Between ETF Inflows, Price Risks and a Strong July
-
 Crowdfunding1 week ago
The Italian Crowdinvesting Market Faces Sharp Decline in 2026