Business
Gold prices on hold as misleading data teases economic recovery: what this means for Rockridge Resources Ltd.
With the economy opening up for business again and unemployment seemingly dropping, optimism about an economic recovery is putting the recent gold bull run on hold. But a close look at the data doesn’t back up this narrative. Now, with gold prices moving sideways in anticipation of the next big breakout, Rockridge Resources is expanding their flagship gold project. Something big is in the making.

Some “slightly better than expected” data over the last month has hit the pause button on gold’s record-breaking bull run. The economy is open for business again and, apparently, unemployment is falling. But this is all temporary. Beneath the surface of the emerging data, the picture doesn’t look so pretty. That’s why we’re seeing Sean Hannity Goldco endorsements, and why wise firms like Rockridge Resources Ltd. (TSX.V: ROCK) are plowing full steam ahead, going long on gold.
This has earned them a spot on the latest edition of the Laurentian Bank Securities Equity Research Mining Watchlist. What’s got the bank’s analysts particularly excited is Rockridge’s latest diamond drill program at their flagship Raney Gold Project. With high-grade gold already identified at the site, the coming months will see a whole range of exciting results being released by Rockridge as they test the extent of it.
What this is doing is creating the perfect storm of buying opportunity, and investors should be paying close attention to this rising star. With gold’s next bull run fast approaching and Rockridge having just announced that they’re kicking off the follow up to their successful spring drilling program, now’s the time to be watching this hot junior minor.
Rockridge’s perfect timing and their Raney Gold Project
Rockridge has just announced the commencement of its next drilling program at the high-grade Raney Gold Project. This program is the extension of their spring exploration, undertaken out at this flagship prospective gold site.
All throughout the 2,000-meter spring program, Rockridge consistently hit high-grade intercepts, including a highlight of 28g/t gold over 6 meters at a shallow depth of 95 meters.
Located Southwest of Timmins in Ontario, Canada, the site is in a politically stable and mining-friendly jurisdiction. With paved road access and the infrastructure to support a full-blown mining operation already in place, the location of this site couldn’t be any more ideal.
With the current drilling program, Rockridge is now looking to test the strike and down-plunge extent of the high-grade structure already identified. This will be completed as an extension of the earlier program, drilling out to at least eleven holes and a minimum of 3000 meters.
The site has a lot more untapped potential for the future as well.
The broad structural corridor that hosts the intercepted mineralization is up to 125 metres wide and extends well beyond the area already tested by drilling. Rockridge have already identified a notable disruption in airborne magnetic data in line with the projected structural corridor, approximately 2 km west of the current drilling.
Rockridge also has an option to earn a 100% interest in the site, and they expect to have this completed by the end of the current drilling program. The future is looking very bright indeed.
The timing of this follow-up exploration also coincides perfectly with the current “good” news of economic recovery. With gold prices currently taking a short hiatus while the economy throws a few misleading signs of a recovery, investors have the perfect opportunity to get in early before things start heating up.
Data indicating an economic recovery is misleading
The reality is, any hesitation holding gold prices back at the moment is being driven by false hope in the economy. While recent numbers have been “slightly better than expected,” believing that they’re pointing to any sort of real improvement is foolish. All that’s changed is that we now think we’re falling into a 99-meter deep hole instead of a 100-meter one. In either case, we’re still in for a rough landing.
The recent unemployment data is prime amongst this misleading data, and a quick look at what’s happening behind the scenes reveals a grim picture.
The truth behind unemployment data and what it’s got to do with the price of gold
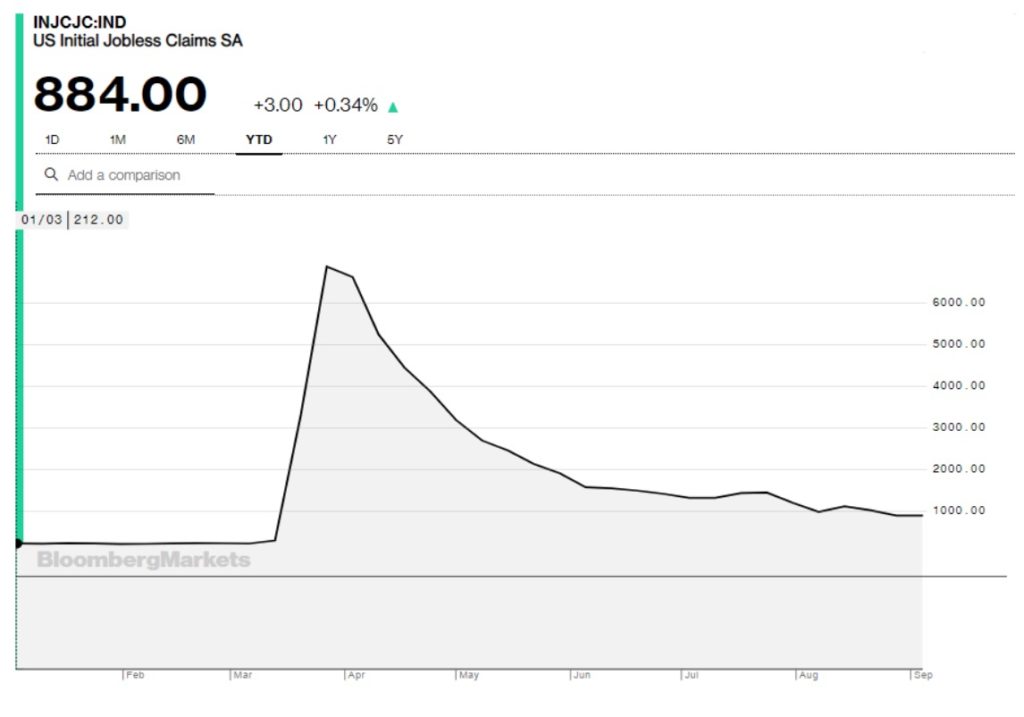
One widely cited figure in the economic recovery story is Initial Jobless Claims. This captures the number of new claims for unemployment insurance. Currently flattening out at 884k, this is beating earlier analyst expectations by approximately 60-70k.
Whoopee do.
The problem with this for recovery hopefuls is that back in March, right before COVID-19 struck, it was holding steady at 211k. That means this figure is now leveling out over 400% above pre-COVID levels. That’s not good.
Further, a deep dive into unemployment data reveals an even shakier foundation for any argument that economic recovery is taking place.
Economists warn 8.4% unemployment rate is a sham—likely to be over 11%
The widely reported 8.4% US unemployment rate is highly misleading. Many economists estimate that the real figure is over 11%, citing concerns over the US Bureau of Labor Statistics’ (LBS) data collection methods. But even with methodological questions put aside, it’s still hard to paint a bright picture of recovery with the data as-is.
Firstly, the pickup in employment is being driven by growth in part-time jobs. August data shows that, compared to this time last year, there has been an explosion in part-time workers. How big has this explosion been? 132% of an explosion! Yep, this year we’re sitting at 6.2 million part-time workers as a result of challenging business conditions. Last year, it was only 2.68 million.
What does this tell you about how much underemployment the LBS is counting in their employment figures?
But what makes it worse is that by the LBS’s own admission, they have not counted the “5.2 million persons not in the labor force in August [who] were prevented from looking for work due to the pandemic.” Why? Because, “To be counted as unemployed, by definition, individuals must either be actively looking for work or on temporary layoff.”
Their figures. Their words.
So, not only is the data for an apparent recovery in unemployment questionable but what’s driving it is increasing underemployment. It’s also being propped up by the BLS choosing not to count those who are being “prevented from looking for work due to the pandemic” as unemployed.
And let’s not forget. Even this “great” 8.4% unemployment figure is still too high. Not such a pretty picture now, is it?
But still, what’s this got to do with the price of gold?
According to research published in The International Journal of Business and Finance Research, there’s a tight correlation between unemployment and the price of gold. When unemployment is high, gold prices start going up.
At first, this seems bizarre. But there is a logical explanation which hints at just how high gold prices are going.
You can’t have one without the other: employment, inflation and the Fed
At its core, the correlation between employment and the price of gold lies in the Fed’s dual mandate. Simply put, the Fed’s core responsibilities are employment and inflation, and its tools of the trade are “printing money” and interest rates.
In a nutshell, if unemployment rates get too high, expansionary monetary policy is the Fed’s solution. They inject more money into the economy, and more jobs necessarily follow. Of course, the necessary side effect of this is that inflation goes up, too. More dollar bills chasing the same number of goods = higher prices for those goods.
Of course, this then has a knock-on effect influencing the price of gold. Don’t believe it?
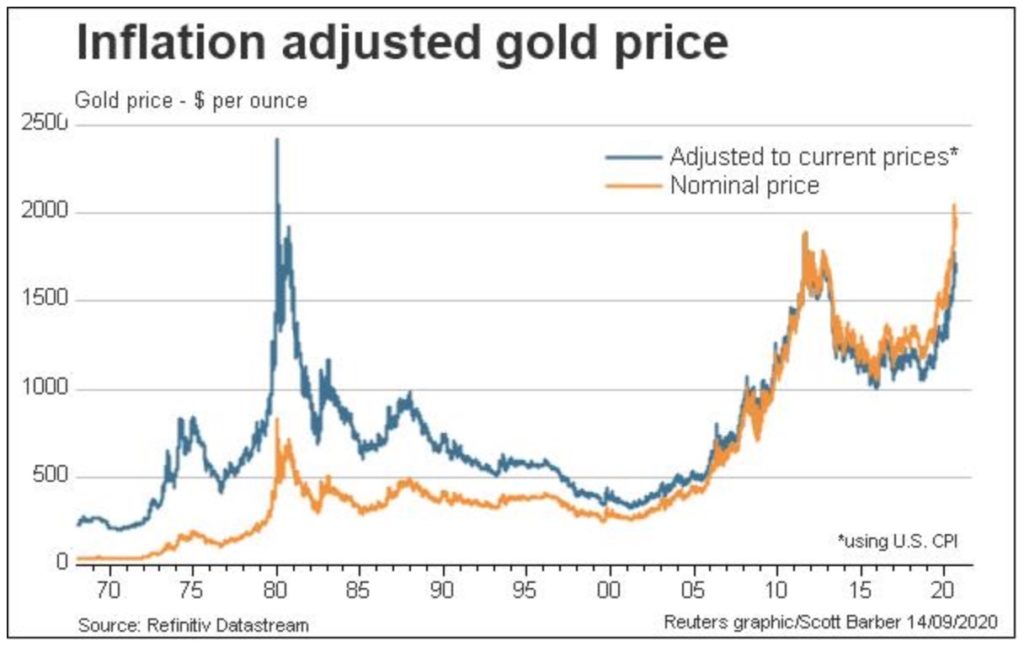
A lesson from the past: stagflation of the 1970s
The stagflation of the 1970s is the perfect example of what inflation does to gold prices. During the decade, an average 6.8% inflation rate pushed the price of gold up 2,260%, from $35/ounce in 1970, all the way up to $700/ounce by 1980. Adjusted for current U.S. CPI, this pushed gold prices even higher than today’s “record” prices, hitting an adjusted price of almost $2,500/ounce.
Oh, and the current 1.7% inflation rate is much higher than you think
Adding to the woes coming up for the U.S. economy is the story hiding behind the current 1.7% inflation rate. Currently, this is being cited as a good thing—the Fed has a 2% target, so apparently we’re looking okay.
However, the shock of COVID-19 has thrown the usual balance of things way out of whack. For the old measure of CPI to be useful, we can’t stifle a population’s ability to spend its money as it wishes. If we just shut down entire industries for months at a time, the figure gets skewed.
The proof of it lies in essential components of the CPI, like apparel and airfares, which are still in dramatic deflationary territory: -5.9% and -23.9% respectively. Yes, at first, this makes sense. Retail and travel are suffering at the moment.
But what doesn’t make sense is that inflation is looking healthy despite the fact the economy has been pumped full of stimulus bucks. Interest rates are at historical lows, the Fed has blown out its balance sheet by over $3 trillion, and the Treasury Department has pumped a similar figure into the economy as well.
So what’s happening?
What the Buffett Indicator can tell us
The recovery of the stock market has been spectacular, and this is a problem. A clear sign of the excess cash flying around right now is seen in the current state of the famous “Buffett Indicator.” For the uninitiated, the Buffett indicator measures the ratio between GDP and the combined market cap of the stock market. For many years, it’s been a reliable indicator of impending turmoil.
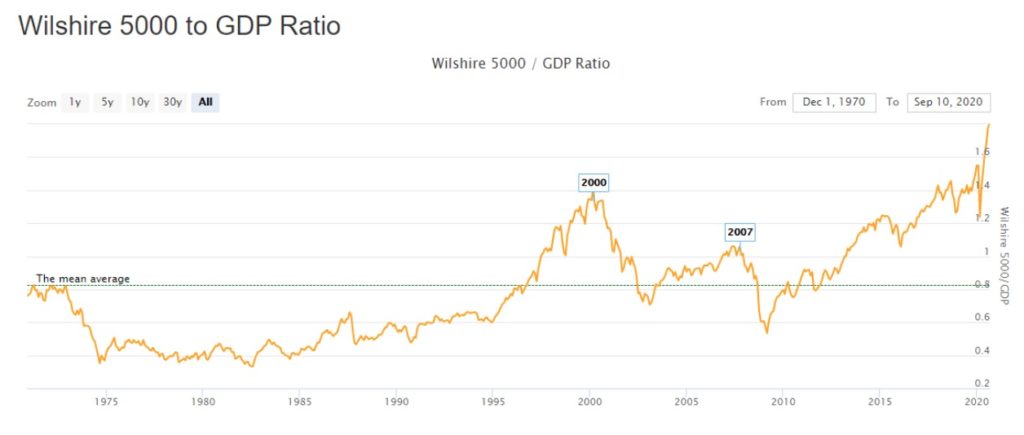
So why is it so high right now?
Well, while other things have suffered, COVID-19 has caused an explosion in retail investing. With fistfuls of stimulus bucks and nowhere else to spend them, American consumers have been throwing their dollars at the markets. Just look at the price of Tesla, Nikola, and other brand-name stocks to see where all the money has been going.
With something so valueless as a meaningless stock split now enough to whip star-struck Tesla investors into a feeding frenzy, this is starting to look a lot like inflation, just not as we previously measured it.
But how does this add up for Rockridge Resources?
Ok, so inflationary stock prices are bad, yes. But let’s not forget that there’s a reason that the S&P500 is mockingly called the S&P5. The bigger a stock’s market cap, the more significant its influence on an index is.
Essentially, stocks that hopeful investors have been frothing over—Apple, Microsoft, Alphabet, etc.—dominate and are the reason for the market’s over-inflated valuation.
What this means is that there’s still a some very overlooked bargains to be bought and, with investors yet to catch on to this company’s already stellar results, Rockridge is one.
Gold is going up, and Rockridge is going along for the ride
The fact is, gold prices are only going to take off again. Further expansionary monetary policy is inevitable, and this will only drive up inflation and, inevitably, interest in gold.
How much could it go up? Well, let’s just say that Bill Dudley, a senior research scholar at Princeton University’s Center for Economic Policy Studies, is estimating the Fed’s balance sheet is going to balloon to $10 trillion by the end of this year. That’s far beyond any level previously thought to be reasonable.
And all of this is going to provide the perfect backdrop for Rockridge’s continued interception of high-grade gold mineralization at the Raney Gold Project.
—
(Featured image by flaart via Pixabay)
DISCLAIMER: This article was written by a third party contributor and does not reflect the opinion of Born2Invest, its management, staff or its associates. Please review our disclaimer for more information.
This article may include forward-looking statements. These forward-looking statements generally are identified by the words “believe,” “project,” “estimate,” “become,” “plan,” “will,” and similar expressions. These forward-looking statements involve known and unknown risks as well as uncertainties, including those discussed in the following cautionary statements and elsewhere in this article and on this site. Although the Company may believe that its expectations are based on reasonable assumptions, the actual results that the Company may achieve may differ materially from any forward-looking statements, which reflect the opinions of the management of the Company only as of the date hereof. Additionally, please make sure to read these important disclosures.


The German Biotech Industry Faces Funding Crunch Despite Market Stability
German biotech held steady in 2025 but faces ongoing financing pressures, according to EY-Parthenon and BIO Deutschland. Total capital fell...


Argentina Legalizes Cannabis Seed Sales Under New Regulatory Framework
Cannabis seeds purchase becomes legal in Argentina under INASE Resolution 260/2022, allowing open acquisition but keeping cultivation illegal without Reprocann...


Côte d’Ivoire Cocoa Price Crisis: Record Decision Turns into Market Breakdown
Three weeks before the 2025 election, Côte d’Ivoire set a record cocoa price of 2,800 FCFA/kg, based on its pricing...


Transition to a Sustainable Economy as a Strategic Global Shift in a Fragmented World
The sustainable transition is entering a decisive phase where climate, nature, resources, and social systems are converging into a single...

Bitcoin and Ethereum Stabilize as Markets Watch ETF Flows and Institutional Moves
Bitcoin and Ethereum are stabilizing early in the week, with BTC near $63,000 and ETH around $1,650, though ETF outflows...
 |
|
 |  |
 |
|
-
 Cannabis1 week ago
Tilray Expands in Europe as Medical Cannabis Market Grows
-

 Biotech2 weeks ago
AstraZeneca to Showcase Extensive Oncology and Rare Disease Data at ASCO 2026
-

 Impact Investing6 days ago
World Environment Day: Warming Risks and Clean Energy Breakthroughs
-

 Crypto1 week ago
Ethereum Under Pressure as Bitcoin Stalls and Crypto Tensions Rise