Featured
Are we witnessing the beginnings of a bear market?
The last all time new high for the Dow Jones was twelve days ago. However, last week the BEV value was -14.02%. The problem is the new coronavirus outbreak which has everyone running scared, especially the “market experts” seen in the financial media. But this market was long overdue for a significant correction. At best it will be a few months before we see any new BEV Zeros.

At last week’s close, with the Dow Jones’ BEV value at -1.89%, I said I’d remain long-term bullish as long as the Dow Jones stayed above its BEV -7.5% line, or even if it remained in single-digits BEV values. As it turned out I could only remain long-term bullish until Wednesday of this week with the Dow Jones closing at a BEV of -8.78%. Thursday the Dow Jones closed with a BEV of -12.81%, and Mr Bear’s slaughter of the innocents on Wall Street continued on Friday, closing the week with the Dow Jones seeing a BEV of -14.02%.
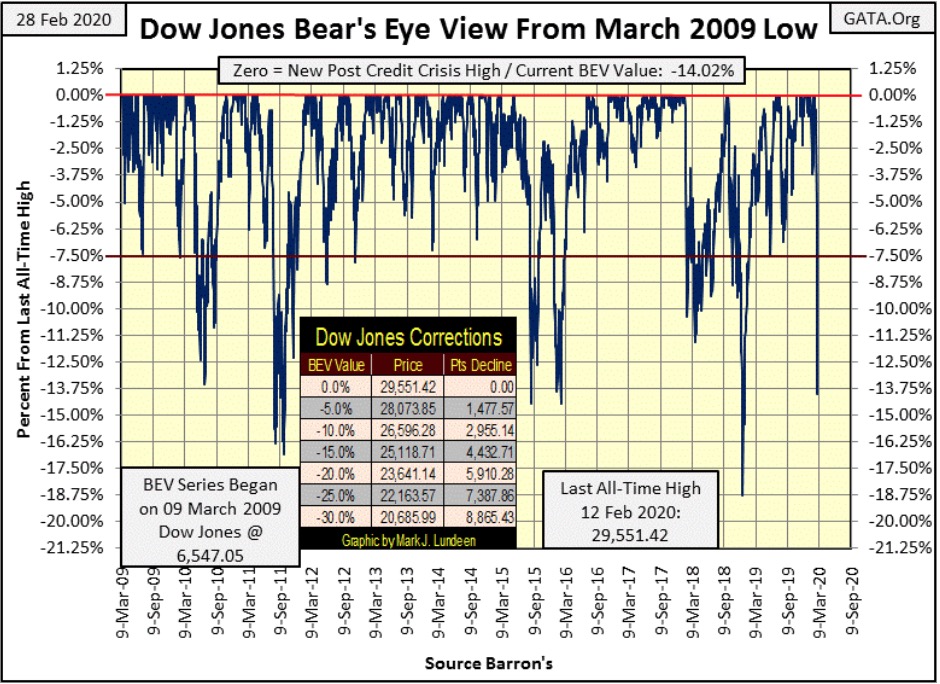
It was only twelve trading days ago where the Dow Jones closed at a new all-time high, (BEV Zero) in the chart above. Now this week for the sixth time since March 2009 the Dow Jones has corrected into double-digit percentages with a swiftness that must be historic.
What caused this? The coronavirus comes to everyone’s mind, especially the “market experts” seen in the financial media. But this market was long overdue for a significant correction. Look at the Dow Jones’ BEV chart above; its BEV series began on March 9th 2009 @ 6,547, the last all-time high occurred on Feb 12th 2020 @ 29,551. And the BEV chart above shows this amazing eleven year advance of 23,000 points that has never seen a correction of 20% or more.
I suspect Mr Bear now plans to correct this anomaly.
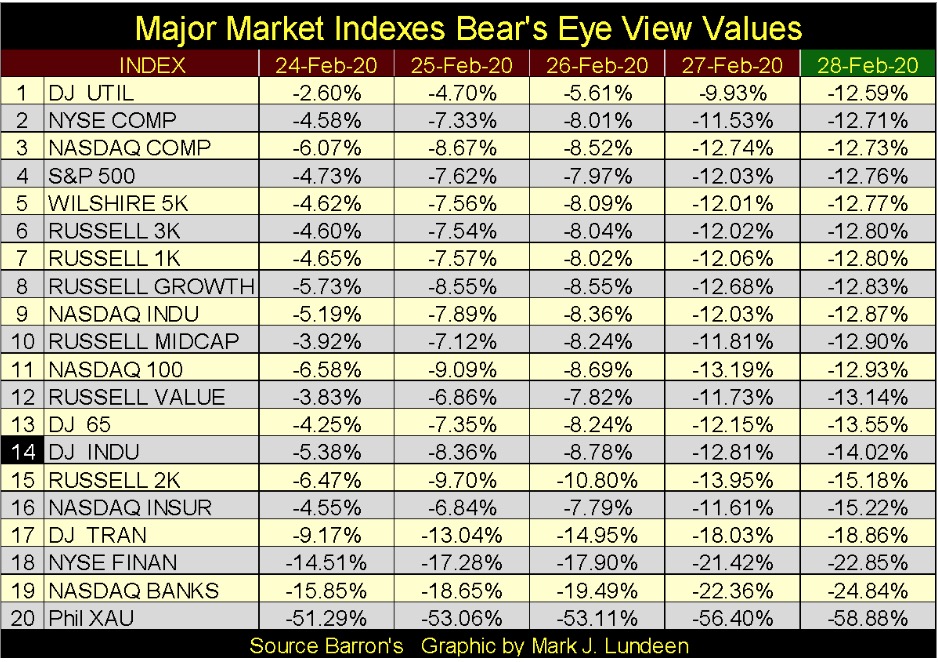
Last Friday sixteen of the major market indexes I follow closed in scoring position (within 5% of their all-time high). This week they were all down by double-digit percentages. At best it will be a few months, and maybe not until next year before we see any new BEV Zeros in the table below.
But then who doesn’t like to think of new all-time highs? In 2020 being optimistically bullish is a habit investors have had since 1982 when the Dow Jones finally broke above, and then stayed above 1000 for the first time in history. Like all of us Mr Bear also has dreams, and from the lofty heights the stock market still finds itself in, what must Mr Bear be dreaming about now?
I still believe the stock market is poised for another Great Depression Bear Market event, one that would take its dividend yield far above its traditional 6% bear market bottom. Why dividend yields are critical to my big-picture view of the market is made clear in the chart below.
From 1925 to 1990 bull markets took the yield for the Dow Jones from somewhere above 6% down to 3%, and bear markets took the yield for the Dow Jones from 3% to something above 6%. So, from 1925 to 1990 (65 years) bear-market bottoms are identified by the Dow Jones yielding something above its 6% red yield line, and bull markets topped when the Dow Jones yielded around 3%.
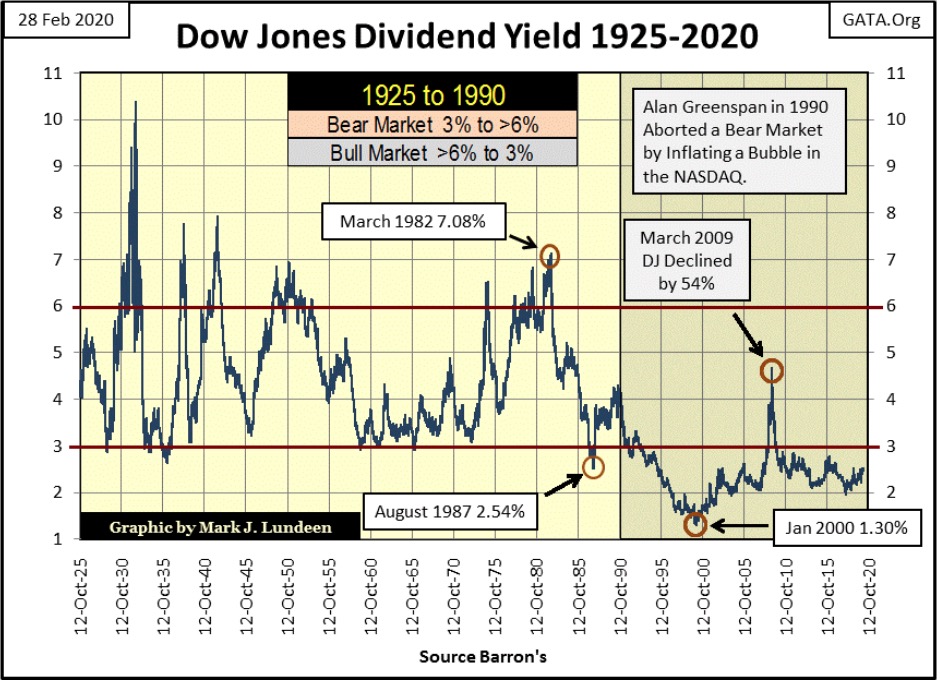
Alan Greenspan put an end to all that, driving the stock market into perpetual overvaluation conditions as he did. At the top of the 1982-2000 bull market, the Dow Jones yielded a historically puny 1.30%. And at the March 2009 bottom of the sub-prime mortgage crisis (Dow down by 54%) the Dow Jones’ yield failed to increase to even 5%. This bears repeating: that the second deepest bear market bottom since 1885, the yield for the Dow Jones failed to break above 5%.
No mystery why; Doctor Bernanke’s QE1 flooded the stock market with liquidly, terminating Mr Bear’s program of market hygiene in the process.
In March 2009 the Dow Jones was paying out $301.43. A yield of 4.74% fixed the valuation of the Dow Jones at this historic market bottom at 6,547 for a 54% market decline from its October 2007 last all-time high of 14,164. However, had the Dow Jones valuation deflated down to where its dividend payout was yielding 6%, the 2007-09 bear market would have seen the Dow Jones at 5,023, or a 64.5% bear market bottom.
Once again the Fed Chairman, this time Doctor Bernanke, thwarted Mr Bear in his efforts to deflate market valuation to historical standards – bear market bottoms seeing the Dow Jones yielding something over 6%.
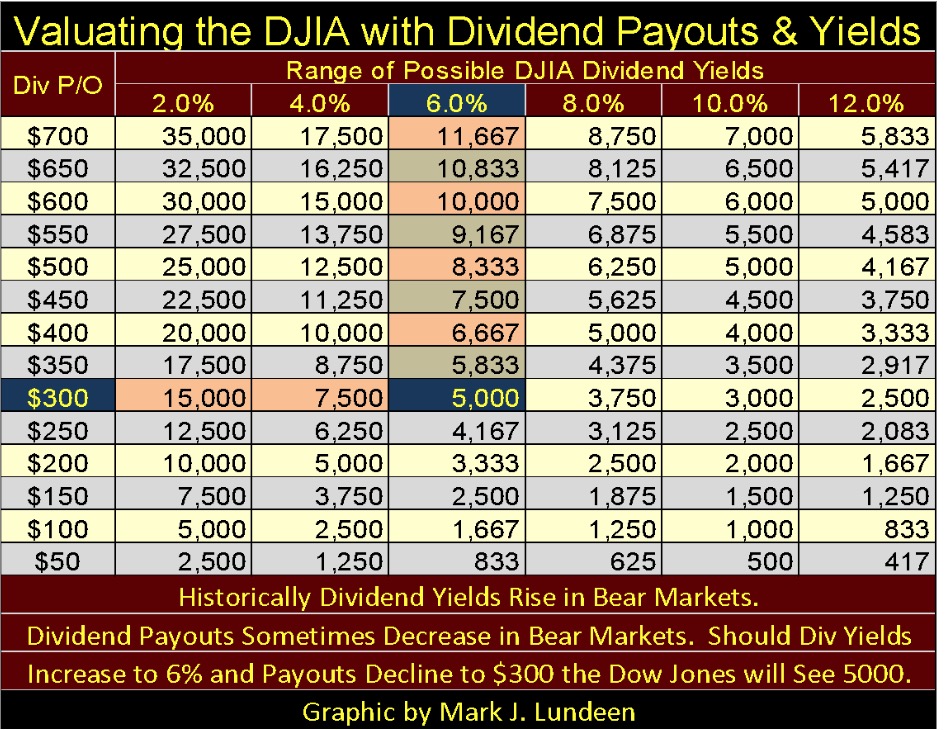
But that was then, while this is now. Today with a payout of $640.32; a 6% dividend yield would result in a Dow Jones of 10,672, again 64% bear market decline from its February 12th last-all time high. However, that massive decline assumes the bear market would bottom at 6% with no reduction in dividend payouts in the Dow Jones; and these are TWO BIG ASSUMPTIONS.
Here’s a table with Dow Jones dividend payouts and yields used to fix the value of the Dow Jones. This week the Dow Jones closed with a payout of $640.32 and a yield of 2.52%. During the Great Depression the Dow Jones payout was cut by 77% as its dividend yield increased to 10.5% at its July 1932 bottom.
Using the Great Depression as a model, that would take the Dow Jones’ current dividend payout from a payout of $640.32 down to $211.3; dividing that by a 10.5% yield would fix the Dow Jones at 2012. That isn’t the year 2012, that’s all that’s left of the Dow Jones after a 93.1% bear-market decline.
Is this a possibility? On a dividend basis, the stock market has been in a chronic overvalued condition since the early 1990s, but except for me no one else is concerned. But considering how the current banking establishment has loaded up corporate America’s balance sheet with junk-bond obligations and derivatives; potential liabilities that in a big-bear market might prevent many current blue-chip stocks from paying out a cash dividend, I can see a time coming when dividends once again become an important consideration in market valuations.
So I’m not ruling out the possibility of a 90% bear market sometime in the years to come. When one considers all of the derivatives obligations that could impact corporate America (and its banking system); should things becomes really dark, the above scenario with the Dow Jones paying out a cash dividend could prove to be wildly optimistic.
But it’s too early to assume the Dow Jones is at the edge of a 93.1% market decline. I wouldn’t even rule out the possibilities of more all-time highs for the stock market before the BIG ONE comes on line. The Federal Reserve’s powers to inflate market valuations must be respected, until the day comes that they and the dollar they manage are discredited.
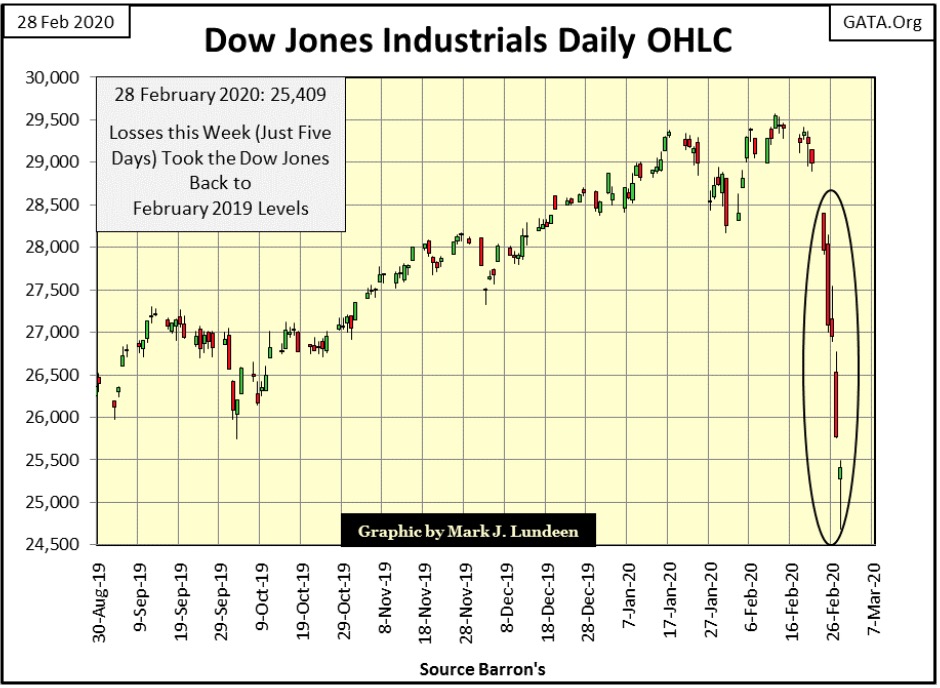
Here’s a really ugly chart; the Dow Jones in daily bars below. This week’s declines wiped out all the gains since last February. Mr Bear is feeling pretty good about that! But most of 2019 saw the stock market seeking direction, not really trending up or down, until October when the FOMC terminated its Quantitative Tightening (QT) and began its fourth round of Quantitative easing, though they don’t call it that.
So as I see it; this week (five trading days) wiped out all (and more) of the inflationary gains “injected” into market valuations since early last autumn.
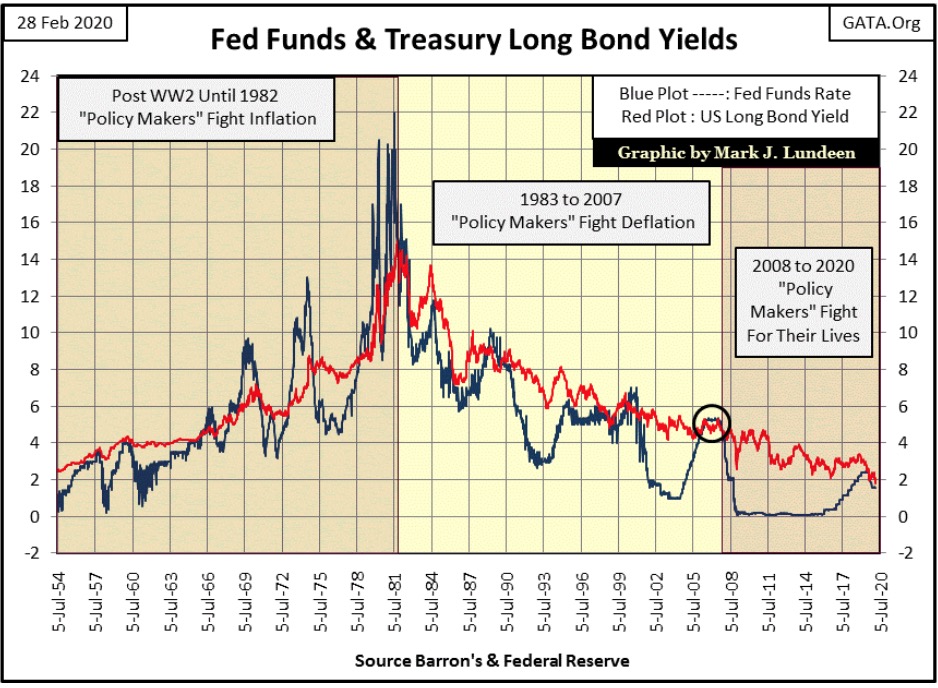
In a market such as this, where can one go to seek shelter from the storm? So far the refugee dollars fleeing the deflation seen above haven’t gone into precious metal assets, but into the US Treasury debt market. The US Treasury Long Bond Yield (Red Plot below) closed this week at 1.79%, the lowest yield since July 1954 when the US National debt was only $270 billion dollars, not its current $23 trillion.
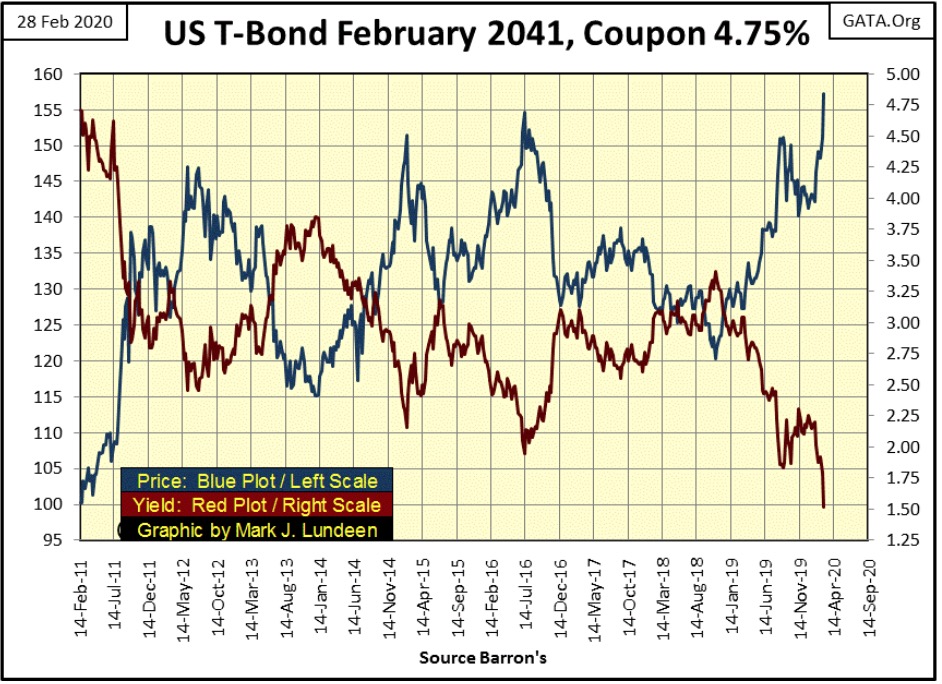
Next is a 30 YR_T-bond I’ve been tracking since February 2011. It was issued with a coupon of 4.75% and closed the week yielding 1.52% as fear gripped the financial markets this week. So, we’re not looking at rational people seeing a safe return on their money below, but the action of people motivated by fear “seeking safety in the Treasury Market.”
So far this has worked. But with T-Bond’s long yields (Red Plot above) at their lowest in the past seven decades, the debt market appears to be yet one more bubble inflated into the financial markets by the Federal Reserve. In the fullness of time, when Mr Bear begins his work in the debt markets, I expect this leaping from the deflating bubble in the stock market into the still inflating bubble in the T-bond market will prove to be ill advised.
So what other option do people have to seek safety from deflation in the stock market?
Here’s a table of the major indexes I follow giving end of week BEV values as well as the market declines they had since 12 February 2020, the date of the Dow Jones last all-time high.
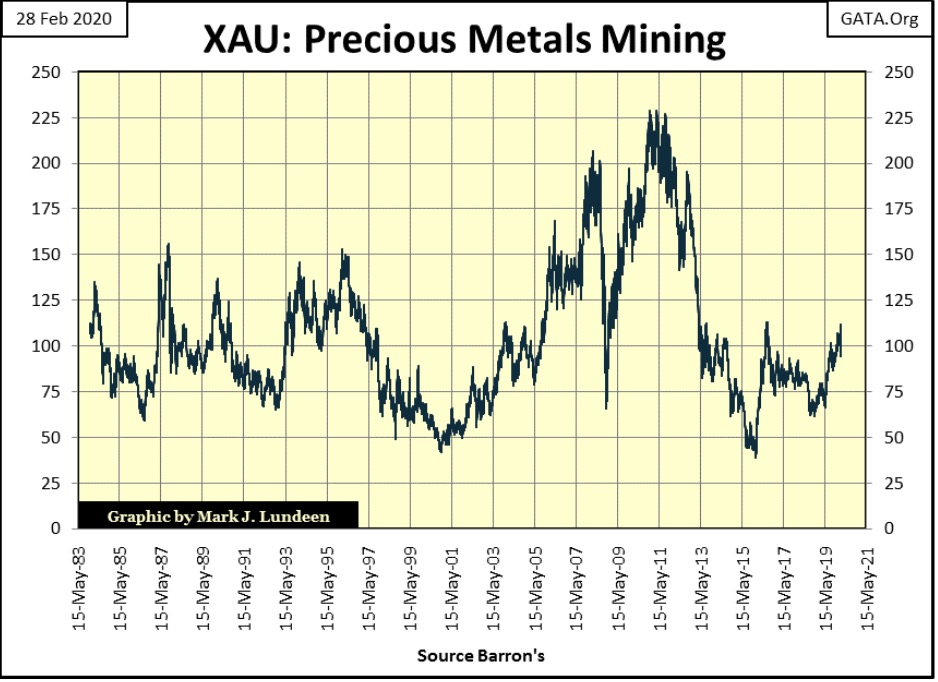
Of the list below, I still believe the gold mining shares (#1) are the best option in the stock market for investors seeking safety from deflating market valuations. First of all the XAU, unlike the T-bond market isn’t overvalued, and hasn’t been for many years. Its BEV value of -58.88% tells us that. And since the Dow Jones last all-time high of February 12th, the XAU is the only index that hasn’t declined by double-digits percentages.
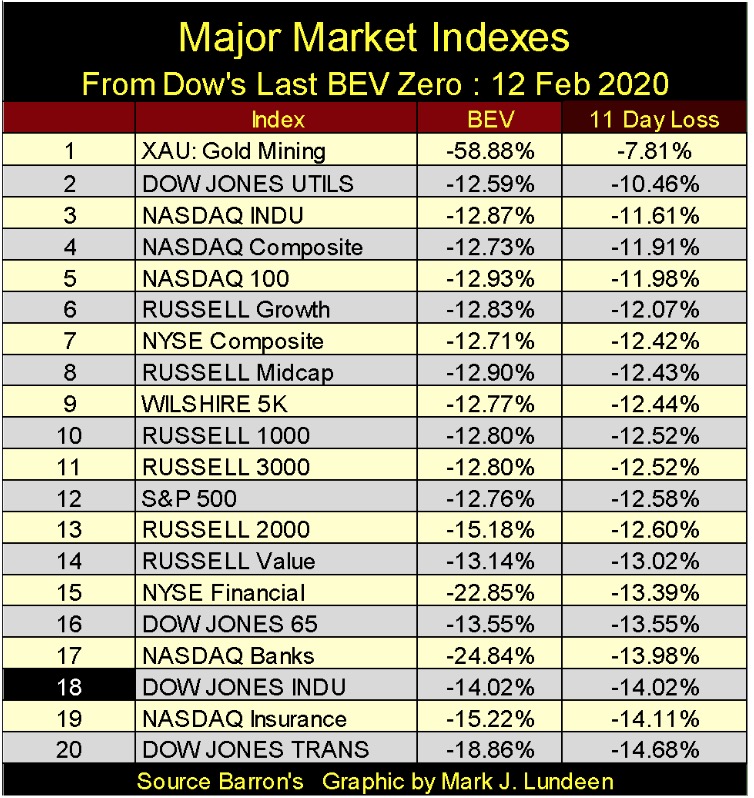
Gold and silver mining companies (currently ignored by most), remains a viable alternative safe harbor in the coming months and years as I see it. With the XAU closing this week below its first day of trading in 1983, one can’t describe mining shares as overvalued.
As seen in his report card below; Mr Bear was a very bad bear this past week, with three extreme days for both market volatility and NYSE market breadth. Six extreme market events in a single week have produced a lot of market trauma. Maybe we’ll see some more extreme market events next week, but I expect next week will be calmer on the markets.
But should we see one or more big POSITIVE extreme market events, say like the Dow Jones seeing a big +3 or 4% daily move; such a large positive daily advance doesn’t mean the swimming pool is now a crocodile-free zone. In fact historically it’s during bear markets that the Dow Jones has seen it largest daily advances.
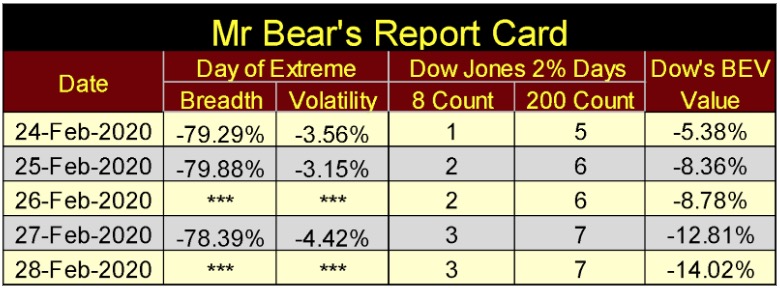
That is just Mr Bear baiting his trap for more bulls. So a big day to day advance in the Dow Jones (+2% or more) next week would only make me more bearish on the market, though I recognize the next big impulse down may be months from now.
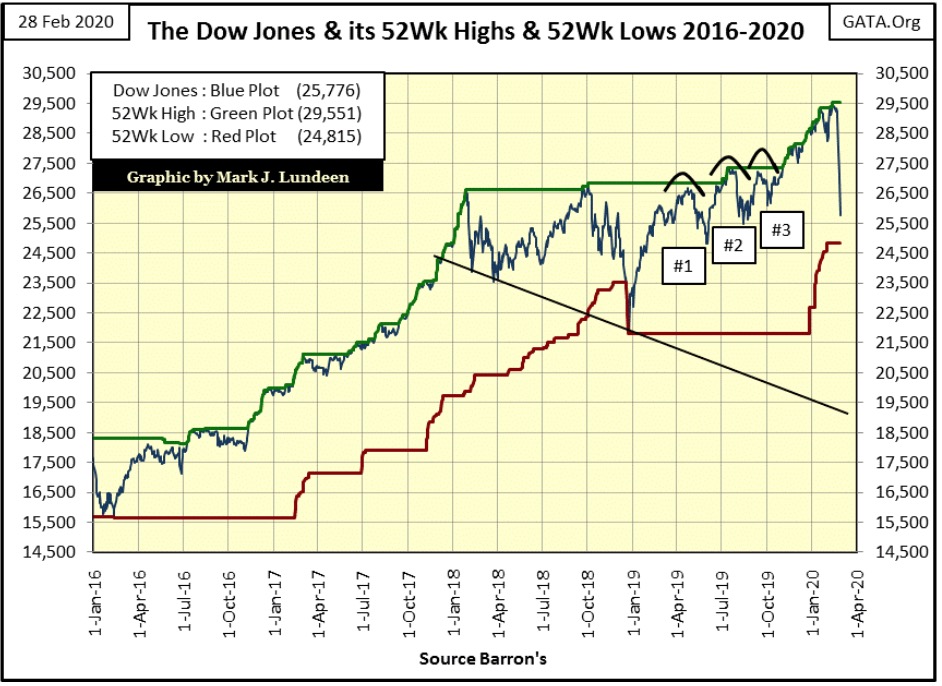
Next is the Dow Jones with its 52Wk High & Low lines. In the past eleven NYSE trading sessions the Dow Jones went from pushing up its 52Wk high line down to almost touching its 52Wk low line.
Markets don’t go from one 52 Week extreme to another in smooth uninterrupted movements as seen this past week in the chart below. Over time what markets do is see are days that advance, while others decline in a saw tooth pattern as their valuations trend upward or downward. That makes this eleven day move really stand out in the chart below: from one 52Wk extreme to just short of the other – BOOM!
Just looking at this chart, I get the feeling the Dow Jones could see a few good weeks ahead of it before it once again begins pushing down towards its 52Wk lows line. In other words it may be wise seeing future market advances as selling opportunities.
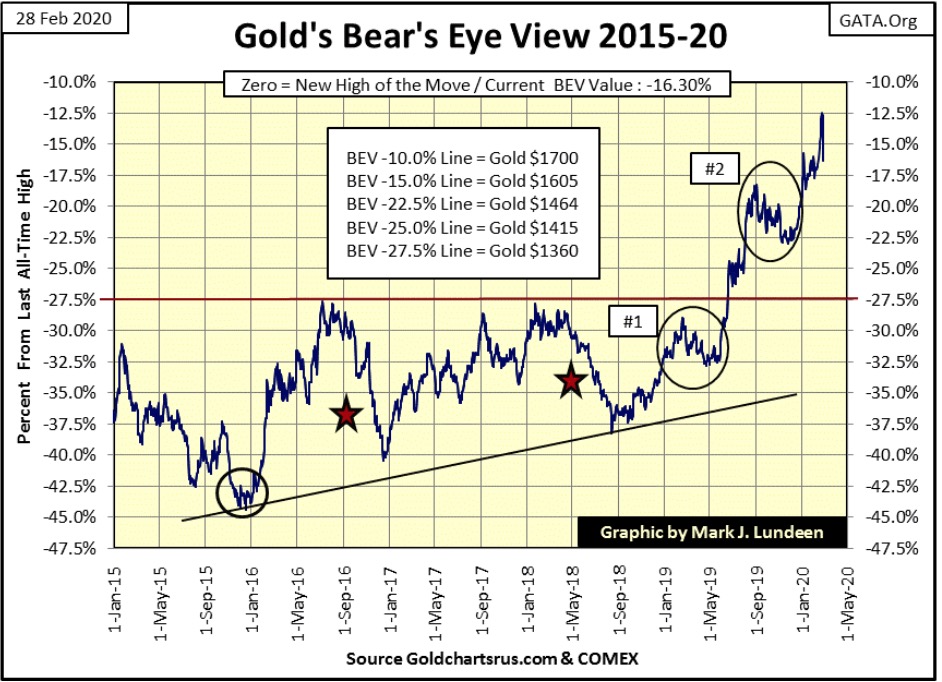
Comparing gold’s BEV chart below with the Dow Jones’ above, gold held on to its recent gains pretty good considering the waves of deflation rocking the financial markets last week. It’s important to keep in mind that in the early stages of a selling panic everything goes down. This is because leveraged speculators must sell something to cover their losses in their margined positions; gold and silver is one of the things people sell to cover their losses.
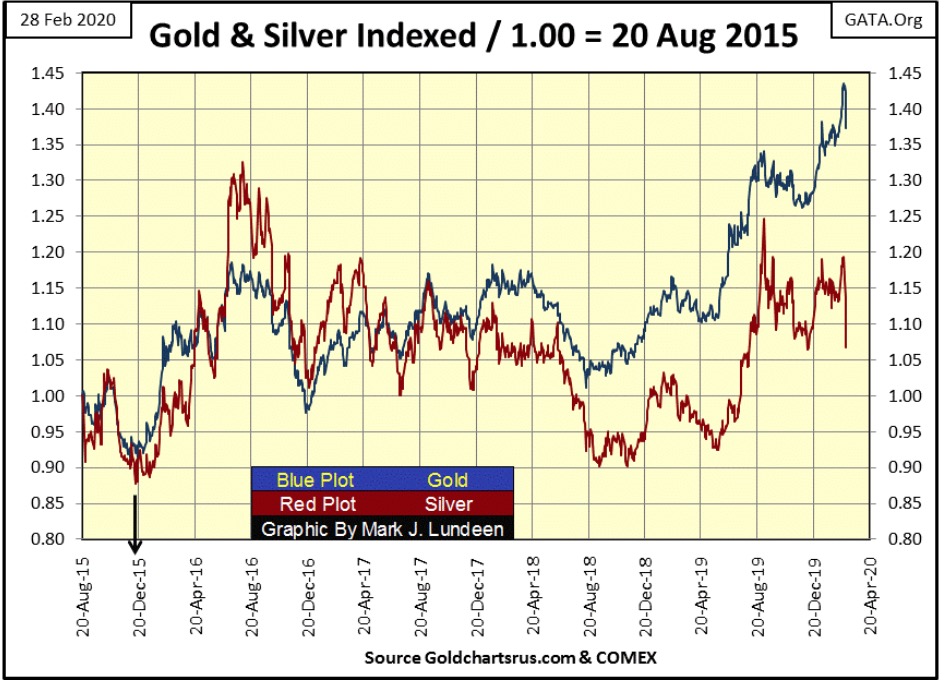
Next is a chart plotting the indexed values of gold and silver with 20 August 2015 = 1.00. Since gold and silver’s December 2015 bear market bottom (Black Arrow), they’ve advanced. However the gains in the stock market since 20 August 2015 were much greater than gold 44% and silver’s 18% advances over the past four years:
- Dow Jones: 74%;
- NASDAQ Composite: 110%;
- XAU: 90%.
As the old monetary metals are typically countercyclical to the stock market, future deflation in the stock and bond markets should be very positive for the prices of gold and silver and their miners.
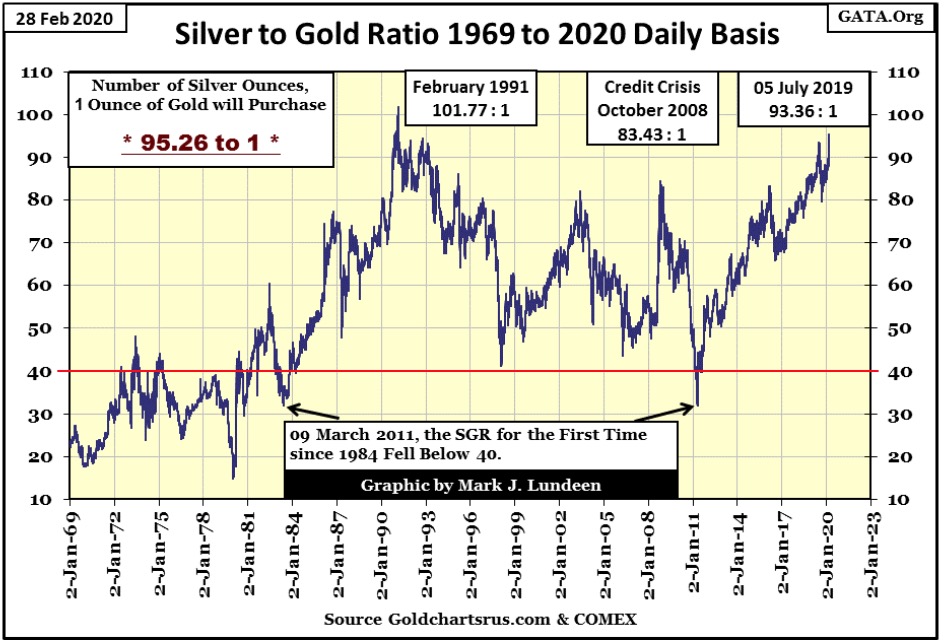
The silver to gold ratio (SGR) soared to 95.26 ounces of silver to one ounce of gold at the close of the week. I’m a precious-metals bull, but I’m also human. Seeing the SGR rise to these lofty levels as the stock market melted down this week is discouraging.
But I have to keep in mind gold and silver prices are fixed in the COMEX futures markets where banks that have nothing to do with precious metals mining, fabrication or distribution set their prices via future contracts that will never deliver an ounce of gold or silver to the market. The precious metals markets are rigged markets with their market regulators at the CFTC in on the scam; but this too shall pass.
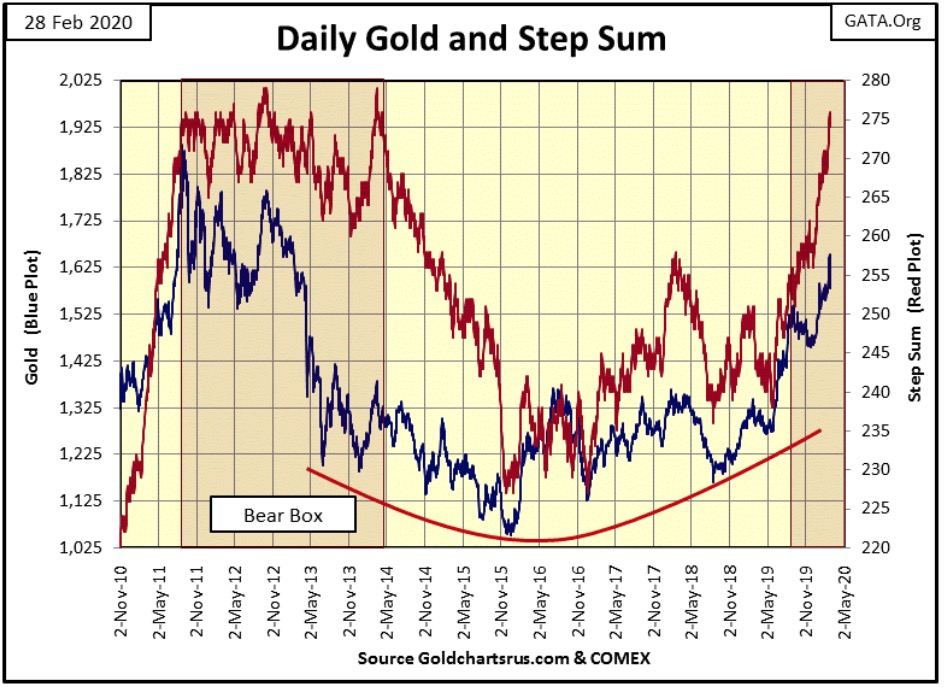
Looking at gold’s step sum chart below, not much has changed since last week, so gold remains a strong buy.
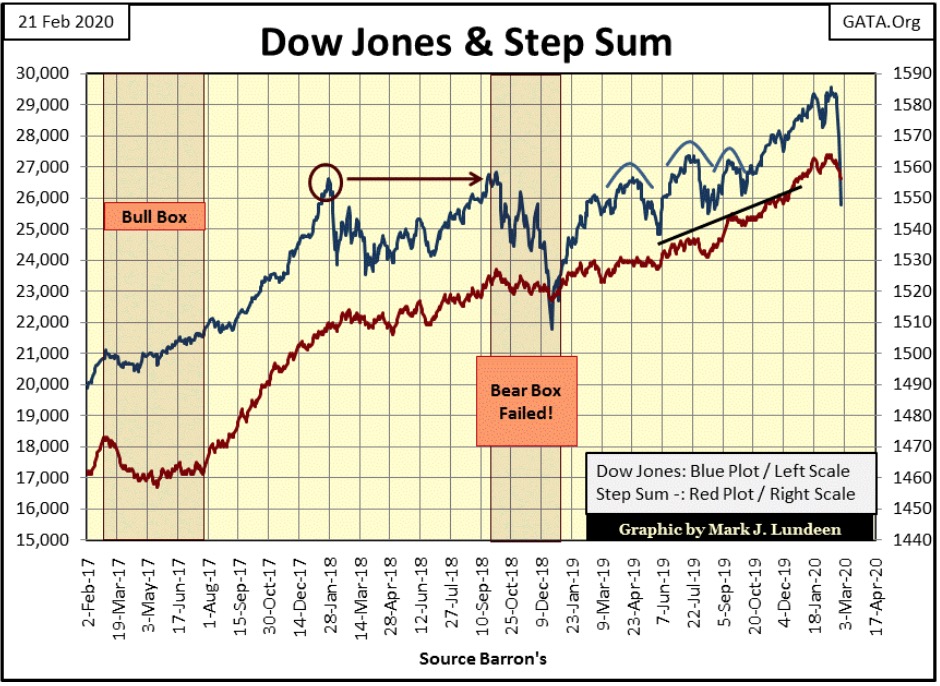
The same can’t be said for the Dow Jones in its step sum chart. Mr Bear really did some damage to the stock market this past week.
Gold’s and the Dow Jones’ step sum table below give a good comparison between the two markets. Gold may be frustrating to its followers, but it is still up by 0.63% since January 24th. Its volatility has increased to 0.65% – which is good for us bulls, and its step sum continues advancing with the price of gold. With its 15 count closing the week at +5, gold currently isn’t over bought.
Technically the gold market is set for further gains in the weeks to come.
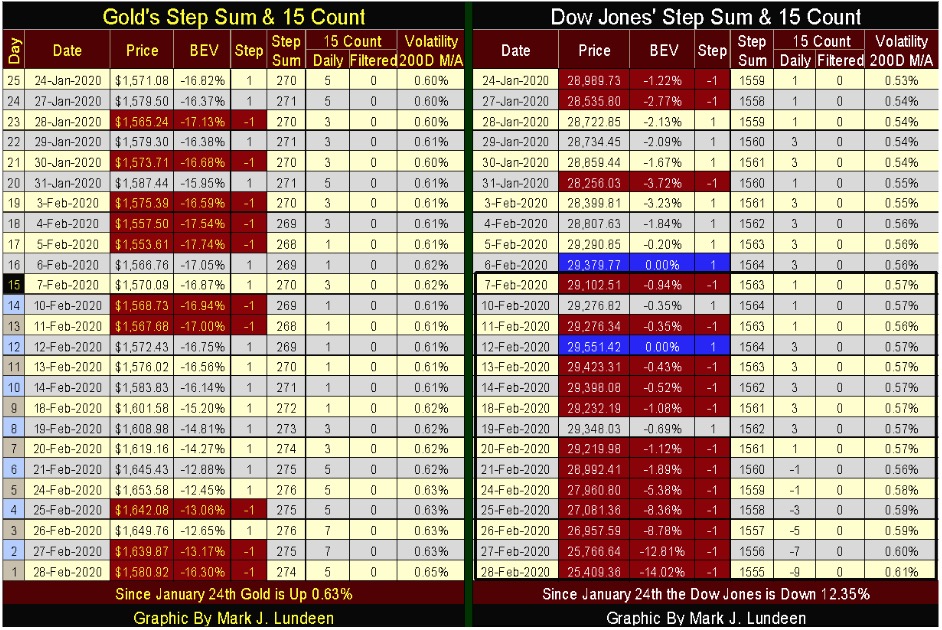
The same can’t be said for the Dow Jones, my proxy for the general stock market. Since January 24th its valuation has deflated 12.35% and taking its step sum down with it. Its volatility is also rising, and that is never good for the stock market. We need to note its 15 count closed the week at a BIG -9, meaning the Dow Jones is in an oversold situation.
I have no crystal ball to gaze into next week’s market action, but just looking at the market’s end-of-week tea leaves above, I expect to see further market weakness on Monday, and maybe on Tuesday too. But someday next week I wouldn’t be surprised should the Dow Jones see another day of extreme market volatility, but a positive one that could be greater than a 3% jump from a previous day’s close.
This positive extreme market event will be hailed by the main-stream financial media as an all clear to the general public. But Dow Jones 2% days, days the Dow Jones moves 2% or more from previous day’s close, whether they be daily advances or declines are bear market events.
During the 2007-09 sub-prime mortgage bear market (chart below), the Dow Jones saw a daily advance of over +10%, and it wasn’t bullish. During the 1929-32 Great Depression Bear Market the Dow Jones once saw a daily gain of more than +15%.
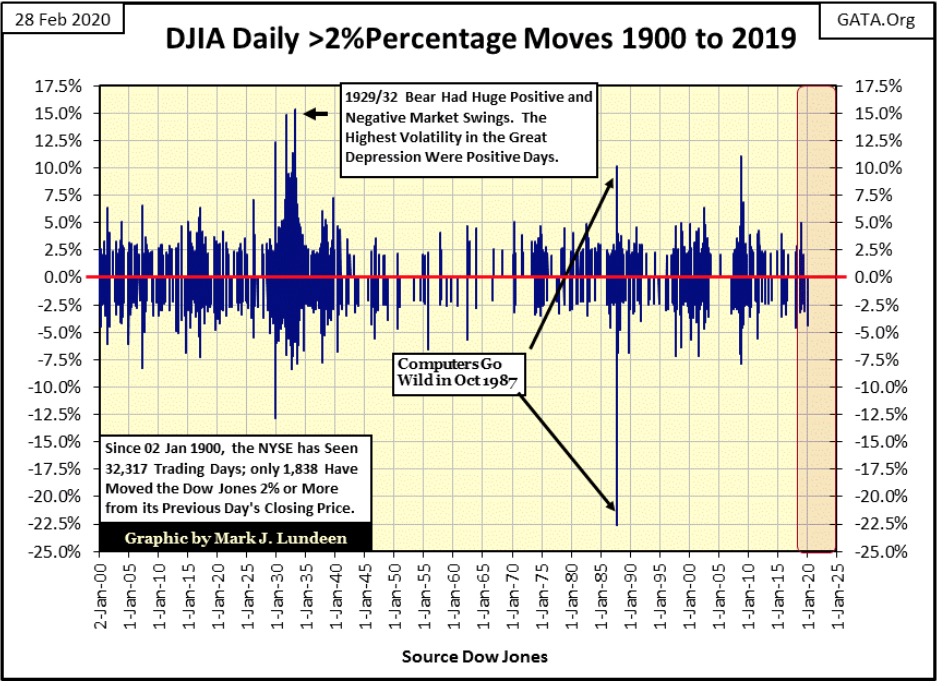
Should we see a big daily advance next week; history strongly suggests we be very suspicious of it lest we lapse into a false sense of security in the early stages of a big-bear market.
—
(Featured Image by Austin Distel on Unsplash)
DISCLAIMER: This article was written by a third party contributor and does not reflect the opinion of Born2Invest, its management, staff or its associates. Please review our disclaimer for more information.
This article may include forward-looking statements. These forward-looking statements generally are identified by the words “believe,” “project,” “estimate,” “become,” “plan,” “will,” and similar expressions. These forward-looking statements involve known and unknown risks as well as uncertainties, including those discussed in the following cautionary statements and elsewhere in this article and on this site. Although the Company may believe that its expectations are based on reasonable assumptions, the actual results that the Company may achieve may differ materially from any forward-looking statements, which reflect the opinions of the management of the Company only as of the date hereof. Additionally, please make sure to read these important disclosures.

-

 Crypto7 days ago
Bitcoin Rebounds Above $70K as Crypto Markets Show Fragile Signs of Recovery
-

 Crypto2 weeks ago
Crypto Markets at a Crossroads as Bitcoin Slides to $75,000
-

 Biotech4 days ago
Europe Launches Personalized Cancer Medicine Initiative
-

 Impact Investing2 weeks ago
Enfinity Launches First Solar Plant in Italy with Microsoft


