Markets
OPEC’s decision might cause a false breakout in crude oil prices
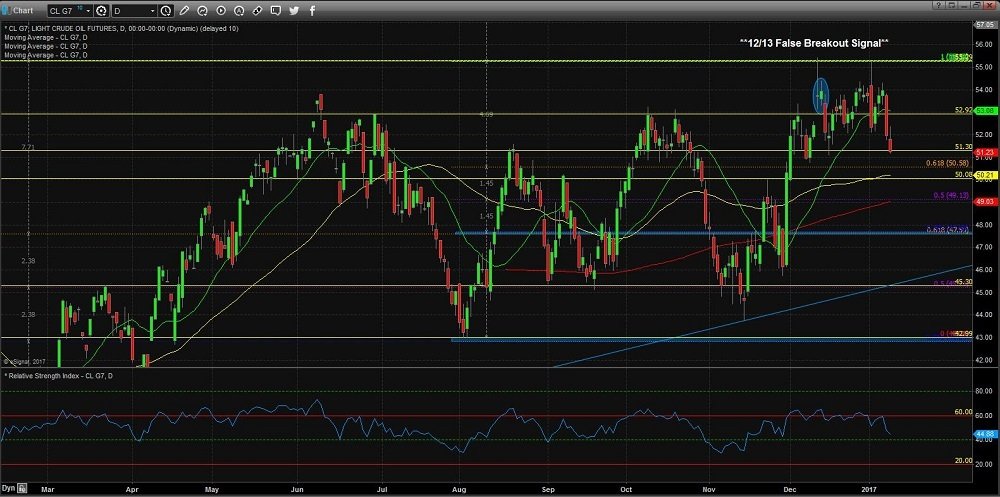
December 13th, 2017 marks a confirmed close in the February 2017 oil contract of 53.94, $0.12 higher than the June 9th high from last year.

In late November of last year, OPEC members agreed to cut global oil production 1.2 million barrels a day, thus setting the stage for an impressive rally in oil futures prices.
After surging over $5/barrel in the two days following the announcement, oil prices seemed poised for a retest of the $60.00 level, a price not seen in crude oil for over a year. Bullish sentiment dominated the headlines and continued strength was seen as a highly probable outcome.
Fast-forward several weeks to the present price action and participants seemed puzzled as to why the market hasn’t been able to breach the $60 level. Was it lack of confidence in the OPEC agreement? A strong US Dollar hindering commodity price strength? These are questions that come to mind when assessing the recent action in crude oil futures and central to the conversation is the question “Is this a false breakout in crude oil?
December 13th, 2017 marks a confirmed close in the February 2017 oil contract of 53.94, $0.12 higher than the June 9th high from last year. The market has been range-bound for the latter half of 2016 within a $10 range and, the close on December 13th of 2017 market a potential upside breakout from this range. However, this signal was followed by a sharp retraction back into the range and further consolidation. Just as traders were gearing up for a run at the psychological $60 level in oil, the market disappoints and further consolidation ensues.
As traders celebrate the New Year, crude oil prices continue to labor at these levels. A strong US Dollar is one of the several possible causes for recent weakness in oil, yet one thing remains certain: Oil is having a difficult time maintaining the recent “breakout” signal.
Despite recent weakness in oil prices, not all hope for a push to $60 has been lost. The intermediate term directional bias in this market remains positive as the chart shows continual higher high, higher low structure. The 12/8 low of 50.76 marks a relative low that prices action should respect if the market is to maintain the near-term structure. A confirmed close below this pivot will mark a relatively lower low on the chart, and could be an earlier indication of further weakness in the oil market.
As market participants gear up for another exciting year of trading, I wanted to make available a complimentary issue of our 2017 Commodity Trading Guide, which you can request through the following link.
Charts complements of e-Signal. Trading futures and options do include a substantial amount of risk and are not suitable for all investors. Source © Erik Tatje
—
DISCLAIMER: This article expresses my own ideas and opinions. Any information I have shared are from sources that I believe to be reliable and accurate. I did not receive any financial compensation in writing this post, nor do I own any shares in any company I’ve mentioned. I encourage any reader to do their own diligent research first before making any investment decisions.


Youth Cannabis Use in Colorado Is Falling — But the Full Story Is More Complex
The 2026 Colorado survey shows teen cannabis use fell to 10 percent in 2025, down from 21 percent in 2015....


Morocco’s Growth Holds at 4.6% as Agriculture Offsets Economic Pressures
Morocco’s economy grew 4.6% in Q1 2026, driven by a strong agricultural rebound offsetting declines in industry. Services expanded moderately...


Abivax Shares Surge as New Trial Data Eases Safety Concerns Over Ulcerative Colitis Drug
Abivax shares surged nearly 36% after positive updated trial results for its ulcerative colitis drug obefazimod reassured investors following earlier...


El Dorado Raises $9M to Expand Cross-Border Fintech Platform
El Dorado, a Latin American fintech improving cross-border financial services, raised a $9 million Series A led by Paradigm with...


Bitcoin Stalls Near $60K as Strategy Moves, ETFs Outflow, and EU MiCA Rules Take Effect
Bitcoin hovers near $60,000 with ETF outflows, while Strategy boosts reserves, sells BTC, and raises dividends to reassure investors. Ethereum...
 |
|
 |  |
 |
|
-

 Crowdfunding1 week ago
Ithaca: Climate Road Trip RPG on Climate Resistance
-

 Fintech2 weeks ago
Fintech and AI: Adoption Grows, but Profits Favor Agile Innovators
-

 Fintech5 days ago
PayPal’s Slowdown: From Fintech Leader to Low-Growth Dividend Stock
-

 Impact Investing1 week ago
Edison Accelerates Renewable Growth and ESG Impact in 2025
You must be logged in to post a comment Login