Featured
How did Pearl Harbor affect the Dow Jones?
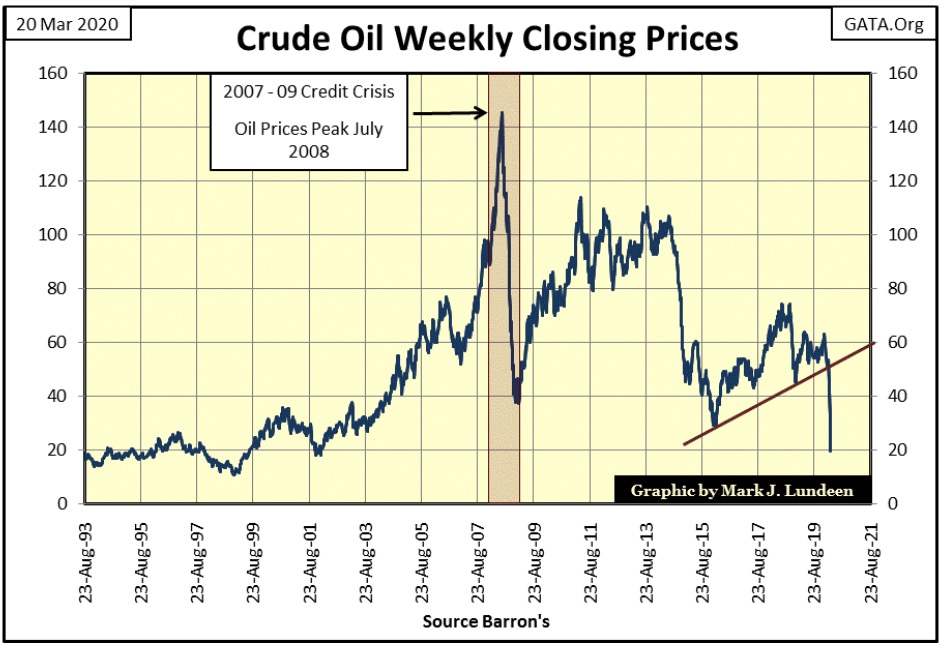
In the past twenty-five trading days gold is down 6.27%, while the Dow Jones is down a stunning 34.78%. Gold is a much more attractive place to have one’s investment funds. Last week with crude oil closing at $32 a barrel, I was thinking about the ability of the shale-oil companies to service their debts when their costs of oil production is far above what the oil market today is offering them.
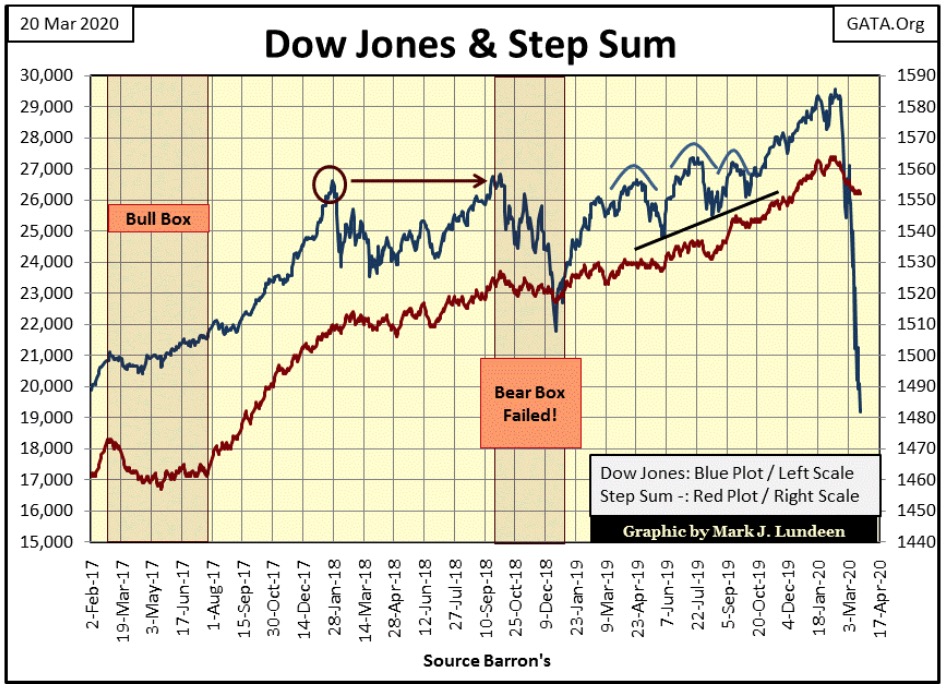
The Dow Jones (my proxy for the broad stock market) continues deflating. Last week the Dow Jones closed at a BEV of -21.54%, this week it closed at -35.12%, an additional 14 BEV points into what I believe will ultimately prove to be a historic bear market.
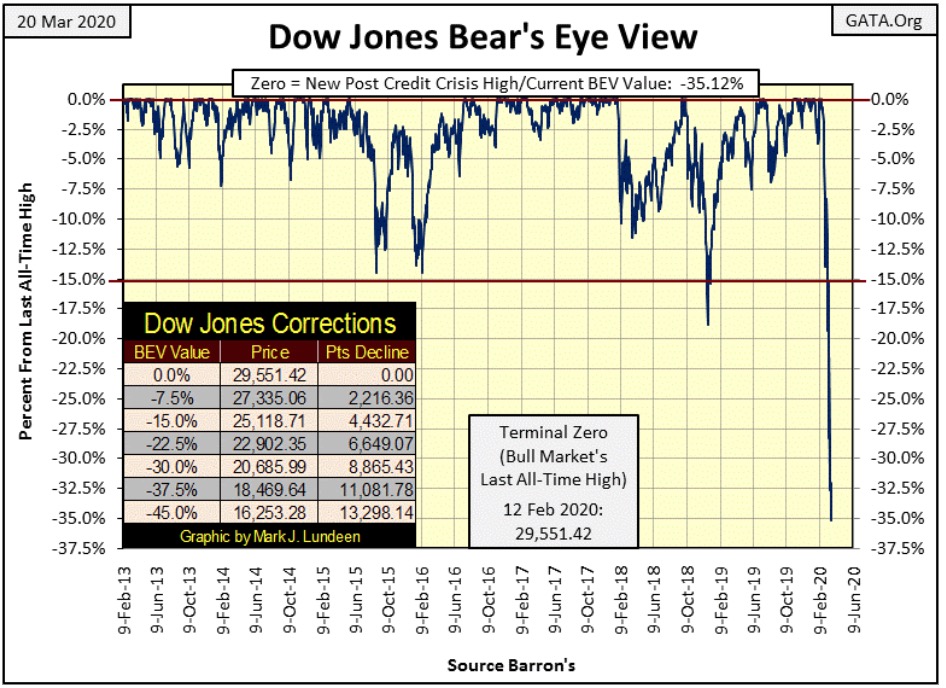
But aren’t all bear markets historic? Yes, but not all are long remembered such as the 1929 to 1932 bear market; (see table and BEV chart below).
From 1885 to 2009, seeing the Dow Jones deflate down to its BEV -40% line provided a signal the bear market was approaching its ultimate bottom. For 124 years, this made a Dow Jones 40% market decline a dependable signal the worse was over, that it was safe to return to the stock market.
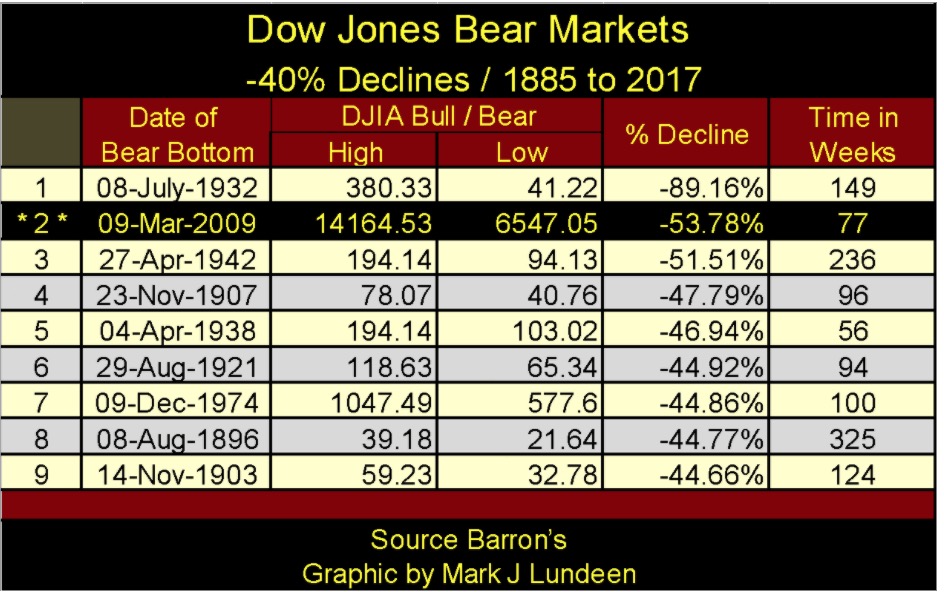
The sole exception to this 40% rule was the Great Depression Bear Market; a bear market that saw an 89% market decline in the BEV chart below.
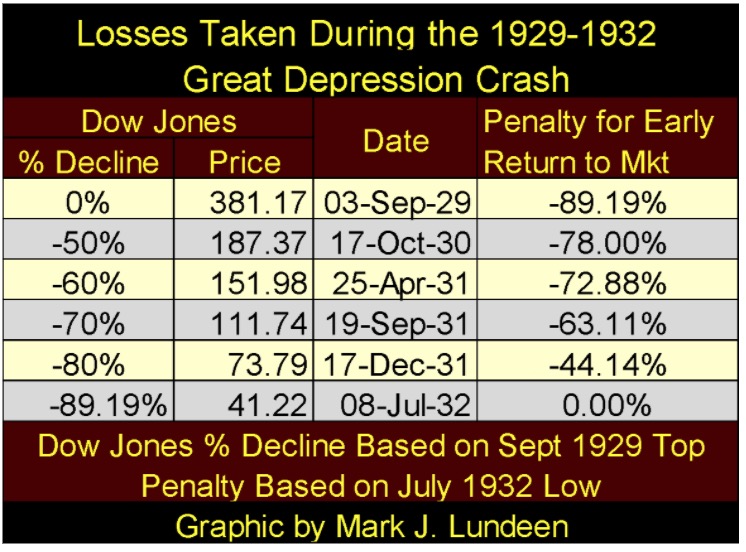
The mathematics of an 89% market decline makes for grizzly arithmetic, as seen in the table below. One year into the 1929-32 bear market, the Dow Jones deflated to 187.37, about a 50% market decline from the highs of the year before.
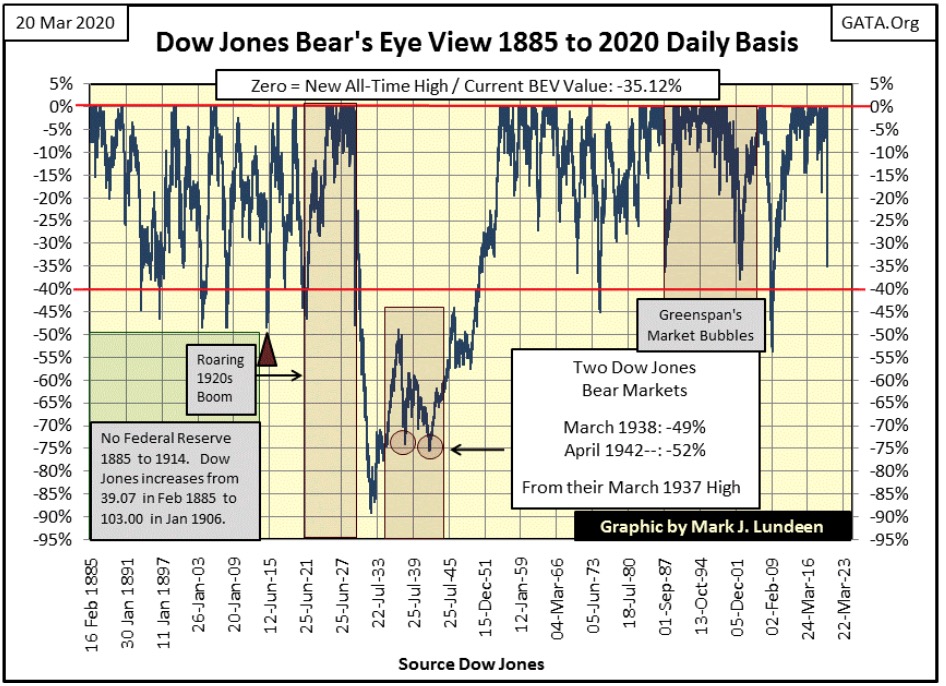
As you can see in the Dow Jones’ BEV chart above, since 1885 the Dow Jones had yet to see a 50% market decline. I’m sure the bulls from ninety years ago were asking themselves; how much worse could it get as they rubbed their hands in glee for all the bargains now available one year into the Great Depression bear market. However as it turned out, things were going to get much worse before the Dow Jones saw its ultimate bottom.
The problem in October 1930 was with a 50% market decline, people were only looking at the Dow Jones last all-time high (381.17). What they didn’t look at because they couldn’t see was the ultimate bear market low seen in July 1932.
We in March 2020 now know the bottom to the Great Depression Bear Market: 41.22. So we know what happened to anyone who entered the stock market in October 1930 with the Dow Jones at 187.37. If they were “investing for the long term;” in the next two years, they lost 78% of their investment.
Then there were those who entered the market with the Dow Jones down 70% in September 1931; if they held on to the bottom they took a 63.11% loss in their investment. Even in December 1931, with the Dow Jones down 80% (73.79) from its highs of September 1929, “investing for the long term” resulted in these intrepid investors to lose 44% of their investment in the next six months when the Dow Jones bottomed at 41.22.
Assuming the Dow Jones’ current bear market is also fated to be a 90% bear market, as was its 1929-32 bear market, the following table provides the same information seen above, but using the Dow Jones current last all-time high of 29,551.42.
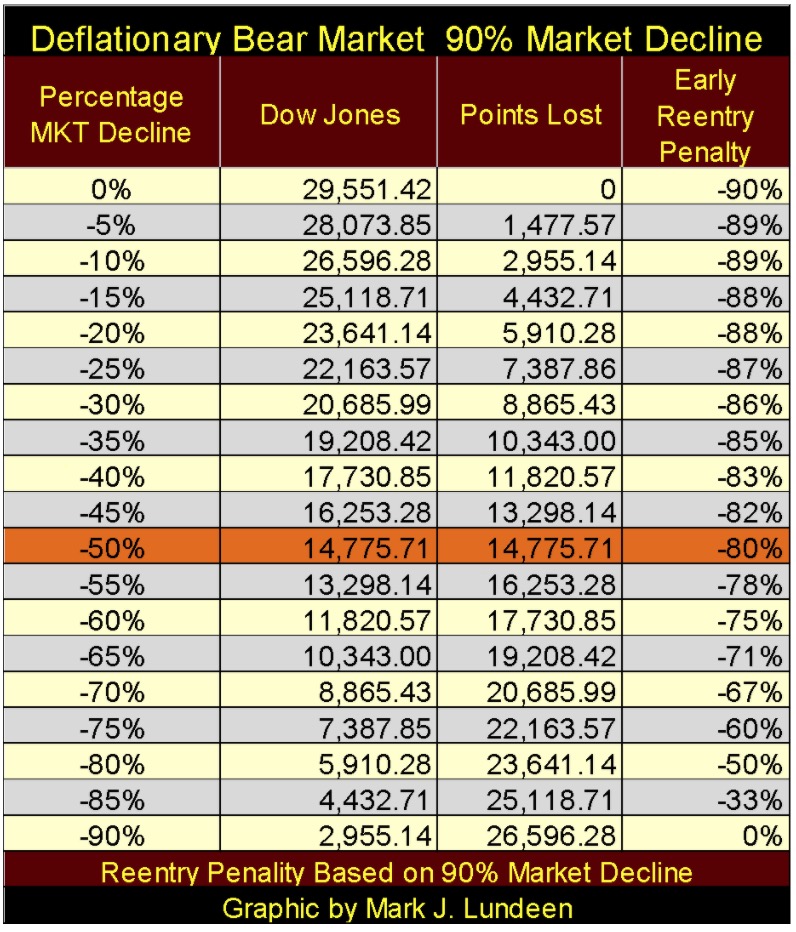
Am I saying this bear market will ultimately deflate the Dow Jones down to 2,955? I haven’t a clue what the ultimate bear market bottom will be; hopefully far above 3000! But modeling the Dow Jones using historical dividends, a case can be made that the ultimate bottom to this bear market could be far below 2,955 too.
So, just be careful when dancing with Mr Bear in the months and years to come. If you’ve made a trade that is profitable, let it run. But be ruthless on any trade that turns against you. In a market like this NEVER HOPE A LOSING POSITION WILL TURN AROUND; dump it quickly and try again some other day; or for most people just keep out of the market.
As expected the other major stock indexes were also under pressure this week.
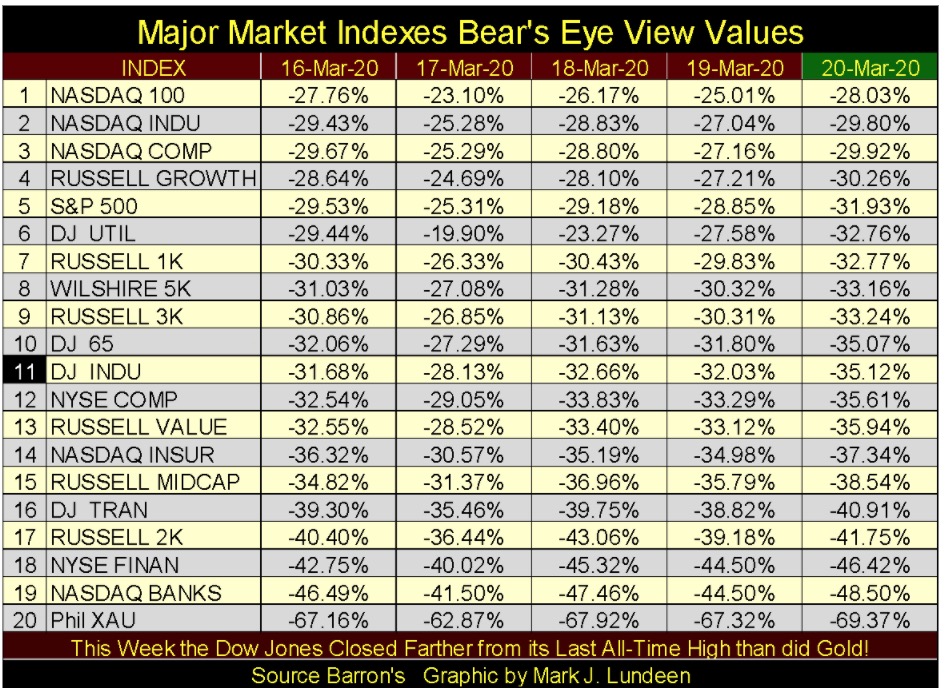
The two indexes above that I’m watching closely are the NYSE Financial Index (#18) and the NASDAQ Banks (#19), and I’m watching them for the same reason I did during the sub-prime mortgage bear market, as leading indicators for a pending, and massive counter-party default event.
Last week with crude oil closing at $32 a barrel, I was thinking about the ability of the shale-oil companies to service their debts when their costs of oil production are far above what the oil market today is offering them. This is a situation that will result in massive debt defaults in the financial system should oil prices remain this low for long. Crude oil closed this week at $19.84 and I’m still thinking it.
With the pending Chinese-coronavirus quarantine, where places of business spanning from factories to restaurants shutting down to limit exposure to the virus, I’d say the potential for massive debt defaults in more than just the shale-oil companies in the next six months is now guaranteed.
What these temporary business closures will do for corporate earnings and dividend payouts, or market valuations trading in the stock market can’t be good. And then what about these companies employees? How are they to service their debts and pay for their living expenses in an economy that is shutting down – for whatever reason?
Is a 90% bear market for the Dow Jones still unthinkable?
Mr Bear, as seen in his report card below, has calmed down a bit this week. Obviously the medications and “injections of liquidity” administered by the FOMC are having some effect, but not much. This week still had six extreme market events, and that is big bear-market action.
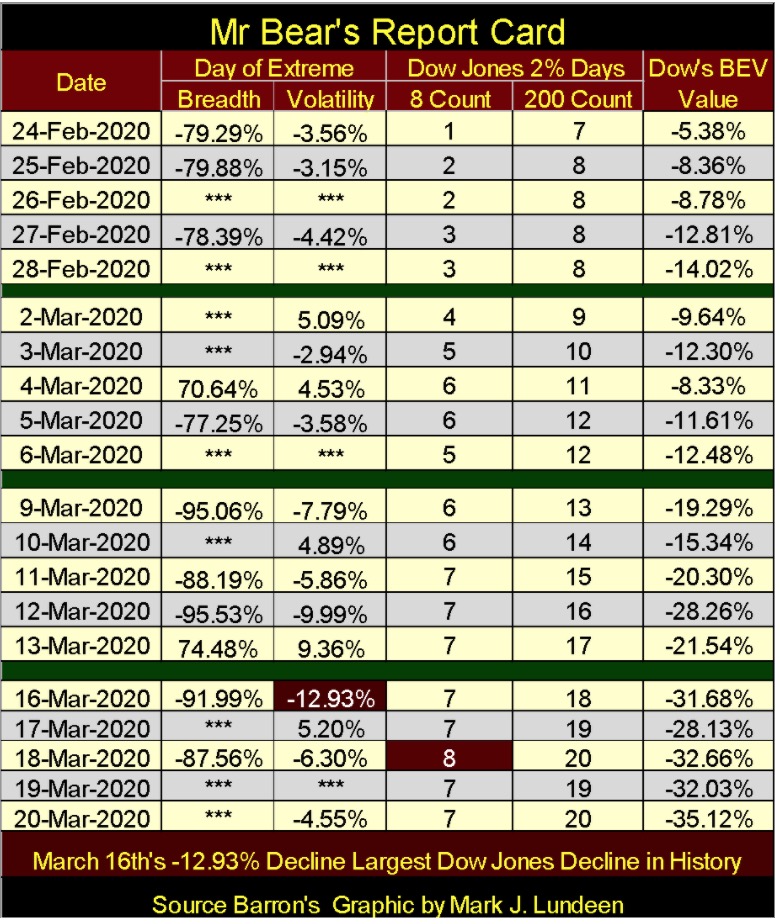
I highlighted the Dow Jones -12.93% day of extreme market volatility seen on Monday, as well as the 8 count of eight seen on Wednesday’s close.
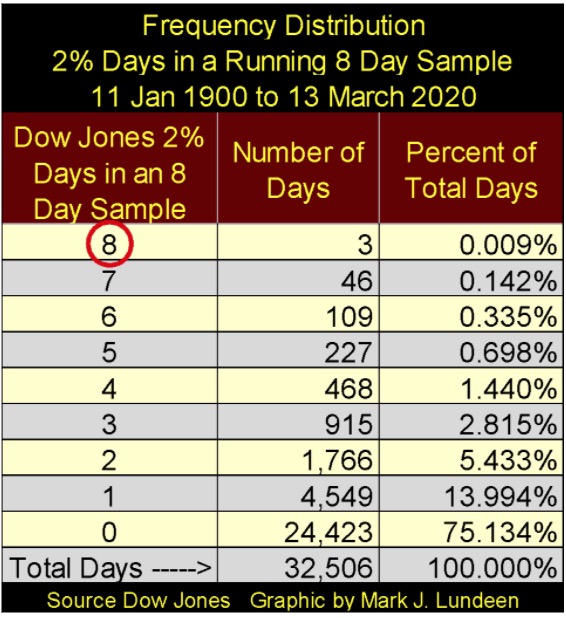
Since January 1900, the Dow Jones’ 8 count had registered an eight only three times in the past 120 years (table below) – that’s eight consecutive days of extreme volatility (Dow Jones 2% days) as seen in Mr Bear’s report card above.
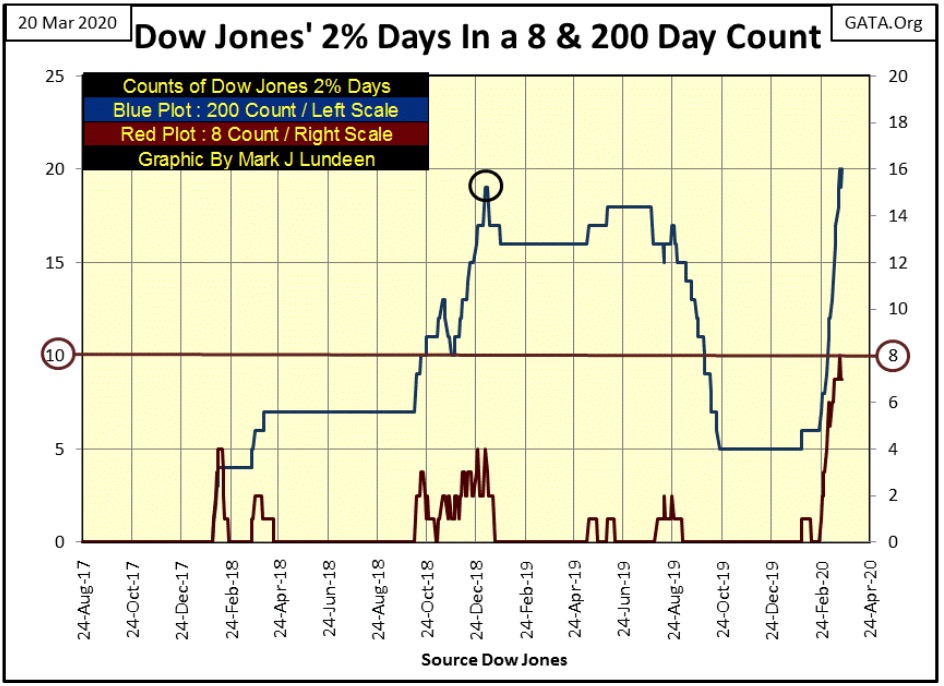
This week saw the Dow Jones 200 count (Blue Plot / left scale below) exceed the 19 it made during the 18% correction seen in December 2018. As this bear market continues it will go much higher.
With the 8 count seeing a rare 8 this week, it can’t go any higher than that. So the thing to watch for now with the 8 count is how long it takes for it to return to a zero, and should it register a zero how long will it stay there? If this is the bear market I think it is, the answer to that question is not long.
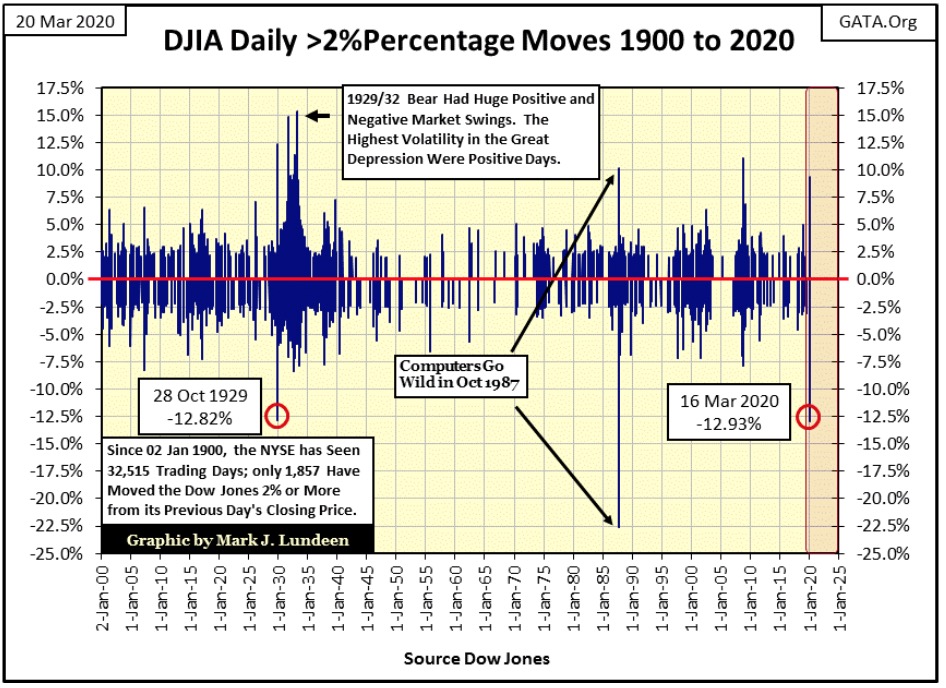
History was again made this week when on Monday the Dow Jones saw a day of extreme volatility of -12.93%, or a percentage decline of 12.93% from the Dow Jones’ close of Friday, March 13th. (Chart below)
Typically when looking at the history of extreme down days for the Dow Jones, everyone looks to October 1987 for its largest percentage down day. This is true, however in my opinion that’s not really accurate.
In October 1987, for the first time computers were controlling the flow of orders to the stock market, and the software controlling Wall Street had a little glitch; should the market begin to decline, the computers were ordered to short the markets.
This created a positive feedback loop in the NYSE: the more the market went down, the more the computers were ordered to short the market – and the more the computers shorted the market, the more the market went down.
At the end of the day, the Dow Jones was down a stunning 22.5%. This one-time computer glitch presented Alan Greenspan, who had become Fed Chairman just a few weeks before, with his first opportunity to stop deflation in its tracks with a massive “injection of liquidity” to “stabilize market valuations.”
Had Greenspan not intervened in the market the Dow Jones may have been down much more than 22.5% at the close of the day, but today, who cares? I believe comparing Monday’s -12.93% decline to the Great Depression’s one day decline of -12.82%, seen on 28 October 1929, to be the right thing to do; making last Monday’s -12.93% decline the deepest one-day loss in the Dow Jones since January 1900.
But if you choose to see the -22.5% decline of October 1987 as the record daily decline, a day when computers mindlessly shorted the market, and lawyers told the authorities to let them for fear of legal considerations should anyone turn the machines off, then Monday’s -12.93% is only the second deepest daily decline since January 1900.
Friday, February 21st saw the market close and all seemed right with the world. Then came Monday, February 24th and daily volatility as seen above in Mr Bear’s report card became historic. What happened in the last weekend of February 2020 that caused this change in the market’s temperament?
I don’t know. For months I’ve been warning my readers about the importance of watching for Dow Jones 2% days as the herald-of-woe for the stock market. I’ve made plenty of mistakes in the past, but not on that! But the timing of when our recent uptick in market volatility began I can’t tie to a triggering event in or out of the market.
This is much the same with the Dow Jones’ top of September 3rd, 1929, the absolute top for the Roaring 1920s’ bull market; a day where all seemed well with the world, which was then followed by a savage three year, 89% market crash.
So, I thought I’d look at Pearl Harbor on December 7th, 1941 and the Kennedy Assassination of November 22nd, 1963 and see how the stock market reacted to these momentous historical events. (Table Below)
Note: the stock market traded in Saturdays until the 1950s. On Saturday, December 6th the Dow Jones closed at 116.6. The Monday following Pearl Harbor the Dow Jones saw a day of extreme volatility; a BIG -3.50% decline, which in December 1941 only took a 4.08 point decline.
It’s important to note the Dow Jones in December 1941 was already in a Big-Bear Market that would ultimately lead to a massive -52.20% market bottom four months later on April 28th 1942. But from its high of 10 March 1937, not Pearl Harbor’s December 7th 1941. By Pearl Harbor the Dow Jones had already deflated 40% from its March 1937 High. Obviously America’s entry into WW2 had little impact on Wall Street.
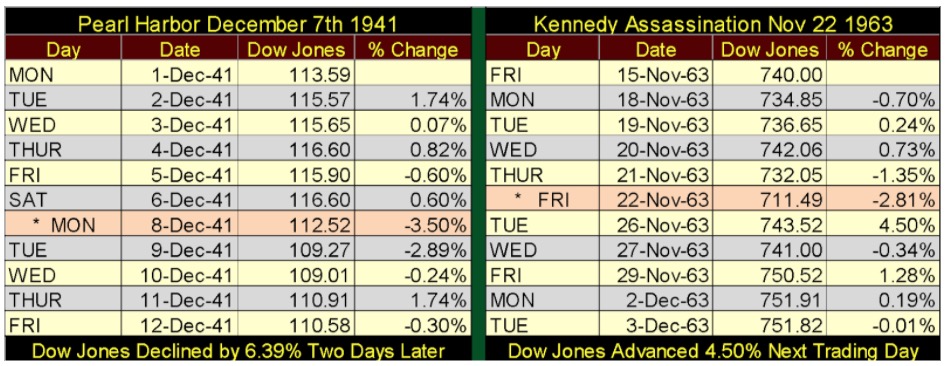
The Kennedy assassination happened during Friday’s trading at the NYSE, resulting in a Dow Jones 2% day (-2.81%). The next trading day was Tuesday November 26th, and the Dow Jones saw another 2% day as it ADVANCED 4.50%, and would see its next (of many to come) new all-time high a few days later on December 5th.
Looking at the data above, Pearl Harbor didn’t result in a bear market, and the Kennedy assassination didn’t slam the brakes on a bull market that had begun in April 1942. So why did the stock market beginning crashing in September 1929 and again in February 2020?
The answer to that is pretty simple; the Federal Reserve and its banking system had inflated market valuations during the 1920s, and again since March 2009 far above where natural market forces would have allowed them to be, as seen in the chart below. In other words; “monetary policy” had created instabilities in the financial markets that only Mr Bear could correct with a stiff dose of deflation and massive liquidation of unviable financial obligations (debts) created by the banking system.
So, if Pearl Harbor and the Kennedy assassination didn’t result in a massive bear-market deflationary event, it’s because in December 1941 and again in November 1963, market valuations were not grossly inflated. Nor was the economy in 1941 and 1963 burdened with massive levels of consumptive debt that strained the financial means of consumers, businesses and local governments to service.
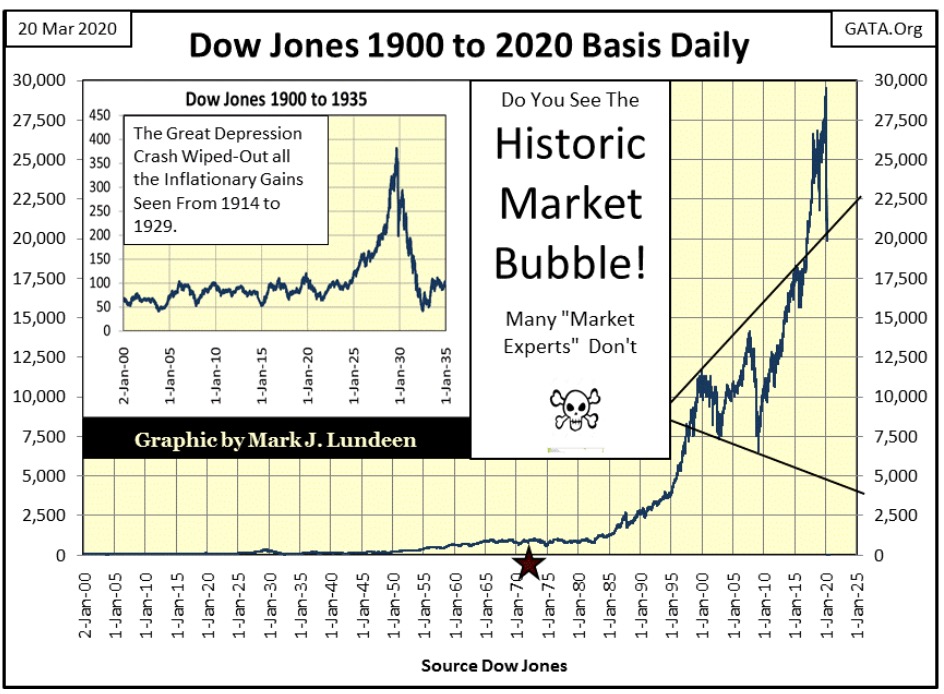
As our bear market continues in the months and possibly years to come, many “market experts” are going to pitch the proposal to the public that our current market decline is the result of the Chinese-coronavirus pandemic.
That’s ridiculous, but many people believe anything they see in the Fake New Media. One thing they’ll never see on CNBC is the chart above plotting the Dow Jones since January 1900, as it’s so embarrassing.
The Red Star marks August 1971 when the “monetary policymakers” decoupled the dollar from its Bretton Woods $35 gold peg. What followed that now long forgotten act was massive inflation of valuations in the stock market; the Dow Jones soaring to over 29,500 in the next forty-nine years. We can also predict what comes next; a massive deflationary bear market that will take the Dow Jones down to levels few “market experts” would care to predict today.
But I’m not a market expert by anyone’s definition; so I dare predict a bear market decline of something greater than 70% before Mr Bear is satisfied and departs Wall Street, which one day he must.
Well, what about gold?
From Bill Murphy’s Le Metropole Café Midas Comments
19 March 2020
Trillions for the banksters. Trillions for the various industries in crisis, if not total collapse. Trillions for the derivatives blowup. Trillions for the equity markets. Trillions for the small businesses and common man(?) Trillions for liquidity funding, mutual fund liquidity, and any other bankster-related entities. Trillions for the coming tsunami of unemployment benefits, health care costs, and shortfalls from plummeting local, state, and Federal tax revenues. So gold at $10k you say? Silver $500 and no offer? HELL no, $1492 and $11.90 so sayeth the Crimex and the Working Group. The fact that both metals are undervalued by 70-95% is a testament to maniacal derivatives, MOPE, and diversions into pseudo-gold investments. I see gold is currently unchanged on the day as if nothing has happened in the past 3 weeks. Criminal!
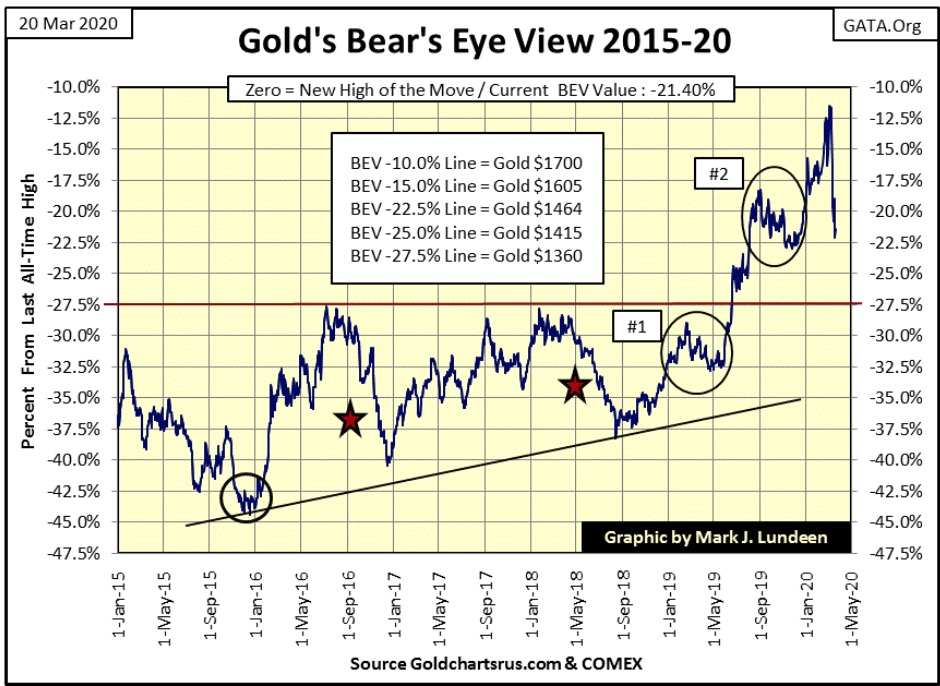
That sums up things in the precious-metal markets, as Washington tosses trillions of dollars here, there and everywhere. Considering how today our “policymakers” must talk in terms of trillions-of-dollars to solve each and every pending problem society is now facing, it really is amazing how at the close of this week gold is 21.40% below its last all-time high of August 2011.
But one of these days gold at $10,000 will be considered cheap, thanks to all the monetary inflation current “policymakers” are now promising to flood the global economy with. Seeing gold in its BEV chart below down in the past two weeks only makes it a more attractive investment.
Gold and its step sum below remain bullish. Yes, gold has seen a sharp selloff recently, but such things happen in bull markets, and maybe the selloff has a bit more to go.
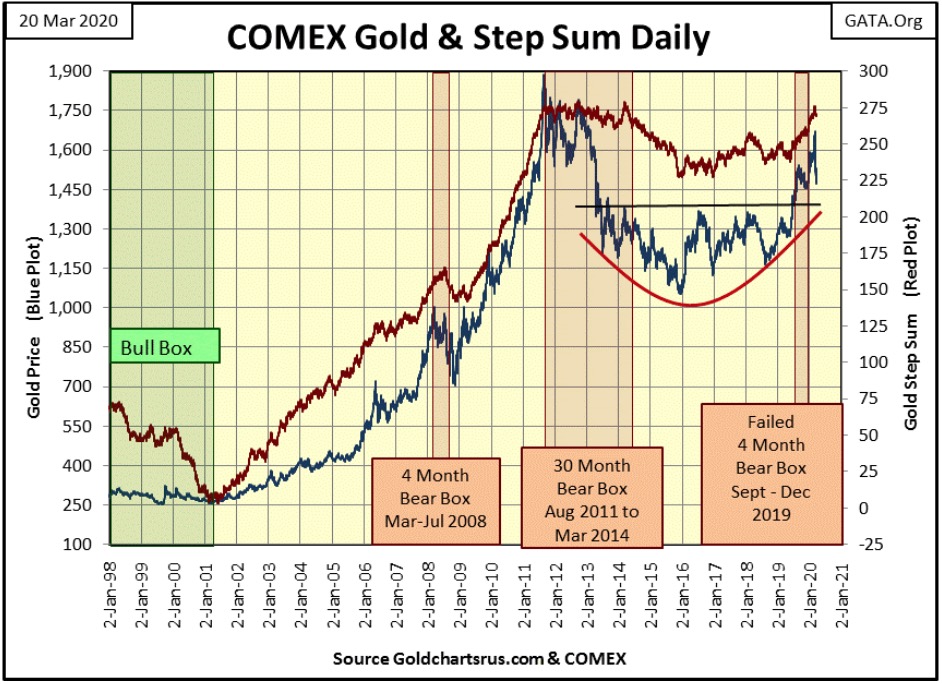
But comparing the technical situation of gold to the Dow Jones in the step sum chart below, gold is a much more attractive place to have one’s investment funds.
I’ve been watching CNBC for the first time in years, to follow the ticker in today’s fast moving markets. And I find it interesting how when talking about gold or silver, CNBC’s “market experts” generally ask why aren’t precious metals going higher? This isn’t a roaring recommendation for gold and silver, but they aren’t bad mouthing the old monetary metals either.
As far as the stock market goes, there is no shortage of “market experts” who are calling bottoms in certain market sectors. Except for the miners of precious metals, an industry sector that today can be purchased for about the same as it could have in 1983, I don’t like anything offered for sale in the stock market. This is especially so for the banks and other financial companies that has been on a morphine drip from the Federal Reserve since 2008.
Look at gold and the Dow Jones’ step sum tables below; in the past twenty-five trading days, gold is down 6.27%, while the Dow Jones is down a stunning 34.78%.
That tells me a lot about today’s markets or as James Dines would state it: it’s a game fish that swims upstream.
Gold also saw its 15 count register a -7 twice this week, meaning it was oversold. Still, for a market in an oversold condition, the price of gold actually held on to its recent gains nicely, so I’m assuming gold remains in a bull market. I’m anticipating the gold market is due for a nice advance sometime in the next few weeks. Of course, it could also become even more oversold and register a -9 sometime next week, but that would take each day next week to be a down day, and that isn’t likely.
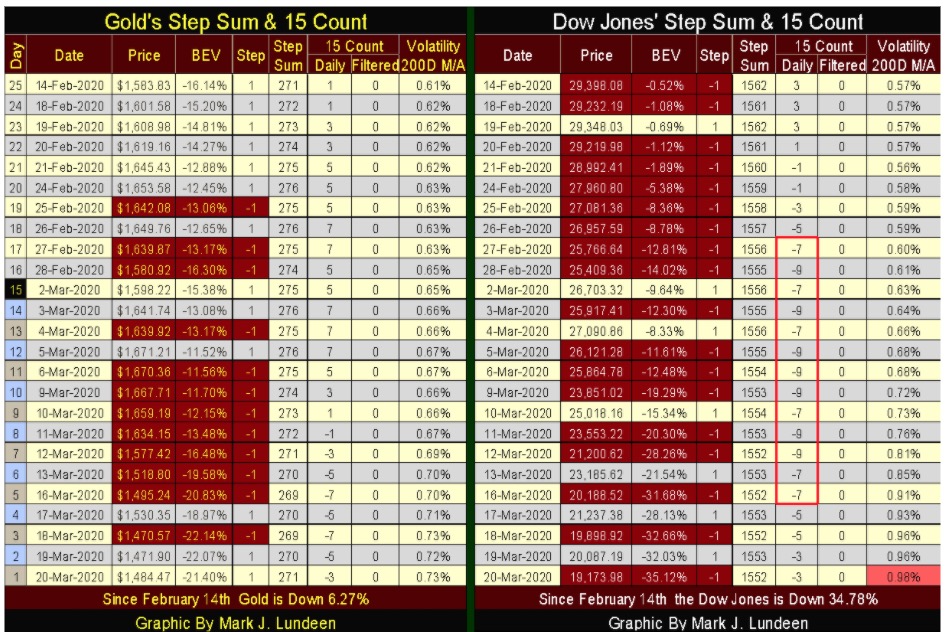
Since late February the Dow Jones saw a block of -7s & -9s in its 15 count that ended on Monday of this week. That’s a lot of selling pressure on the Dow Jones and I would have thought after all those down days the market was due for a bounce. What happened instead was the Dow Jones closed the week with a BEV of -35.12%; a multi-year low.
I haven’t changed my mind the stock market is due for a very nice dead-cat bounce sometime in the next few weeks and months, but maybe Mr Bear isn’t going to let that happen until the Dow Jones breaks below its BEV -40% line in its BEV chart above.
The following is a video clip from Jimmy Dore on where all these trillions of dollars are coming from and the Chinese coronavirus situation.
Jimmy is no gold bug; rather he’s a Bernie-Bro socialist, one of those people the leaders of the Democratic Party have to struggle with to keep their coalition together. But he’s a very funny guy who has an insight to the politics of the American left one doesn’t see in the MSM.

To close the week on a lighter note, here’s Jimmy’s phone call from Pope Francis.

—
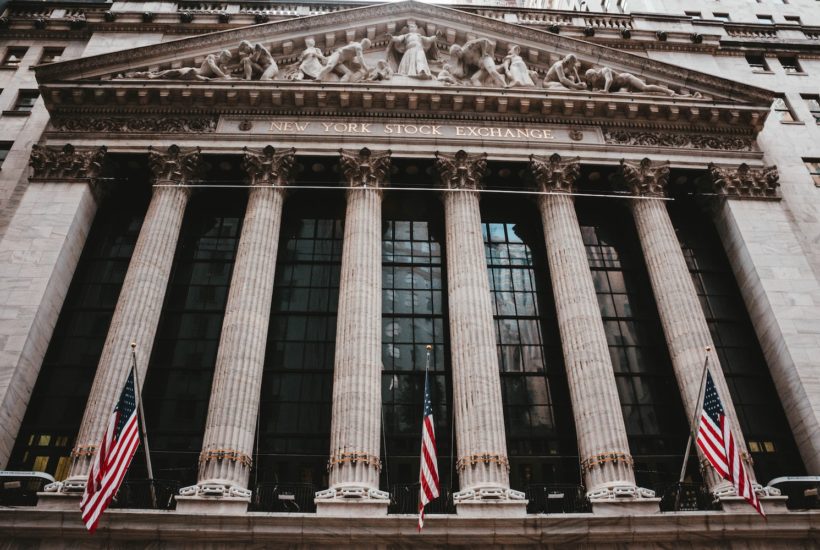
(Featured image by Aditya Vyas on Unsplash)
DISCLAIMER: This article was written by a third party contributor and does not reflect the opinion of Born2Invest, its management, staff or its associates. Please review our disclaimer for more information.
This article may include forward-looking statements. These forward-looking statements generally are identified by the words “believe,” “project,” “estimate,” “become,” “plan,” “will,” and similar expressions. These forward-looking statements involve known and unknown risks as well as uncertainties, including those discussed in the following cautionary statements and elsewhere in this article and on this site. Although the Company may believe that its expectations are based on reasonable assumptions, the actual results that the Company may achieve may differ materially from any forward-looking statements, which reflect the opinions of the management of the Company only as of the date hereof. Additionally, please make sure to read these important disclosures.


Mollie Expands Across EEA With €350M Investment to Strengthen European Payments Network
Fintech company Mollie has expanded into Croatia and Iceland, achieving full coverage of the European Economic Area. It has committed...


Trulieve NYSE Listing Signals New Era for Global Cannabis Industry
Trulieve’s NYSE listing marks a milestone for the cannabis industry, giving a major US producer access to institutional capital after...


Moroccan Bond Market Shows Mixed Signals as Primary Eases and Secondary Pressures Persist
The bond market shows a mixed trend, with cautious easing in the primary market as the Treasury raises limited funds...


Markets Diverge as Oil Falls, Rates Hold, and Inflation Persists
Markets reacted to a U.S.–Iran MOU and unchanged Fed rates, with oil plunging while energy stocks showed divergence. Equities fluctuated...


Cocoa Market Faces Mixed Trends Amid Rising Supply and Weak Demand
New York cocoa prices edged lower Thursday while London closed higher, with mixed but improving daily trends. West Africa’s main...
 |
|
 |  |
 |
|
-

 Crypto1 week ago
Bitcoin Rises on Iran Deal as Crypto Markets React to AI and SpaceX News
-

 Biotech5 days ago
Bavarian Biotech Sector Expands with Record Funding and Startup Growth in 2025
-

 Impact Investing2 weeks ago
EU Approves €23B Italian Renewable Energy Plan to Boost Climate Goals
-
 Business8 hours ago
Markets Diverge as Oil Falls, Rates Hold, and Inflation Persists